

Abstract
Due to emergence of resistant tumor populations, prognosis for metastatic colorectal cancer (CRC) patients remains poor and five-year survival rate is still very low. To guide clinicians in selecting treatment option for CRC patients, reliable markers predictive of poor clinical outcome are desirable. This study analyzed the correlation of NF-E2-related factor 2 (Nrf2), NAD(P)H quinine oxidoreductase 1 (NQO1), multidrug resistant protein 1 (MRP1), cmyc and p53 in CRC and their relationships to Duke’s stage and clinical prognosis. 76 specimens of CRC tissues were immunohistochemically investigated using Nrf2, NQO1, MRP1, cmyc and p53 antibodies. IHC stain showed that Nrf2, NQO1, MRP1, cmyc and p53 were highly expressed in CRC tissues compared with adjacent non-tumor tissues. Significant positive correlations were found between the expression of Nrf2 and that of NQO1, MRP1, cmyc and p53. Moreover, there was significant correlation between the high level of Nrf2, NQO1, MRP1, p53 expression and Duke’s stage, as well as poor clinical prognosis. We confirmed that Nrf2, NQO1, MRP1, and p53 expression exhibits considerable heterogeneity according to CRC clinical stage and prognosis. Nrf2 is the most promising biomarker in identifying a poor prognostic group of CRC.
Keywords: Colorectal cancer (CRC), NF-E2-related factor 2 (Nrf2), NAD(P)H quinine oxidoreductase 1 (NQO1), multidrug resistant protein 1 (MRP1), cmyc, p53
Introduction
Colorectal cancer (CRC) is the third leading cause of cancer-related death worldwide, and the prevalence is expected to increase due to demographic trends and adaption to westernized lifestyle in developing countries. In the Western world, one in 20 will develop CRC before the age of 75. The 5-year survival rate is 90% for patients with local CRC, which decreases to 12% for patients with distant metastasis [1]. At present, besides radical surgery, adjuvant therapies such as chemotherapy and targeted therapy have been widely used. However, there has been no breakthrough in the control of CRC once it develops extra lymph node metastasis. Resistance to either chemotherapy or targeted agents limits the effectiveness of current cancer therapies, including those used to treat metastatic colorectal cancer (mCRC) which is one of the leading causes of cancer-related death worldwide. Therefore, it is necessary to identify new biomarkers that can be target for chemotherapy.
NF-E2-related factor 2 (Nrf2) plays a central role in regulation a battery of genes involved in xenobiotic metabolism and antioxidants. Under unstressed conditions, the transcription factor Nrf2 is negatively regulated by Kelch-like ECH-associated protein 1 (Keap1), a substrate adaptor for the Cul3-dependent E3 ubiquitin ligase complex [2]. When upon recognition of stress imparted by oxidative and electrophilic molecules, Nrf2 is released from Keap1, translocates to the nucleus, and transactivates the expression of cytoprotective genes that enhance cell survival [3]. However, recent studies have shown that constitutively high level of Nrf2 promotes cancer formation and contributes to chemoresistance [4-6], which is called dark side of Nrf2 pathway. Nrf2 is overexpressed in several types of human cancers including lung cancers, breast cancers and colorectal cancers, and more evidence has indicated a positive role of Nrf2 in tumorigenesis and chemoresistance [7-9]. Although much effort has been devoted to the investigation of Nrf2 function in cultured cells and cancer tissues, few research has been undertaken to evaluated the prognostic value of Nrf2 in CRC.
Recently, it has been shown that constitutive activation of Nrf2 contributes to drug resistance by regulating several phase II detoxification enzymes, such as NAD(P)H quinine oxidoreductase 1 (NQO1) and multidrug resistant protein 1 (MRP1) [10,11]. Meanwhile, Gina M. DeNicola’s group has found that oncogenes like K-Ras and Myc can direct increased expression of Nrf2, which is a new mechanism for the activation of the Nrf2 antioxidant program in primary cells and human pancreatic cancer [12]. And it has been revealed that CRC shares common genetic aberrations including K-ras and p53 [13]. However, no research has been performed to analyze the correlation among Nrf2, NQO1, MRP1, cmyc and p53 expression in CRC tissues.
In this study, the expression of Nrf2, NQO1, MRP1, cmyc and p53 was examined by immunohistochemical assay and quantitatively analyzed on the Vetra platform in a total of 76 CRC patients. We investigated the correlation between the expression of NQO1, MRP1, cmyc, p53 and that of Nrf2; and further detected the prognostic significance of Nrf2, NQO1, MRP1, cmyc and p53 expression among these CRC patients.
Materials and methods
Patients and tissues
A total of 76 patients with CRC who underwent surgical resection at Shanghai Huashan Hospital, China, within 2007 were enrolled in the study. They had received no prior radiotherapy or chemotherapy. Cancer and paired normal tissue (5 cm from the tumor margin) specimen was collected from each patient. Histological diagnosis was performed for all the cases by three independent, experienced pathologists. All patients were staged according to Duke’s stage. Permission to use the tissue sections for research purposes was obtained and approved by the Ethics Committee from Shanghai Medical College, Fudan University, China.
The tissue samples used for immunohistochemistry were obtained from the Department of Pathology, Shanghai Huashan Hospital, China.
Immunohistochemical staining
For immunohistochemical assay, the deparaffinized sections were conducted antigen retrieval by heating in sodium citrate buffer, Ph 6.0. The primary antibody was used in a dilution of 1:100 (NQO1, Nrf2, MRP1, cmyc and p53) for 1 h at 37°C and 4°C overnight. Anti-Nrf2 polyclonal antibody (ab76026) and anti-Mrp1 monoclonal antibody (ab24102) were purchased from Abcam Biotechnology, Shanghai, China. Monoclonal antibody against NQO1 (SC-271116) was purchased from Santa Cruz Biotechnology, Santa Cruz, CA. Monoclonal antibody against cmyc (M-0207) and p53 (M-0430) was from Changdao Biotechnology, Shanghai, China. Immunostaining was performed using the avidin–biotin–peroxidase complex method, and antigen–antibody reactions were visualized with chromogen diaminobenzidine (DAB). Finally, slides were counterstained with hematoxylin, dehydrated, and mounted in resin mount.
Immunohistochemical analysis
Two observers who were blinded to clinical and follow-up data evaluated staining results independently and co-observed for a consensus when they were divergent. The Vetra platform (PerkinElmer, Tenax, TA), which is an advanced multispectral imaging system for biomarker quantitation in tissue sections, was used to collect the complete spectral information. All the tissue slides were scanned with the Vetra platform, and in each slide five random fields of vision were selected. Biomarker expression analysis was performed with Vetra 2 software-Nuance and inform. Each slide was evaluated for both the intensity of the stain (Optical Density, OD) and percentage of positive cells. Nrf2, cmyc and p53 immunoreactivity was predominantly in the nucleus. MRP1 immunoreactivity was observed both on cell membrane and in the cytosol. NQO1 immunoreactivity was noted in the cytosol. For the purpose of statistical analysis, 25% of malignant cells showing a stronger intensity than adjacent colorectum epithelium was used as a cutoff value to distinguish tumors with a low (<25%) or high (≥25%) level of Nrf2, NQO1, MRP1, cmyc or p53 expression.
Statistical analysis
Statistical analysis was done using the SPSS software package (ver.13.0, SPSS Inc., Chicago, IL). The association between intensity of staining index and level of Duke’s stage or prognosis (survive or dead) was analyzed using the χ2 test. The Pearson correlation analysis was performed to compare the correlation of Nrf2 expression with the other four staining indexes NQO1, MRP1, cmyc and p53. Paired Student’s t tests were used to compare both the intensity of the stain and percentage of positive malignant cells between adjacent normal colorectum tissues and colorectal cancer tissues. The experimental differences were determined by two-tailed Student’s t-test and p<0.05 was taken as significant difference in all cases. The value of fold change (between CRC and adjacent non-tumor tissues), which is <0.7 or >1.5 has significant meaning.
Results
Expression of Nrf2, NQO1, MRP1, cmyc and p53 was correlative and higher in CRC than adjacent non-tumor tissues
Levels of Nrf2, NQO1, MRP1, cmyc and p53 were evaluated by immunohistochemical analysis. The HE staining in the panel of A1 and A2 in Figure 1 revealed the adjacent non-tumor tissues and corresponding malignant hyperplasia, which is helpful to localize the positive signal in IHC-stained sections. Nrf2, cmyc and p53 immunoreactivity were seen predominantly in the nucleus, while NQO1 was found primarily in the cytosol. And for MRP1, its immunoreactivity was observed both on cell membrane and in the cytosol. As downstream genes of Nrf2, the expression pattern of NQO1 and MRP1 was similar with Nrf2. With increased expression of Nrf2 in CRC tissues compared with adjacent non-tumor tissues, expression of NQO1 and MRP1 also increased obviously (Figure 1, compare E2 with E1, D2 with D1, C2 with C1). Moreover, expression of cmyc and p53 also showed the same stain tendency (Figure 1, compare panel B2 with B1, and F2 with F1).
Figure 1.
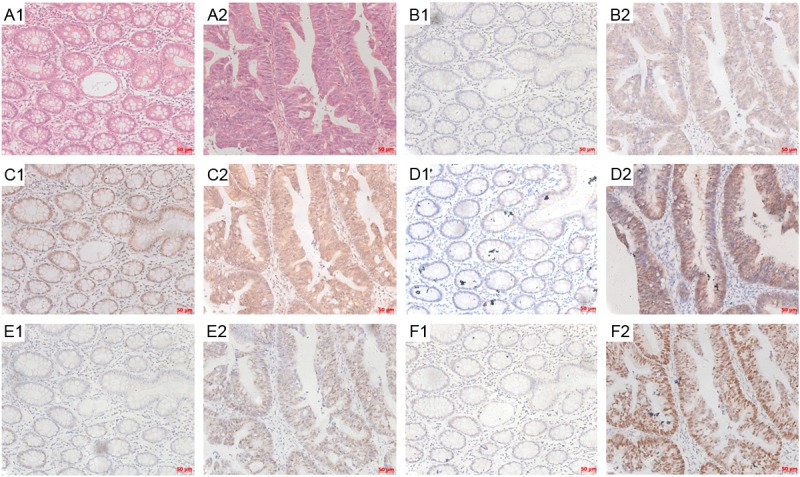
Immunohistochemical staining results for Nrf2, NQO1, MRP1, cmyc and p53 expression in CRC. The unstained tissue slides from CRC were subject to HE staining (A1, A2) and IHC staining with antibodies against cmyc (B1, B2), MRP1 (C1, C2), NQO1 (D1, D2), Nrf2 (E1, E2) and p53 (F1, F2). Adjacent normal colorectum tissues were shown in A1, B1, C1, D1, E1 and F1 panels, while CRC tissues were shown in A2, B2, C2, D2, E2 and F2 panels. The bar scales were labeled at the lower right corner of each pictures.
The IHC staining sections were also analyzed and measured by the Vectra platform multispectral imaging system to quantitate the expression of Nrf2, NQO1, MRP1, cmyc and p53 in both CRC tissues and adjacent non-tumor tissues. IHC stain sections were evaluated for both the intensity of the stain and percentage of positive cells. Nrf2, NQO1, MRP1, cmyc and p53 showed significantly higher expression in contrast with the adjacent non-tumor tissue (Table 1, Figure 2, *P<0.001).
Table 1.
Paired-t Test Between Normal and Tumor Tissues for Different Expression of Nrf2, MRP1, NQO1, cmyc, and p53
| Optical Density of DAB stain | Percentage of positive malignant cells | ||||||
|---|---|---|---|---|---|---|---|
|
|
|
||||||
| Variables | total | Mean±SD | Fold change (tumor/normal) | P | Mean±SD | Fold change (tumor/normal) | P |
| Nrf2 | 1.725 | <0.001 | 2.523 | <0.001 | |||
| normal | 76 | 0.032±0.017 | 0.176±0.140 | ||||
| tumor | 76 | 0.054±0.042 | 0.443±0.370 | ||||
| MRP1 | 1.734 | <0.001 | 1.369 | <0.001 | |||
| normal | 76 | 0.082±0.047 | 0.665±0.249 | ||||
| tumor | 76 | 0.142±0.065 | 0.911±0.111 | ||||
| NQO1 | 2.437 | <0.001 | 6.149 | <0.001 | |||
| normal | 76 | 0.020±0.011 | 0.059±0.149 | ||||
| tumor | 76 | 0.049±0.047 | 0.363±0.379 | ||||
| cmyc | 2.102 | <0.001 | 1.425 | <0.001 | |||
| normal | 76 | 0.043±0.023 | 0.473±0.253 | ||||
| tumor | 76 | 0.091±0.047 | 0.674±0.300 | ||||
| p53 | 2.288 | <0.001 | 8.728 | <0.001 | |||
| normal | 76 | 0.078±0.051 | 0.089±0.130 | ||||
| tumor | 76 | 0.179±0.100 | 0.780±0.310 | ||||
Figure 2.
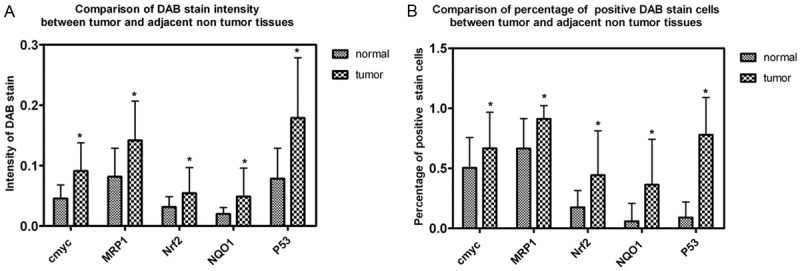
Statistical analysis of IHC data using a quantitative scoring system. IHC staining sections were analyzed and measured on the Vectra platform to quantitate the expression of Nrf2, NQO1, MRP1, cmyc and p53 in both CRC tissues and adjacent non-tumor tissues. IHC stain sections were evaluated for both the intensity of the stain and percentage of positive cells. Different level of Nrf2, NQO1, MRP1, cmyc and p53 expression was compared between CRC tissues and adjacent non-tumor tissues.
To confirm the correlation of their expression by twos, Pearson correlation test was next performed either by intensity of DAB stain or by percentage of positive malignant cells in both CRC tissues and adjacent non-tumor tissues (Table 2). Significant positive correlations were found between the expression status of Nrf2 and that of NQO1 and MRP1. Pearson correlation coefficient (r) for Nrf2-NQO1 and for Nrf2-MRP1 equals to 0.192, 0.17 by intensity of DAB stain (Table 2, *P<0.05) and 0.230, 0.248 by percentage of positive cells (Table 2, **P<0.01), which confirmed the positive correlation of NQO1, MRP1 with Nrf2. Pearson correlation coefficient (r) for Nrf2-cmyc and Nrf2-p53 equals to 0.191, 0.319 by percentage of positive cells (Table 2, *P<0.05, **P<0.01), which suggested there might be some correlation among the three gene.
Table 2.
Correlation between cmyc, p53, MRP1, NQO1 and Nrf2 in CRC
| Correlation by density of DAB stain | |||||
|
| |||||
| cmyc | p53 | MRP1 | NQO1 | ||
|
| |||||
| Nrf2 | Pearson correlation | 0.129 | 0.104 | 0.17* | 0.192* |
| P value (bilateral) | 0.114 | 0.2 | 0.036 | 0.018 | |
| N | 152 | 152 | 152 | 152 | |
|
| |||||
| Correlation by percentage of positive cells | |||||
|
| |||||
| cmyc | p53 | MRP1 | NQO1 | ||
|
| |||||
| Nrf2 | Pearson correlation | 0.191* | 0.319** | 0.248** | 0.230** |
| P value (bilateral) | 0.018 | 0 | 0.002 | 0.004 | |
| N | 152 | 152 | 152 | 152 | |
P<0.05.
P<0.01.
Expression of Nrf2, NQO1, MRP1, cmyc and p53 in CRC and their relationship to clinicopathologic variables
The level of Nrf2, NQO1, MRP1, cmyc and p53 expression was divided into high group and low group according to the cutoff value stated in aforementioned methods. Except cmyc, there were significant positive correlations between Nrf2, NQO1, MRP1, and p53 expression and Duke’s stage. However, the high level rates were not significantly correlated with gender or age (Table 3).
Table 3.
Clinicopathologic Variables and the Expression Status of Nrf2, NQO1, MRP1, cmyc, and P53
| Variables | Total | Nrf2 | P | NQO1 | P | MRP1 | P | cmyc | P | P53 | P | |||||
|---|---|---|---|---|---|---|---|---|---|---|---|---|---|---|---|---|
|
|
|
|
|
|
||||||||||||
| Low | High | Low | High | Low | High | Low | High | Low | High | |||||||
| Duke’s staging | 0.005 | 0.009 | 0.013 | 0.113 | 0.001 | |||||||||||
| A | 20 | 14 | 6 | 14 | 6 | 15 | 5 | 11 | 9 | 13 | 7 | |||||
| B | 26 | 11 | 15 | 12 | 14 | 10 | 16 | 7 | 19 | 7 | 19 | |||||
| C | 27 | 6 | 21 | 7 | 20 | 10 | 17 | 12 | 15 | 4 | 23 | |||||
| D | 3 | 0 | 3 | 0 | 3 | 0 | 3 | 0 | 3 | 0 | 3 | |||||
| Age | 0.244 | 0.188 | 0.835 | 0.510 | 0.786 | |||||||||||
| <60 | 27 | 10 | 17 | 9 | 18 | 12 | 15 | 12 | 15 | 8 | 19 | |||||
| ≥60 | 49 | 21 | 28 | 24 | 25 | 23 | 26 | 18 | 31 | 16 | 33 | |||||
| Gender | 0.431 | 0.272 | 0.264 | 0.4 | 0.755 | |||||||||||
| Male | 40 | 18 | 22 | 15 | 25 | 16 | 24 | 14 | 26 | 12 | 28 | |||||
| Female | 36 | 13 | 23 | 18 | 18 | 19 | 17 | 16 | 20 | 12 | 24 | |||||
Association of Nrf2, NQO1, MRP1, cmyc and p53 expression with clinical prognosis
Pearson χ2 test was performed to analyze the association of Nrf2, NQO1, MRP1, cmyc and p53 expression with clinical prognosis (survive or dead in five years after diagnose). There were significant positive correlations between Nrf2, NQO1, MRP1, and p53 expression and clinical prognosis (Table 4). However, there was no statistical correlation between cmyc expression and clinical prognosis.
Table 4.
Clinical Prognosis and Expression Status of Nrf2, MRP1, NQO1, cmyc and p53
| Variables | Total | Survive | Dead | Mortality | P (bilateral) | |
|---|---|---|---|---|---|---|
| Nrf2 | low | 31 | 18 | 13 | 41.90% | 0.033 |
| high | 45 | 15 | 30 | 66.70% | ||
| MRP1 | low | 35 | 20 | 15 | 42.90% | 0.026 |
| high | 41 | 13 | 28 | 56.60% | ||
| NQO1 | low | 33 | 23 | 10 | 30.30% | 0 |
| high | 43 | 10 | 33 | 76.70% | ||
| cmyc | low | 30 | 16 | 14 | 46.70% | 0.159 |
| high | 46 | 17 | 29 | 56.60% | ||
| p53 | low | 24 | 16 | 8 | 33.30% | 0.005 |
| high | 52 | 17 | 35 | 56.60% | ||
Discussion
In spite of a number of successful systemic therapies for cancer treatment, the prognosis for CRC patients with distant metastasis remains poor and long-term survival rates remain low [1]. Due to emergence of resistant tumor populations, tumor response to chemotherapy is often transient and tumor therapy frequently fails. The identification of mechanisms of drug resistance may highlight new biomarkers useful to predict the clinical outcome or the likely responsiveness to pharmacological treatment of those metastatic CRC patients who cannot benefit from current therapeutic regimen. Moreover, the recognition of panels of biomarkers may suggest new strategies to overcome resistance by rational drug design and combination treatment.
Nrf2 was identified as the main transcription factor that mediates ARE-driven transcription [14]. It regulates the antioxidant response by introducing the expression of genes bearing an ARE in their regulatory regions, such as NQO1, GCS, and HO-1 [15-17]. Activation of the Nrf2 pathway composes a cellular protective system that promotes cell survival under detrimental environments [18,19]. However, recent emerging data have revealed the “dark” side of Nrf2.Constitutively high level of Nrf2 and its downstream genes are overexpressed in many types of human cancer which promotes cancer formation and contributes to chemoresistance [4-6,20]. Overexpression of Nrf2 downstream genes gives cancer cells an advantage for survival and growth. NQO1 is a cytosolic flavoprotein that catalyzes the two electron reductive metabolism and detoxification of endogenous and exogenous chemicals [21]. Apart from its role in drug metabolism, NQO1 also defends against intracellular oxidative stress by scavenging superoxide [22] and maintaining the reduced form of endogenous antioxidants [23]. MRP1 was first cloned highly over-expressed in a doxorubicin-selected multidrug resistant human lung carcinoma cell line H69AR [24]. In our previous study, it was found that MRP1 was regulated by Nrf2 pathway in small cell lung cancer [11]. In tumor cells, the 190 kDa MRP1 can confer resistance to not only doxorubicin, but also many other widely used antineoplastic drug, such as methotrexate (MTX), daunorubicin, vincristine and etoposide [25].
In this study, we showed that Nrf2, NQO1 and MRP1 were highly expressed in CRC tissues compared with adjacent non-tumor tissues. Moreover, there was significant positive correlation between the expression status of Nrf2 and that of NQO1 and MRP1 in CRC, which was in line with our previous study [11]. This Nrf2-NQO1/MRP1 signal pathway may be attributed to the stress response and self-protective effort of the cells during malignant transformation. More importantly, there were significant correlations between the high level of Nrf2, NQO1, and MRP1 expression and Duke’s stage, clinical prognosis, which suggested that Nrf2 may serve as a prognostic marker in CRC. This prognostic value of Nrf2 might be based on its important role in chemoresistance. Considering the role of Nrf2 in regulating a battery of genes including NQO1 and MRP1, which act to detoxify drugs or attenuate drug-induced oxidative stress, it is possible that highly expressed nuclear Nrf2 plays a role in increasing treatment resistance and results in short survival.
It is noteworthy that in previous studies, Nrf2 is negatively controlled by Keap1, which is an adaptor of the ubiquitin ligase complex, under quiescent conditions. However, Denicola and colleague’s insightful study showed that the Keap1-Nrf2 pathway in mouse cells could also be activated by means other than mutations in Keap1 or Nrf2 [12]. They found that oncogenes like K-ras and Myc can regulate Nrf2 transcription through a Mek-Erk-Jun signaling pathway. Moreover, a number of oncogenic lesions—for instance, loss of the tumor suppressor protein p53—are associated with increased ROS levels, which seems to drive tumorigenesis [26]. Therefore, expression of cmyc and p53 were also examined in this 76 CRC patient group by IHC. According to our results, there was significant positive correlation between high level of p53 expression and Duke’s stage, clinical prognosis, while cmyc failed to have a clinical stage and prognosis meaning. On the other hand, both of them showed the same stain tendency as Nrf2, which was highly expressed in CRC tissues compared with adjacent non-tumor tissues. Furthermore, the positive correlations between the expression of cmyc, p53 and that of Nrf2 suggested the possibility of regulation among these three genes. Are cmyc and p53 the upstream genes of Nrf2 which contribute to facilitate tumorigenesis in CRC? This hypothesis needs to be verified by further studies.
Acknowledgements
This work was partly supported by operating research grant from Natural Science Foundation of China (NSFC81201899 to Shuyang Wang).
Disclosure of conflict of interest
None.
References
- 1.Siegel R, Naishadham D, Jemal A. Cancer statistics, 2013. CA Cancer J Clin. 2013;63:11–30. doi: 10.3322/caac.21166. [DOI] [PubMed] [Google Scholar]
- 2.Furukawa M, Xiong Y. BTB protein Keap1 targets antioxidant transcription factor Nrf2 for ubiquitination by the Cullin 3-Roc1 ligase. Mol Cell Biol. 2005;25:162–171. doi: 10.1128/MCB.25.1.162-171.2005. [DOI] [PMC free article] [PubMed] [Google Scholar]
- 3.Kensler TW, Wakabayashi N, Biswal S. Cell survival responses to environmental stresses via the Keap1-Nrf2-ARE pathway. Annu Rev Pharmacol Toxicol. 2007;47:89–116. doi: 10.1146/annurev.pharmtox.46.120604.141046. [DOI] [PubMed] [Google Scholar]
- 4.Lau A, Villeneuve NF, Sun Z, Wong PK, Zhang DD. Dual roles of Nrf2 in cancer. Pharmacol Res. 2008;58:262–270. doi: 10.1016/j.phrs.2008.09.003. [DOI] [PMC free article] [PubMed] [Google Scholar]
- 5.Hayes JD, McMahon M. The double-edged sword of Nrf2: subversion of redox homeostasis during the evolution of cancer. Mol Cell. 2006;21:732–734. doi: 10.1016/j.molcel.2006.03.004. [DOI] [PubMed] [Google Scholar]
- 6.Kensler TW, Wakabayashi N. Nrf2: friend or foe for chemoprevention? Carcinogenesis. 2010;31:90–99. doi: 10.1093/carcin/bgp231. [DOI] [PMC free article] [PubMed] [Google Scholar]
- 7.Homma S, Ishii Y, Morishima Y, Yamadori T, Matsuno Y, Haraguchi N, Kikuchi N, Satoh H, Sakamoto T, Hizawa N, Itoh K, Yamamoto M. Nrf2 enhances cell proliferation and resistance to anticancer drugs in human lung cancer. Clin Cancer Res. 2009;15:3423–3432. doi: 10.1158/1078-0432.CCR-08-2822. [DOI] [PubMed] [Google Scholar]
- 8.Kim SK, Yang JW, Kim MR, Roh SH, Kim HG, Lee KY, Jeong HG, Kang KW. Increased expression of Nrf2/ARE-dependent anti-oxidant proteins in tamoxifen-resistant breast cancer cells. Free Radic Biol Med. 2008;45:537–546. doi: 10.1016/j.freeradbiomed.2008.05.011. [DOI] [PubMed] [Google Scholar]
- 9.Cheung KL, Lee JH, Khor TO, Wu TY, Li GX, Chan J, Yang CS, Kong AN. Nrf2 knockout enhances intestinal tumorigenesis in Apc (min/+) mice due to attenuation of anti-oxidative stress pathway while potentiates inflammation. Mol Carcinog. 2014 Jan;53:77–84. doi: 10.1002/mc.21950. [DOI] [PubMed] [Google Scholar]
- 10.Anwar-Mohamed A, Degenhardt OS, El Gendy MA, Seubert JM, Kleeberger SR, El-Kadi AO. The effect of Nrf2 knockout on the constitutive expression of drug metabolizing enzymes and transporters in C57Bl/6 mice livers. Toxicol In Vitro. 2011;25:785–795. doi: 10.1016/j.tiv.2011.01.014. [DOI] [PubMed] [Google Scholar]
- 11.Ji L, Li H, Gao P, Shang G, Zhang DD, Zhang N, Jiang T. Nrf2 pathway regulates multidrug-resistance-associated protein 1 in small cell lung cancer. PLoS One. 2013;8:e63404. doi: 10.1371/journal.pone.0063404. [DOI] [PMC free article] [PubMed] [Google Scholar]
- 12.DeNicola GM, Karreth FA, Humpton TJ, Gopinathan A, Wei C, Frese K, Mangal D, Yu KH, Yeo CJ, Calhoun ES, Scrimieri F, Winter JM, Hruban RH, Iacobuzio-Donahue C, Kern SE, Blair IA, Tuveson DA. Oncogene-induced Nrf2 transcription promotes ROS detoxification and tumorigenesis. Nature. 2011;475:106–109. doi: 10.1038/nature10189. [DOI] [PMC free article] [PubMed] [Google Scholar]
- 13.Berg M, Danielsen SA, Ahlquist T, Merok MA, Agesen TH, Vatn MH, Mala T, Sjo OH, Bakka A, Moberg I, Fetveit T, Mathisen O, Husby A, Sandvik O, Nesbakken A, Thiis-Evensen E, Lothe RA. DNA sequence profiles of the colorectal cancer critical gene set KRAS-BRAF-PIK3CA-PTEN-TP53 related to age at disease onset. PLoS One. 2010;5:e13978. doi: 10.1371/journal.pone.0013978. [DOI] [PMC free article] [PubMed] [Google Scholar]
- 14.Itoh K, Chiba T, Takahashi S, Ishii T, Igarashi K, Katoh Y, Oyake T, Hayashi N, Satoh K, Hatayama I, Yamamoto M, Nabeshima Y. An Nrf2/small Maf heterodimer mediates the induction of phase II detoxifying enzyme genes through antioxidant response elements. Biochem Biophys Res Commun. 1997;236:313–322. doi: 10.1006/bbrc.1997.6943. [DOI] [PubMed] [Google Scholar]
- 15.Favreau LV, Pickett CB. Transcriptional regulation of the rat NAD(P)H:quinone reductase gene. Identification of regulatory elements controlling basal level expression and inducible expression by planar aromatic compounds and phenolic antioxidants. J Biol Chem. 1991;266:4556–4561. [PubMed] [Google Scholar]
- 16.Moinova HR, Mulcahy RT. An electrophile responsive element (EpRE) regulates beta-naphthoflavone induction of the human gamma-glutamylcysteine synthetase regulatory su- bunit gene. Constitutive expression is mediated by an adjacent AP-1 site. J Biol Chem. 1998;273:14683–14689. doi: 10.1074/jbc.273.24.14683. [DOI] [PubMed] [Google Scholar]
- 17.Alam J, Wicks C, Stewart D, Gong P, Touchard C, Otterbein S, Choi AM, Burow ME, Tou J. Mechanism of heme oxygenase-1 gene activation by cadmium in MCF-7 mammary epithelial cells. Role of p38 kinase and Nrf2 transcription factor. J Biol Chem. 2000;275:27694–27702. doi: 10.1074/jbc.M004729200. [DOI] [PubMed] [Google Scholar]
- 18.Zhang DD. Mechanistic studies of the Nrf2-Keap1 signaling pathway. Drug Metab Rev. 2006;38:769–789. doi: 10.1080/03602530600971974. [DOI] [PubMed] [Google Scholar]
- 19.Osburn WO, Kensler TW. Nrf2 signaling: an adaptive response pathway for protection against environmental toxic insults. Mutat Res. 2008;659:31–39. doi: 10.1016/j.mrrev.2007.11.006. [DOI] [PMC free article] [PubMed] [Google Scholar]
- 20.Hayes JD, McMahon M. NRF2 and KEAP1 mutations: permanent activation of an adaptive response in cancer. Trends Biochem Sci. 2009;34:176–188. doi: 10.1016/j.tibs.2008.12.008. [DOI] [PubMed] [Google Scholar]
- 21.Ross D. Quinone reductases multitasking in the metabolic world. Drug Metab Rev. 2004;36:639–654. doi: 10.1081/dmr-200033465. [DOI] [PubMed] [Google Scholar]
- 22.Siegel D, Gustafson DL, Dehn DL, Han JY, Boonchoong P, Berliner LJ, Ross D. NAD(P)H:quinone oxidoreductase 1: role as a superoxide scavenger. Mol Pharmacol. 2004;65:1238–1247. doi: 10.1124/mol.65.5.1238. [DOI] [PubMed] [Google Scholar]
- 23.Siegel D, Bolton EM, Burr JA, Liebler DC, Ross D. The reduction of alpha-tocopherolquinone by human NAD(P)H: quinone oxidoreductase: the role of alpha-tocopherolhydroquinone as a cellular antioxidant. Mol Pharmacol. 1997;52:300–305. doi: 10.1124/mol.52.2.300. [DOI] [PubMed] [Google Scholar]
- 24.Cole SP, Bhardwaj G, Gerlach JH, Mackie JE, Grant CE, Almquist KC, Stewart AJ, Kurz EU, Duncan AM, Deeley RG. Overexpression of a transporter gene in a multidrug-resistant human lung cancer cell line. Science. 1992;258:1650–1654. doi: 10.1126/science.1360704. [DOI] [PubMed] [Google Scholar]
- 25.Borst P, Evers R, Kool M, Wijnholds J. A family of drug transporters: the multidrug resistance-associated proteins. J Natl Cancer Inst. 2000;92:1295–1302. doi: 10.1093/jnci/92.16.1295. [DOI] [PubMed] [Google Scholar]
- 26.Sablina AA, Budanov AV, Ilyinskaya GV, Agapova LS, Kravchenko JE, Chumakov PM. The antioxidant function of the p53 tumor suppressor. Nat Med. 2005;11:1306–1313. doi: 10.1038/nm1320. [DOI] [PMC free article] [PubMed] [Google Scholar]