

Abstract
Background
We aimed to test the hypothesis that 3-D volume-based scoring of computed tomographic (CT) images of the paranasal sinuses was superior to Lund-Mackay CT scoring of disease severity in chronic rhinosinusitis (CRS). We determined correlation between changes in CT scores (using each scoring system) with changes in other measures of disease severity (symptoms, endoscopic scoring, and quality of life) in patients with CRS treated with triamcinolone.
Methods
The study group comprised 48 adult subjects with CRS. Baseline symptoms and quality of life were assessed. Endoscopy and CT scans were performed. Patients received a single systemic dose of intramuscular triamcinolone and were reevaluated 1 month later. Strengths of the correlations between changes in CT scores and changes in CRS signs and symptoms and quality of life were determined.
Results
We observed some variability in degree of improvement for the different symptom, endoscopic, and quality-of-life parameters after treatment. Improvement of parameters was significantly correlated with improvement in CT disease score using both CT scoring methods. However, volumetric CT scoring had greater correlation with these parameters than Lund-Mackay scoring.
Conclusion
Volumetric scoring exhibited higher degree of correlation than Lund-Mackay scoring when comparing improvement in CT score with improvement in score for symptoms, endoscopic exam, and quality of life in this group of patients who received beneficial medical treatment for CRS.
Keywords: computed tomography, computer-assisted image analysis, endoscopy, quality of life, Lund-Mackay
Introduction
For decades, rhinosinusitis has been documented as the most common chronic illness in the United States. It affects a large proportion of the population 1 and is rising in incidence 2. Chronic rhinosinusitis (CRS) is associated with marked socioeconomic impact 3 and detriment to the patient’s overall well-being 4. It is characterized by chronic inflammation and changes in the nasal and paranasal sinus mucosa that range from inflammatory thickening to gross polyp formation.
Computed tomographic (CT) scanning is useful for assessing changes in paranasal sinus mucosa 5. Mucosal thickening on CT currently is considered an objective diagnostic criterion for CRS 6. Furthermore, CT scanning is also used to assess efficacy of various medical and surgical treatments for CRS. To perform such efficacy studies, CT findings must be summarized, and various scoring methods have been proposed 7, with the goal of improving correlation between CT results and other findings. Improving the diagnostic capability of a tool that can objectively assess changes in disease will aid the ongoing quest to find optimal treatment of CRS.
The Lund-Mackay scoring system 8 is most widely used and was recommended by the American Academy of Otolaryngology–Head and Neck Surgery Task Force on Rhinosinusitis for further outcomes research 9–11. Nevertheless, questions have been raised regarding how well existing CT scoring systems correlate with the clinical manifestations of CRS 12. Zinreich 7 noted that the Lund-Mackay system was the most widely accepted, objective, and reproducible of the 4 scoring systems he evaluated, but he also noted that it did not account for the volume of inflammatory disease. He suggested that quantifying disease volume could add clinical value to future classification systems and proposed using magnetic resonance imaging (MRI) to assess the volume of inflammatory mucosa.
Two-dimensional assessment of sinus disease has been used in assessing the effect of medication for CRS 13,14, showing a reduction in disease on the coronal images from a consistent maxillary sinus location. Savranlar et al 15 reported a statistically significant difference in CT sinus mucosal thickness measurements before and after patients used decongestant spray, but Lund-Mackay scoring results of the same CTs did not show a corresponding difference.
A 3-dimensional (3-D) assessment that can determine the percent volume of disease from CT images would be the most comprehensive and precise information that could be obtained about disease severity on CT images. Sanchez Fernandez et al 16 used CT images to calculate sinus volume, and Deeb et al17 in 2011 reported measuring mucosal disease and total sinus volume for maxillary sinuses. However, no published reports have described using imaging data (CT or MRI) to score the total percent volume of sinus disease when staging CRS. Here, we compared a scoring system that considered volume percent of sinus disease (hereafter termed volumetric scoring) with the Lund-Mackay scoring system for CT assessment of CRS to determine if volumetric scoring was superior in correlating with changes from medical treatment that occurred in other measures of disease severity (symptoms, endoscopic findings, and quality of life).
Materials and Methods
This prospective study, after passing approval by the Radiation Safety Committee, was approved by the Mayo Clinic Institutional Review Board. Patients were screened for any contraindications to therapy with triamcinolone acetonide (e.g. hypertension, diabetes mellitus, ulcers, or osteoporosis) or other exclusion criteria (Box 1). Long-term experience with a single dose of intramuscular triamcinolone has shown that adverse effects are extremely rare. Although long-term adverse effects would not apply to the patients receiving a single dose of triamcinolone in this study, as part of the informed consent process, all subjects were apprised of the possible adverse effects of short-term and long-term treatment with systemic corticosteroid medication.
Box 1. Exclusion Criteria.
| Upper respiratory infection or acute sinus infection within 2 weeks before the baseline or 1-month follow-up evaluations |
| Having had oral or parenteral glucocorticoids in the 3 months preceding the baseline study |
| Women who were pregnant or lactating |
| Persons younger than 18 years |
| Immunosuppressed persons |
| Patients with acute or chronic complications of chronic rhinosinusitis (eg, brain abscess, related problems with eyes or central nervous system) |
| Patients with hypertension, diabetes mellitus, ulcers, or osteoporosis; other conditions that might preclude safe administration of a single dose of triamcinolone |
Study subjects with a diagnosis of CRS were recruited from July 10, 2006 to April 18, 2008 after consultation in the Department of Otorhinolaryngology or the Division of Allergic Diseases at Mayo Clinic (Rochester, Minnesota) All patients provided written informed consent.
Treatment
Although no definitive long-term cure for CRS exists, a consistent and dramatic short-term improvement in symptoms and intranasal examination findings can occur with systemic glucocorticoid treatment. It is used only intermittently for short-term therapy to avoid potential adverse effects associated with long-term use. For over 4 decades, a common practice in the Mayo Clinic Department of Otorhinolaryngology has been to use intramuscular triamcinolone acetonide for some patients with CRS who have refractory symptoms. Adverse effects have been observed rarely.
All patients underwent clinical evaluation. Patients whose treatment would include a single dose of IM triamcinolone were offered enrollment in the study. Enrollment was refused to any patients in whom screening revealed a contraindication to administration of triamcinolone. For those enrolled, treatment was a single intramuscular dose of triamcinolone acetonide in the gluteus maximus (60 mg for patients less than 70 kg, 80 mg for those greater than or equal to 70 kg).
Study Design
The study design was prospective. Before recruiting patients, a power calculation determined that we needed complete data from 40 subjects (out of 50 enrolled) to adequately power the study. Based on that sample size, it was determined the study would have 80% power to declare an observed correlation of 0.41 as significantly different from zero. This calculation was based on a two-sided Fisher’s z test of the null hypothesis that the Pearson correlation coefficient is zero, and a type I error level of 5%. We anticipated that the use of triamcinalone would have a moderate to large effect on chronic rhinosinusitis symptoms, and thus have the best chance of revealing any difference between the scoring systems in assessing patients with CRS using this sample size and the parameters in this study.
Because we aimed to compare the 2 scoring systems in the same group of CRS patients before and after a single treatment, there was no role for randomization, control subjects, or placebo treatment.
To be included in the study, subjects had to fulfill the American Academy of Otorhinolaryngology–Head and Neck Surgery criteria for the diagnosis of CRS (Box 2). In addition, patients were required to have CT findings showing mucosal thickening of at least 5 mm in 2 or more sinuses. In 2007, subsequent to the onset of this study, the diagnostic criteria for adults were revised by the Academy (Box 2) 6,18. However, patients in our study still met the new diagnostic criteria.
Box 2. Historical and Current Criteria for Diagnosing Chronic Rhinosinusitis, Based on American Academy of Otorhinolaryngology–Head and Neck Surgery Guidelines.
| Diagnostic Criteria Used Through 2006 (17): Symptoms for >3 mo of 2 or More of the Major Criteria OR 1 Major and 2 Minor Criteria |
| Major Criteria |
| Nasal obstruction or blockage (stuffy nose) |
| Postnasal drainage |
| Facial (sinus) pressure or pain |
| Hyposmia or anosmia |
| Cough |
| Minor criteria |
| Headache |
| Fever |
| Halitosis |
| Fatigue |
| Dental pain |
| Ear pain, pressure, or fullness |
| Diagnostic Criteria Used Since 2007 (7) |
| 12 weeks of ≥2 symptoms below: |
| Mucopurulent drainage |
| Nasal obstruction |
| Facial pain, pressure, or fullness |
| Decreased sense of smell |
| AND at least 1 of the following (evidence of inflammation): |
| Purulence |
| Polyps |
| Radiographic evidence of inflammation |
Benchmarking
To compare volumetric scoring vs. Lund-Mackay scoring using CT images, a benchmark for comparison was needed. Although many studies of CRS use CT as the benchmark, the current study aimed to test CT scoring systems themselves and thus needed an alternative standard.
We selected various parameters and sought to identify those that changed significantly with a therapeutic intervention known to help patients with CRS. We used the symptom questionnaire recommended by the Scoring and Therapy Group 9 and graded symptoms using a visual analog scale (Box 3). Fiberoptic endoscopic examinations were performed, and outcomes were graded using the system recommended by the Scoring and Therapy Group 9. Scoring was modified in a backward-compatible fashion to increase the resolution of the results (Table 1). Patients also answered the QOL questionnaire (RhinoQOL or “Rhinosinusitis Quality of Life Questionnaire”) that was developed and validated for the study of patients with CRS 19,20. In the QOL survey, questions about the effect of the patient’s nasal symptoms were grouped in 3 categories: “frequency”, “bothersomeness”, and “impact”. CT scanning of the nose and paranasal sinuses was performed using a Siemens Sensation 64 (0.75 mm axial thickness at 0.4 increment and H70 bone kernel) or the Xoran MiniCat (0.4 mm axial slice thickness, contiguous). Phantom data using both scanners showed no significant difference in volume calculations using images from both scanners. The CT protocol used was the same as used for other clinical patients, so there was not any increase in radiation exposure for the protocol CTs. Figure 1 shows the individual parameters assessed during the evaluations.
Box 3. Symptoms Scored Using a Visual Analog Scalea.
| Facial pain or pressure |
| Headache |
| Nasal blockage or congestion |
| Nasal discharge |
| Olfactory disturbance |
| Overall discomfort |
Table 1.
Endoscopic Scoring System
| Column A | Column B | Column C | Column D | Column E | Column F | Column G | Column H |
|---|---|---|---|---|---|---|---|
| Parameter being graded | Endoscopic grading system | Score right | Score left | Backwards compatible endoscopic grading system used | Score | Score right | Score left |
| Polyps | Absent | 0 | 0 | Absence of polyps | 0 | 0 | 0 |
| Middle Meatus Only | 1 | 1 | Polyps barely visible | 1A | 1 | 1 | |
| polyps extend part way along height of middle turbinate | 1B | 2 | 2 | ||||
| polyps extend to inferior edge of middle turbinate | 1C | 3 | 3 | ||||
| Polyps Beyond The Middle Meatus | 2 | 2 | polyps extend to top of inferior turbinate | 2A | 4 | 4 | |
| polyps extend along the side of inferior turbinate | 2B | 5 | 5 | ||||
| polyps extend to or beyond inferior edge of inferior turbinate | 2C | 6 | 6 | ||||
| Edema | Absent | 0 | 0 | Absent | 0 | 0 | |
| Barely perceptible | 1 | 1 | |||||
| Mild | 1 | 1 | Mild | 2 | 2 | ||
| Moderate | 3 | 3 | |||||
| Severe | 2 | 2 | Severe | 4 | 4 | ||
| Discharge | None | 0 | 0 | None | 0 | 0 | |
| Slight, clear | 1 | 1 | |||||
| Clear, Thin | 1 | 1 | Clear, Thin | 2 | 2 | ||
| Thicker, gray | 3 | 3 | |||||
| Thick or Purulent | 2 | 2 | Thick or Purulent | 4 | 4 | ||
| Scarring | Absent | 0 | 0 | Absent | 0 | 0 | |
| Limited | 1 | 1 | |||||
| Mild | 1 | 1 | Mild | 2 | 2 | ||
| Moderate | 3 | 3 | |||||
| Severe | 2 | 2 | Severe | 4 | 4 | ||
| Crusting | Absent | 0 | 0 | Absent | 0 | 0 | |
| Minimal | 1 | 1 | |||||
| Mild | 1 | 1 | Mild | 2 | 2 | ||
| Moderate | 3 | 3 | |||||
| Severe | 2 | 2 | Severe | 4 | 4 |
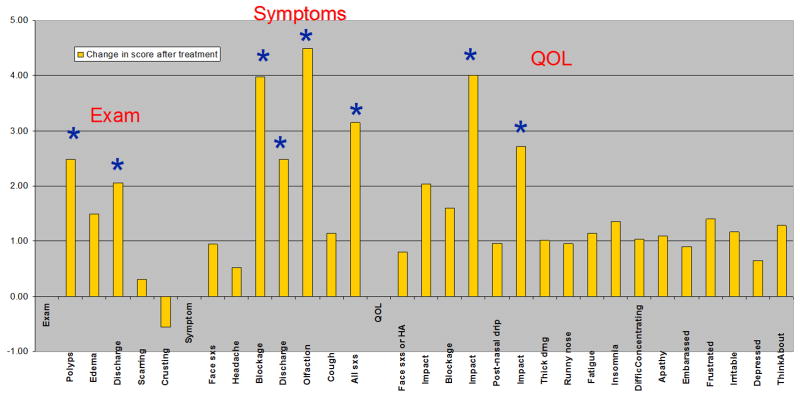
Figure 1.

Change in scores for endoscopic findings, nasal symptoms, and quality-of-life parameters, 1 month after treatment with triamcinolone acetonide.
CT Scoring
Volumetric scoring and Lund-Mackay scoring of the extent of sinus disease was determined from the CT data at baseline and 1 month after treatment. Most patients with CRS have improvements with triamcinolone treatment that can still be observed 1 month after administration.
The Lund-Mackay scoring system is outlined in Table 2. Lund-Mackay score was determined by neuroradiologists (J.J.O., J.I.L.), an otorhinolaryngologist (J.F.P.), and an allergist (J.B.H.) who were blinded to the clinical data including symptom and endoscopy scores, and QOL data. Scoring differences were reviewed, discussed, and resolved.
Table 2.
Lund-Mackay Scoring System
| Anatomic Location | Scoring Criteriaa |
|---|---|
| Maxillary sinuses | 0: No abnormality |
| 1: Partial opacification | |
| 2: Total opacification | |
| Anterior ethmoid sinuses | 0: No abnormality |
| 1: Partial opacification | |
| 2: Total opacification | |
| Posterior ethmoid sinuses | 0: No abnormality |
| 1: Partial opacification | |
| 2: Total opacification | |
| Sphenoid sinuses | 0: No abnormality |
| 1: Partial opacification | |
| 2: Total opacification | |
| Frontal sinuses | 0: No abnormality |
| 1: Partial opacification | |
| 2: Total opacification | |
| Ostiomeatal complex | 0: Not occluded |
| 2: Occluded |
Left and right sides are scored separately. Total score can range from 0–24.
Volumetric scoring was done using the software on the Siemens Wizard workstation or Mayo Clinic Analyze (Biomedical Imaging Resource, Mayo Clinic, Rochester, MN) to define the precise volume of each sinus using 0.4-mm spaced images for each patient (Figure 2). A set of heuristics was developed to allow consistent delineation (segmentation), whether patients had previous sinus surgery or not, of the anatomic boundaries of each sinus area on the CT images for each patient. A block of CT image data (multiple slices) is composed of voxels (in this study, cubes of 0.4 mm per edge). A process called segmentation defined which voxels belonged to which sinus (Figure 2). It was necessary to do most of the segmentations using manual methods, since a fully automated method did not exist for paranasal sinuses. Eight authors performed the segmentations (A.C.D., A.S., R.S., N.M.O., K.B.R, N.J., R.D., J.F.P), and cases were reviewed with the principal investigator (J.F.P.) for accuracy and consistency.
Figure 2.
Sinus images from a patient before treatment. Left, Three-dimensional view of the segmented sinus volumes. Right, The corresponding axial view through the ethmoid and sphenoid sinuses (in the plane shown by the green rectangle in the left frame).
Each voxel had a measure of attenuation (measured in Hounsfield units [HU]; for reference, water has an HU of 0). To assess the paranasal sinuses, the range −1,024 to −500 HU was used for air, and disease or mucosal thickening was designated by −499 to +250 HU. The software allowed calculation of the volume of disease and air from the segmented voxels. We defined total volume percentage of disease, the parameter reported with volumetric scoring, as the volume of mucosal thickening in all of a patient’s sinuses divided by the total volume in all sinuses (including air and mucosal thickening), multiplied by 100. The bone in the sinus walls or ethmoid partitions was not included in the disease calculations. We were comparing this method to Lund-Mackay scoring which does not include bone.
An additional feature of the Analyze software was its ability to apply segmentations from baseline images to the post-treatment images. By registering both data sets together, objects representing the baseline sinus volumes could be loaded onto the exact space of the sinuses on the post-treatment images. The volume percent of disease could then be calculated using the previously defined anatomic space of each sinus. This saved the time and labor of performing a second segmentation of all sinuses on the post-treatment scans.
Statistical Analysis
Statistical analysis was performed to compare volumetric scoring vs Lund-Mackay scoring and determine whether they showed significant differences in correlation with changes in other parameters after a beneficial medical therapeutic intervention. Analysis was done by statisticians of the Mayo Clinic Department of Biostatistics.
The differences (changes from baseline to 1 month post-treatment) were calculated for each evaluation (symptom questionnaire, endoscopic findings, QOL questionnaire, and CT score for each scoring method). The parameters studied included all individual items for each type of evaluation. Additionally, total scores for endoscopic examination, symptoms, and QOL, 3 symptom score (obstruction, discharge, olfactory) and subtotal QOL scores (sub-scores) for frequency, bothersomeness, and impact, were evaluated (Figure 1). The data distribution allowed the use of parametric statistical methods. Analyses were performed using SAS statistical software (version 9.1; SAS Institute, Inc). We determined the correlation between change in CT score (for both scoring methods) compared to change in each parameter score and the composite scores. We determined the level of significance for the correlations and compared the performance graphically (Figure 3).
Figure 3.

Correlation coefficients for relationship between individual parameters and volumetric staging (blue) or Lund-Mackay staging (red). Individual parameters included endoscopic findings, symptoms, and quality-of-life scores. The orange line (r=.29) shows the threshold for statistical significance (p<.05) for a correlation between the changes for each staging method and that parameter.
To look for a statistically significant difference between volumetric scoring and Lund-Mackay scoring we used a regression model. This evaluated the relationship between the dependent variable (the scores for symptoms, examination findings, and quality-of-life parameters) and the predictor variables (volumetric scoring and Lund-Mackay scoring). First, the regression model was fit between each parameter (change with treatment) and Lund-Mackay scoring (change with treatment) to determine the percent of the total variation in the dependent variable (the parameter) that could be explained by Lund-Mackay scoring (Table 3, column 2). We then determined whether including volumetric scoring in that regression model could explain any additional variation in the dependent variable (Table 3, column 3). We then showed whether a statistically significant improvement could be obtained with volumetric scoring over Lund-Mackay scoring for each parameter (Table 3, column 4, items highlighted in yellow).
Table 3.
shows the additional percent of variation explained by adding Volumetric scoring to Lund-MacKay scoring using the statistical approach described in the Methods and Results sections.
| Column 1 | Column 2 | Column 3 | Column 4 |
|---|---|---|---|
| Dependent variable | Percent of variation: Lund-Mackay scoring | Percent of variation: adding volumetric scoring | P-value for: Is the additional variation explained by volumetric scoring significant |
| Examination | |||
| Polyp | 16.5 | 23.8 | 0.044 |
| Discharge | 4.0 | 9.2 | 0.11 |
| Total examination score | 5.9 | 15.4 | 0.03 |
| Symptom | |||
| Nasal blockage | 0.7 | 5.0 | 0.16 |
| Olfactory | 1.7 | 20.6 | 0.002 |
| Sum of 3: blockage, discharge, olfactory | 2.9 | 16.3 | 0.01 |
| Total symptom score | 6.6 | 18.6 | 0.014 |
| Quality of life (QOL) | |||
| Frequency subscore | 12.7 | 22.7 | 0.02 |
| Bothersomeness subscore | 5.5 | 10.5 | 0.12 |
| Impact subscore | 8.4 | 9.8 | 0.4 |
Results
Forty-eight subjects with CRS completed this study. Of these, 37 patients had visible nasal polyps. 23 patients had past sinus surgery. No patients reported any clinically significant adverse effects; 2 patients reported transient irritability.
Figure 1 illustrates the mean change in the parameters (symptom scores, endoscopic exam scores, and QOL scores) measured 1 month after treatment with triamcinolone. All of the parameters used for comparison with CT scoring showed a positive change one month after treatment except for “crusting”.
Figure 3 shows correlation coefficients for the relationship between post-treatment changes in individual parameters (shown on the horizontal axis) and 1) changes in volumetric scoring (blue bars) and 2) changes in Lund-Mackay scoring (red bars). Correlation coefficients greater than 0.29 were statistically significant at p < 0.05 (orange line).
The correlations for volumetric scoring (blue bars) were higher than for Lund MacKay scoring (red bars) for all of the Figure 3 parameters except for ‘Crusting’ and ‘Facial pain or pressure’. For 5 of the parameters (‘Exam-Discharge’, ‘Symptoms-Olfactory disturbance’, ‘Symptoms-Blockage-drainage-olfactory’, ‘QOL-Freqency-Sinus headaches, facial pain’, and ‘QOL-Bothersomeness-Postnasal drip’) in Figure 3, only the volumetric scoring method yielded statistical significance (bar extending above orange line) while Lund MacKay scoring did not. Both CT scoring systems showed significant correlation for 5 additional parameters (‘Exam-Polyps’, ‘Symptoms-Cough’, ‘Symptoms-Total symptom score’, ‘QOL-Frequency-Postnasal drip’, ‘QOL-Frequency-Thick nasal drainage’) in Figure 3, and the correlation was higher in all cases for volumetric scoring:. Both CT scoring systems showed positive going correlations for all but 2 of the parameters (‘Exam-Scarring’, ‘Exam-Crusting’).
The results of the statistical analysis are shown in Table 3 with significant P values highlighted in yellow in the 4th column. The additional percentage of variation explained by adding volumetric scoring to a regression model using Lund-Mackay scoring is shown in the third column. Volumetric scoring was significantly (p < 0.05) better than Lund-Mackay scoring for multiple parameters (‘Examination-Polyps’, ‘Exam-Total examination score’, ‘Symptoms-Olfactory’, ‘Symptoms-Sum of 3: blockage, discharge, olfactory’, ‘Symptoms-Total symptom score’, and ‘QOL-Frequency sub-score’ for nasal symptoms). The ‘QOL-Impact sub-score’ for nasal symptoms (Table 3, last row, p=0.4), which assesses impact of the patient’s nasal symptoms on other non-nasal symptoms (‘Tired or fatigued’, ‘Trouble sleeping’, ‘Harder to concentrate’, Embarrassed’, Frustrated’, Irritable’, ‘Sad or depressed’, ‘Think about’) did not do as well in distinguishing performance difference between the 2 CT scoring methods.
Discussion
This study demonstrated that volumetric scoring calculated from sinus CT image data yielded a useful objective measure that correlated with improvement after medical treatment of CRS. The Lund-Mackay scoring system also showed correlation with clinical improvement after medical therapy in CRS. However, the stronger correlation of volumetric scoring with changes in endoscopic findings, symptoms, and QOL in the current study verifies that a precise measurement of the volume of mucosal disease in sinuses is an improvement over an estimate that uses the same grade (e.g., “1”) to represent a range of mucosal disease from 1% to 99% for a given sinus. Interestingly, this study demonstrates that the cumulative effect of scoring 0, 1, or 2 for ten different sinus sites still can results in a meaningful and useful score.
It was noted that a control group was not needed for a comparison of 2 CT scoring methods using the same group of CRS patients. Regarding scoring of patients without CRS, Lund-Mackay scoring of patients with and without CRS has been performed and showed an average score of 4.26 21 and 4.3 22 for patients without sinusitis, whereas the score was 9.8 for patients with CRS.
Strengths and Limitations of the Study
The conclusions in this study apply only to our group of CRS patients who were all adults, 23 of 48 with history of previous sinus surgery, and 37 of 48 with visible nasal polyps. Consequently, our prospective sequence of patients meeting the definition of CRS would be most representative of CRS “with” nasal polyps. Since this study was evaluating scoring of disease in the sinuses, disease and polyps outside the volume of the sinuses were not included in the measurements, and patients with CRS were included whether they had visible nasal polyps or not. It is unknown if the results would be the same for a group in which all patients were “without” visible nasal polyps (see “Future work” below).
Many studies have looked at the correlation (or lack thereof) between CT findings and sinus symptoms, often reporting a poor correlation between symptoms and CT findings 23–27, whereas our study found significant correlations between symptoms and CT scores. We suspect that the poor correlation in other studies may be partly attributable to more heterogeneity of study groups, less comprehensive data availability in retrospective analyses, and the variable nature of subjective parameters such as symptoms and QOL assessments, particularly when measured at a single point in time. By comparison, our study was prospective, allowing a clear definition of included subjects. Also, it looked at change with treatment between 2 points in time rather than a single assessment of parameters, some of which can be quite variable within a given study group. Change in one month after successful treatment is a less “noisy” parameter than a single random value, and thus has a better chance for showing the “signal”, revealing the existing correlations.
The significant correlations between changes in CT scoring and nasal symptoms, endoscopic findings, and QOL parameters in our study support the use of CT scoring (volumetric or Lund-Mackay) as an objective measure to evaluate changes with medical therapy, in a similar group of patients with CRS. It also supports the use of the highly correlating clinical parameters for comparison of CT scoring systems. This study does not give evidence regarding whether the results would be the same if the intervention was surgical rather than medical. That would be the subject of a different study.
We acknowledge that the correlation coefficients in this study were not extremely high, but they were comparable to those associated with clinical significance in other CRS studies 12,26,28,29. Until further refinements in phenotypic selection can be made, statistical significance is an important result, given the heterogeneity of patients in CRS studies.
We further acknowledge possible limitations in using CT for investigating the effectiveness of CRS therapy. In this study, we performed 2 CT scans to evaluate change, noting that a single CT scan provides only a static picture of a sometimes dynamically changing condition. Nevertheless, in addition to doubled cost, radiation exposure from 2 CT scans must be considered. This study was reviewed for radiation safety before institutional review board approval was obtained. All of our enrollees in this study were adults, but radiation exposure remains an area of general concern, particularly for children. MRI is a non-radiographic option. However, a CT scan is considerably easier for a patient (much faster to perform), offers greater compliance without medication, and often is less expensive than an MRI. Also, MR imaging has artifacts at air/tissue interfaces which can be impede accurate segmentation.
This study required significant manual intervention for the segmentation of the sinus volumes. Software development is expected to reduce the effort needed. As of manuscript preparation, the method for volumetric scoring has not yet been fully automated. The lack of automation currently limits wide application. Using the heuristics we employed, automated segmentation is feasible and could provide an optimized, objective assessment of CT sinus disease for potential use in CRS for research and clinical application (See Future Work below).
Future Work
Further investigations using these data could compare the relative strength of volumetric scoring in patients “with” vs. “without” visible nasal polyps or in patients with “less” vs. “more” disease, or in patients having surgical intervention rather than medical. Other CT scoring systems could also be evaluated to determine their relative strength against volumetric scoring.
Future work could also look at the impact of osteitic changes or bony thickening on correlation. This study compared volumetric scoring to a scoring method (Lund-Mackay) that assessed soft tissue in the sinuses and not bone. Therefore, bone was not included in the calculations. The ethmoid sinuses (and minimally in the other sinuses) have bony partitions that are ignored in the same way that the sinus walls are not included in the volume assessment. This methods accepts some possible minimal computational error in 2 ways; some ethmoids have more partitions than others in the demarcated space, and the “normal” mucosal thickness is included in the measured mucosal thickening that is designated as disease.
If volumetric scoring was used for assessment of change with surgery (though it is not in our study), the volume of bone in the ethmoid sinuses would decrease after ethmoid surgery. This would allow more space for mucosa or air. Theoretically this should not change the metric of interest, which is the ratio of mucosa to mucosa plus air. A different study would be needed to assess whether volumetric scoring would perform as well for non-medical interventions.
Since bone is not included, neither of the scoring methods includes assessment of osteitis. Deeb et al 17, Kim et al 30 and Cho et al 31 have found that bone thickness in the maxillary sinus was greater in CRS patients compared to normal subjects. These studies do not tell if there is any change in bone thickness in CRS patients with medical therapy, such that it should be included in scoring methods used to assess change. Bhandarkar et al 32 noted that there was no difference in baseline QOL scores between patients with and without osteitis, but that patients without osteitis were more likely to have QOL improvement with surgery. It is not possible to tell from these observations whether there would be change in osteitis corresponding to a treatment, and whether such a change, if present, would add further to the clinical correlation with change in mucosal disease shown in our study.
This study substantiates the usefulness of volumetric scoring and supports pursuit of an automated process to calculate percent of disease volume from sinus CTs. We anticipate that after further automation of the process, future studies could use this tool for optimal objective assessment of medical therapeutic interventions for a similar mix of patients with CRS.
Conclusion
To determine whether a therapeutic intervention is useful in CRS, tools with maximal capability to show significant changes are necessary. This study demonstrated that the objective tool of CT volumetric scoring of sinus disease correlated better than the Lund-Mackay scoring system with changes in symptom, examination and QOL measures for patients (37 of 48 with visible nasal polyps) treated medically for CRS. This is a further step toward finding the ultimate objective outcome tool for assessing change in CRS.
Acknowledgments
Funding
For 2nd scans for study patients: Siemens Corporation and Xoran Technologies
Funding for the statistical analyses for this project from the Mayo Clinic Otorhinolaryngology Research Committee
We thank Amy L. Weaver, Division of Biomedical Statistics and Informatics, for performing the statistical analysis. .We acknowledge E. Paul Lindell, M.D. for the clinical CT protocol and Joel G. Fletcher, M.D. for the support of the CIC at Mayo Clinic. For their clinical support we thank Carroll Poppen, P.A., Oren Friedman, M.D., and Ray Gustafson, M.D.
Abbreviations
- 3-D
three-dimensional
- CRS
chronic rhinosinusitis
- CT
computed tomographic
- MRI
magnetic resonance imaging
- QOL
quality of life
Footnotes
Possible scores ranged from 1–10 for each symptom.
Work was performed at Mayo Clinic, Rochester, Minnesota, USA.
All authors were at Mayo Clinic during the time of the study.
All other authors: no disclosures
Disclosures:
Lifeng Yu, Ph.D.: research grant from Xoran Technologies, Inc.
John Pallanch, M.D.: research grant from Xoran Technologies, Inc.
Cynthia H. McCollough, PhD: research support, Siemens Healthcare
Andrew Primak, PhD: currently employee Siemens Healthcare- No disclosures during time study was performed.
Contributor Information
Dr. John Pallanch, Email: Pallanch.john@mayo.edu.
Dr. Lifeng Yu, Email: Yu.lifeng@mayo.edu.
Dr. David Delone, Email: delone.david@mayo.edu.
Dr. Rich Robb, Email: Robb.richard@mayo.edu.
Dr. David R. Holmes, III, Email: Holmes.david3@mayo.edu.
Messr. Jon Camp, Email: Camp.jon@mayo.edu.
Messr. Phil Edwards, Email: Edwards.Phillip@mayo.edu.
Dr. Cynthia H. McCollough, Email: Mccollough.cynthia@mayo.edu.
Dr. Jens Ponikau, Email: jponikau@buffalo.edu.
Dr. Amy Dearking, Email: Dearking.amy@mayo.edu.
Dr. John Lane, Email: Lane.john@mayo.edu.
Dr. Andrew Primak, Email: andrew.primak@siemens.com.
Dr. Aaron Shinkle, Email: aaronshinkle@gmail.com.
Dr. John Hagan, Email: Hagan.john@mayo.edu.
Dr. Evangelo Frigas, Email: Frigas.evangelo@mayo.edu.
Dr. Joseph J. Ocel, Email: jjocel4@gmail.com.
Ms. Nicole Tombers, Email: Tombers.nicole@mayo.edu.
Dr. Rizwan Siwani, Email: Siwani.rizwan@mayo.edu.
Dr. Nicholas Orme, Email: Orme.nicholas@mayo.edu.
Dr. Kurtis Reed, Email: Reed.kurtis@mayo.edu.
Dr. Nivedita Jerath, Email: njerath@post.harvard.edu.
Dr. Robinder Dhillon, Email: robindhillon@yahoo.com.
Dr. Hirohito Kita, Email: Kita.hirohito@mayo.edu.
References
- 1.Blackwell D, Collins JG, Coles R. Summary health statistics for U.S. adults: National Health Interview Survey, 1997. National Center for Health Statistics. Vital Health Stat. 2000;2000:10. [PubMed] [Google Scholar]
- 2.Benson V, Marano MA. Current estimates from the National Health Interview Survey, 1995. Vital and health statistics. 1998:1–428. [PubMed] [Google Scholar]
- 3.Ray NF, Baraniuk JN, Thamer M, et al. Healthcare expenditures for sinusitis in 1996: contributions of asthma, rhinitis, and other airway disorders. The Journal of allergy and clinical immunology. 1999;103:408–414. doi: 10.1016/s0091-6749(99)70464-1. [DOI] [PubMed] [Google Scholar]
- 4.Ware JE, Jr, Sherbourne CD. The MOS 36-item short-form health survey (SF-36). I. Conceptual framework and item selection. Medical care. 1992;30:473–483. [PubMed] [Google Scholar]
- 5.Bolger WE, Butzin CA, Parsons DS. Paranasal sinus bony anatomic variations and mucosal abnormalities: CT analysis for endoscopic sinus surgery. The Laryngoscope. 1991;101:56–64. doi: 10.1288/00005537-199101000-00010. [DOI] [PubMed] [Google Scholar]
- 6.Rosenfeld RM, Andes D, Bhattacharyya N, et al. Clinical practice guideline: adult sinusitis. Otolaryngol Head Neck Surg. 2007;137:S1–31. doi: 10.1016/j.otohns.2007.06.726. [DOI] [PubMed] [Google Scholar]
- 7.Zinreich SJ. Imaging for staging of rhinosinusitis. The Annals of otology, rhinology & laryngology. 2004;193:19–23. doi: 10.1177/00034894041130s506. [DOI] [PubMed] [Google Scholar]
- 8.Lund VJ, Mackay IS. Staging in rhinosinusitus. Rhinology. 1993;31:183–184. [PubMed] [Google Scholar]
- 9.Lund VJ, Kennedy DW. Quantification for staging sinusitis. The Staging and Therapy Group. The Annals of otology, rhinology & laryngology. 1995;167:17–21. [PubMed] [Google Scholar]
- 10.Lund VJ, Kennedy DW. Staging for rhinosinusitis. Otolaryngol Head Neck Surg. 1997;117:S35–40. doi: 10.1016/S0194-59989770005-6. [DOI] [PubMed] [Google Scholar]
- 11.Bhattacharyya N. Test-retest reliability of computed tomography in the assessment of chronic rhinosinusitis. The Laryngoscope. 1999;109:1055–1058. doi: 10.1097/00005537-199907000-00008. [DOI] [PubMed] [Google Scholar]
- 12.Wabnitz DA, Nair S, Wormald PJ. Correlation between preoperative symptom scores, quality-of-life questionnaires, and staging with computed tomography in patients with chronic rhinosinusitis. American journal of rhinology. 2005;19:91–96. [PubMed] [Google Scholar]
- 13.Ponikau JU, Sherris DA, Kita H, Kern EB. Intranasal antifungal treatment in 51 patients with chronic rhinosinusitis. The Journal of allergy and clinical immunology. 2002;110:862–866. doi: 10.1067/mai.2002.130051. [DOI] [PubMed] [Google Scholar]
- 14.Ponikau JU, Sherris DA, Weaver A, Kita H. Treatment of chronic rhinosinusitis with intranasal amphotericin B: a randomized, placebo-controlled, double-blind pilot trial. The Journal of allergy and clinical immunology. 2005;115:125–131. doi: 10.1016/j.jaci.2004.09.037. [DOI] [PubMed] [Google Scholar]
- 15.Savranlar A, Uzun L, Ugur MB, Mahmutyazicioglu K, Ozer T, Gundogdu S. How does nose blowing effect the computed tomography of paranasal sinuses in chronic sinusitis? European journal of radiology. 2005;53:182–188. doi: 10.1016/j.ejrad.2004.04.003. [DOI] [PubMed] [Google Scholar]
- 16.Sanchez Fernandez JM, Anta Escuredo JA, Sanchez Del Rey A, Santaolalla Montoya F. Morphometric study of the paranasal sinuses in normal and pathological conditions. Acta Otolaryngol (Stockh) 2000;120(2):273–8. doi: 10.1080/000164800750001080. [DOI] [PubMed] [Google Scholar]
- 17.Deeb R, Malani PN, Gill B, et al. Three-dimensional volumetric measurements and analysis of the maxillary sinus. American journal of rhinology & allergy. 2011;25:152–156. doi: 10.2500/ajra.2011.25.3605. [DOI] [PubMed] [Google Scholar]
- 18.Rosenfeld RM. Clinical practice guideline on adult sinusitis. Otolaryngol Head Neck Surg. 2007;137:365–377. doi: 10.1016/j.otohns.2007.07.021. [DOI] [PubMed] [Google Scholar]
- 19.Atlas SJ, Gallagher PM, Wu YA, et al. Development and validation of a new health-related quality of life instrument for patients with sinusitis. Qual Life Res. 2005;14:1375–1386. doi: 10.1007/s11136-004-6674-7. [DOI] [PubMed] [Google Scholar]
- 20.Atlas SJ, Metson RB, Singer DE, Wu YA, Gliklich RE. Validity of a new health-related quality of life instrument for patients with chronic sinusitis. The Laryngoscope. 2005;115:846–854. doi: 10.1097/01.MLG.0000157693.92975.02. [DOI] [PubMed] [Google Scholar]
- 21.Ashraf N, Bhattacharyya N. Determination of the “incidental” Lund score for the staging of chronic rhinosinusitis. Otolaryngol Head Neck Surg. 2001;125:483–486. doi: 10.1067/mhn.2001.119324. [DOI] [PubMed] [Google Scholar]
- 22.Bhattacharyya N, Fried MP. The accuracy of computed tomography in the diagnosis of chronic rhinosinusitis. The Laryngoscope. 2003;113:125–129. doi: 10.1097/00005537-200301000-00023. [DOI] [PubMed] [Google Scholar]
- 23.Basu S, Georgalas C, Kumar BN, Desai S. Correlation between symptoms and radiological findings in patients with chronic rhinosinusitis: an evaluation study using the Sinonasal Assessment Questionnaire and Lund-Mackay grading system. Eur Arch Otorhinolaryngol. 2005;262:751–754. doi: 10.1007/s00405-004-0891-0. [DOI] [PubMed] [Google Scholar]
- 24.Bhattacharyya T, Piccirillo J, Wippold FJ., 2nd Relationship between patient-based descriptions of sinusitis and paranasal sinus computed tomographic findings. Arch Otolaryngol Head Neck Surg. 1997;123:1189–1192. doi: 10.1001/archotol.1997.01900110039006. [DOI] [PubMed] [Google Scholar]
- 25.Krouse JH. Computed tomography stage, allergy testing, and quality of life in patients with sinusitis. Otolaryngol Head Neck Surg. 2000;123:389–392. doi: 10.1067/mhn.2000.109476. [DOI] [PubMed] [Google Scholar]
- 26.Smith TL, Rhee JS, Loehrl TA, Burzynski ML, Laud PW, Nattinger AB. Objective testing and quality-of-life evaluation in surgical candidates with chronic rhinosinusitis. American journal of rhinology. 2003;17:351–356. [PubMed] [Google Scholar]
- 27.Stewart MG, Sicard MW, Piccirillo JF, Diaz-Marchan PJ. Severity staging in chronic sinusitis: are CT scan findings related to patient symptoms? American journal of rhinology. 1999;13:161–167. doi: 10.2500/105065899781389704. [DOI] [PubMed] [Google Scholar]
- 28.Bhattacharyya N. A comparison of symptom scores and radiographic staging systems in chronic rhinosinusitis. American journal of rhinology. 2005;19:175–179. [PubMed] [Google Scholar]
- 29.Quintanilla-Dieck L, Litvack JR, Mace JC, Smith TL. Comparison of disease-specific quality-of-life instruments in the assessment of chronic rhinosinusitis. Int Forum Allergy Rhinol. 2012;2:437–443. doi: 10.1002/alr.21057. [DOI] [PMC free article] [PubMed] [Google Scholar]
- 30.Kim HY, Kim MB, Dhong HJ, et al. Changes of maxillary sinus volume and bony thickness of the paranasal sinuses in longstanding pediatric chronic rhinosinusitis. International journal of pediatric otorhinolaryngology. 2008;72:103–108. doi: 10.1016/j.ijporl.2007.09.018. [DOI] [PubMed] [Google Scholar]
- 31.Cho SH, Kim TH, Kim KR, et al. Factors for maxillary sinus volume and craniofacial anatomical features in adults with chronic rhinosinusitis. Arch Otolaryngol Head Neck Surg. 2010;136:610–615. doi: 10.1001/archoto.2010.75. [DOI] [PubMed] [Google Scholar]
- 32.Bhandarkar ND, Mace JC, Smith TL. The impact of osteitis on disease severity measures and quality of life outcomes in chronic rhinosinusitis. Int Forum Allergy Rhinol. 2011;1:372–378. doi: 10.1002/alr.20068. [DOI] [PMC free article] [PubMed] [Google Scholar]