Abstract
The cerebral cortex of the human brain is highly folded. It is useful for neuroscientists and clinical researchers to identify and/or quantify cortical folding patterns across individuals. The top (gyri) and bottom (sulci) of these folds resemble the “blob-like” features used in computer vision. In this article, we evaluate different blob detectors and descriptors on brain MR images, and introduce our own, the “brain blob detector and descriptor (BBDD).” For the first time blob detectors are considered as spatial filters under the scale-space framework and their impulse responses are manipulated for detecting the structures in our interest. The BBDD detector is tailored to the scale and structure of blob-like features that coincide with cortical folds, and its descriptors performed well at discriminating these features in our evaluation.
I. Introduction
Recent evidence supports heritable aspects to cortical folding [1,2] and an association between cortical folding and mental disorders [3,4]. To better understand, diagnose, or predict treatment outcome for these conditions based on morphological differences, it is important to identify and/or quantify the type and degree of folding across conditions. Magnetic Resonance Imaging (MRI) data provide contrast between gray and white matter of the folded cortical surface, and the top (gyri) and bottom (sulci) of these folds are distinctive features of the brain. These distinctive features are quite similar to the “blob-like” features of interest to the computer vision community. We are interested here in evaluating the performance of blob-like feature detectors and descriptors to distinguish folds in human brain MRI data, in the interest of developing our own method that can be refined for brain image analysis and clinical research.
There are many blob-like detectors defined for different purposes, most of which are compared in [5,6]. However, scale normalized Laplacian (SNL) based on the Laplacian of Gaussian (LOG) [7], Salient regions based on entropy [8], shift invariant feature transform (SIFT) based on the difference of Gaussians (DOG) [9], and speeded-up robust features (SURF) based on the determinant of Hessian (DOH) [10] have attracted the most attention in the literature. There are also different descriptors introduced in the field of computer vision which are compared in [11], and some newly defined descriptors such as the rotation invariant feature transform (RIFT) [12], which plays a significant role in our newly introduced BBDD descriptor.
Please note that these methods were originally proposed for 2D images and the extension to 3D is not always straightforward. For instance, the 3D extension of the DOG filter is readily given, but the SIFT algorithm in which it is used is not easily extendable to 3D. There are a number of 3D extensions of the SIFT algorithm, however we used the recently published method [13] which is the only true 3D extension of the SIFT method. We used the 3D extension of the SURF algorithm given in [14] for our examination, and we extended SNL and Salient regions to 3D (normalization factor in SNL changes from σ2 to σ3/2. The extension of the descriptors to image volumes also poses a challenge. We have extended the RIFT descriptor to 3D images for comparison.
This paper is organized in the following format. In section 2, blob-like detectors are reviewed and a new algorithm for blob detection in brain MR images is introduced. In section 3, descriptors are reviewed and a new descriptor is introduced. The evaluation of the BBDD is given in section IV.
II. Blob-Like Detectors
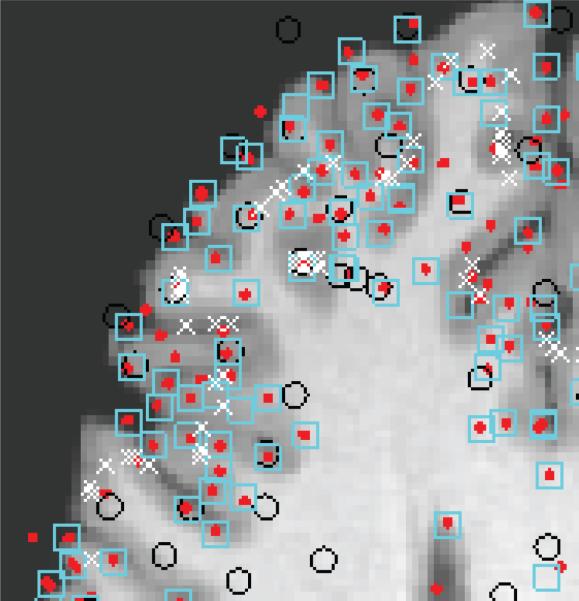
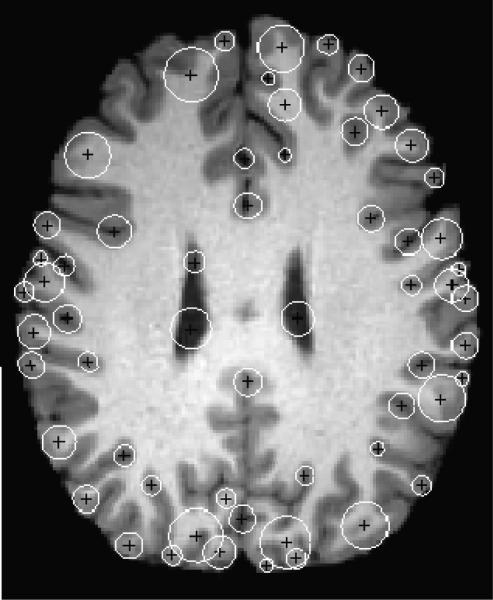
Blob detection methods are usually designed for general-purpose tasks such as object recognition, motion tracking, robot localization, etc. An attempt has also been made to use SIFT detectors for classification of brain MRI data in [15]. However, our aim here is more specialized, in that we are only interested in a limited range of sizes and shapes of blobs relevant to two types of blob-like structures: “sulcal blobs” and “gyral blobs.” These blob-like structures along the cortex of a human brain can be seen in Fig. 1 and Fig. 3. As seen in these figures, these blobs are particular in their size, location, and structure.
Fig. 1.
Axial view of a human brain image with SIFT (red dots), SURF (black circles), SNL (cyan squares), and Salient regions (while crosses) features.
Fig. 3.
Axial view of human brain image with extracted blob-like features and their scales.
For instance, a sulcal blob has a dark center surrounded by gray matter and extends into white matter, whereas a gyral blob has the reverse order (this is used later on to discriminate them). In this work we examine blob detectors (LOG, entropy, DOG, and DOH) and the well-recognized methods that use these detectors (SNL, Salient regions, SIFT, and SURF) for extracting blob-like features in human brain MR images.
Fig. 1 shows features that we extracted using SIFT (red dots), SURF (black circles), SNL (cyan squares), and Salient regions (white cross) in 2D (which produces more features for visual evaluation in a given slice than its 3D counterpart). The parameters of these algorithms are set to the suggested values by the original papers [7,8,9,10]. It is obvious that these results are not satisfactory, which is due to the fact that these algorithms were originally designed for other tasks. Their objective was focused on robustness (repeatability) under affine transformations without regard for the structures around these features. In our application, we are interested in extracting features that are not only robust, but are associated directly with sulcal and gyral blobs. To tailor our detector accordingly, we analyzed the structure of the blob detector's impulse response function. From a signal processing point of view, these detectors are simply band-pass filters. Since blobs are local features, their impulse response can simply be analyzed in the spatial domain.
A. Blob Detector Impulse Response
SNL blob detectors are based on normalized LOG filters, which are simply the summation of the second derivative of the Gaussian filters with variance of σ along all axes. Equation (1) gives its impulse response function in 3D. This function is convolved with a 3D image and the local maxima (not only in spatial domain but also in scale-space) indicate the existence of blob-like structures,
| (1) |
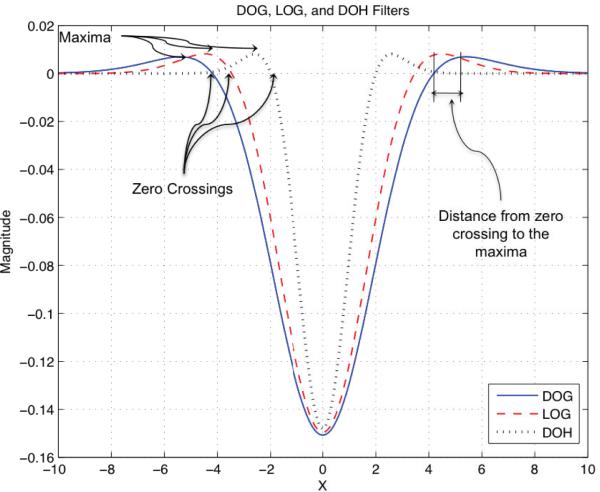
where x=(x,y,z)t is the coordinate in the 3D Cartesian system and |x| is the norm of the vector x. Fig. 2 shows a cross-section of a LOG filter for σ =2. SIFT blob detectors are based on the DOG filter, which is simply the difference of two Gaussian filters with different variances σ and kσ:
| (2) |
where k is the factor used for the adjustment of the filter, and x and |x| are the same as in equation (1). Fig. 2 also shows a cross-section of a DOG filter for σ =2 and k=1.5. The SURF algorithm uses the DOH as its blob detector, which is the determinant of the Hessian matrix at the given scale, σ:
| (3) |
where Lab(x,σ) is the second derivative of the Gaussian with respect to a and b axes, and x is the same as in equation (1). Fig. 2 also shows the cross-section of the DOH filter with σ =2. Finally, Salient regions detectors are based on an entropy measure,
| (4) |
where p(i) is the probability of the intensity i taking place in a spherical volume of radius σ and centered at x. This probability is computed by the normalized histogram of the Gaussian smoothed image. Since histograms are non-linear functions, obtaining their impulse response is quite challenging, if not impossible. Moreover, entropy is a measure of randomness in a dataset that is very sensitive to noise and is generally not focused on any particular structure. Fig. 1 clearly indicates such behavior. Therefore we do not consider entropy detector any further.
Fig. 2.
A cross-section of the scaled version of LOG, DOG, and DOH impulse responses for σ =2 and k =1.5.
Table 1 summarizes the zero crossings and the locations of the maxima for the LOG, DOG, and DOH impulse responses. These locations are crucial in designing our specialized filters in the next subsection. As can be seen in Table 1 and Fig. 2, all three detectors have almost the same type of impulse response. However, the DOH response is not symmetric around the x=0 axis (not visible in Fig. 2 since it only shows a cross-section of the response), which reduces the rotation invariance of the DOH filter. Gaussians are optimal for scale-space analysis [7], but in practice they have to be discretized and cropped. This leads to an error in their implementation. Blob detectors should be invariant to the luminance level of an image, so the area/volume under the LOG, DOG, and DOH impulse response curves should be zero. Discretizing and cropping of these filters alters this property, making them sensitive to the luminance level of the image. The advantage of the DOG is that its Gaussians can be normalized to one after discretizing and cropping, and their difference can be set to zero. Such an advantage does not hold for the LOG or DOH filters. That is why we select DOG filters in our method. In addition, DOG has smoother end tails which makes it more attractive, as described in the next section.
Table 1.
Zero crossings and the location of maxima for LOG, DOG, and DOH filters .
| Zero Crossing | Maxima | Center Lobe | Side Lobe | |
|---|---|---|---|---|
| LOG | σ | |||
| DOG | σ γ | |||
| DOH | ± σ | ±1.3 σ | 2σ | 0.6σ |
B. Gyral and Sulcal Blob Detector
As mentioned in the introduction, the purpose of this research is to detect gyral and sulcal blobs. It is crucial that we extract a minimum number of false blobs, so we adjust the center lobe of our filters to the average radius of the sulcal blobs (3.32 ± 2.18 mm) and average radius of gyral blobs (6.21 ± 3.18 mm). The side lobes of the filter's impulse response should be set to the average thickness of gray matter (2.74 ± 0.34 mm, derived from 248 normal and healthy MRI brain data). Our investigation of the impulse response of the detectors indicates that the width of the central lobe is a factor of the width of the side lobe. Therefore only one degree of freedom exists in designing our filters. For instance, side lobes should be set to the average thickness of gray matter (2.74 ± 0.34 mm). In this case, the central lobe has to have a width of 9.49 ± 1.18 mm, whereas the average width of the sulcal blobs and gyral blobs are about 6 mm and 12 mm, respectively. Fortunately, the tails of the DOG impulse response smoothly converge toward zero which ensures that the variability in gray matter width has a negligible impact on our detectors. Thus designing the filters is done purely based on fitting the central lobe width to the average radius of the sulcal blobs (3.32 ± 2.18 mm, ranging from 2.14 to 6.50 mm), requiring 6 DOG filters (σ = {1.14, 2.14, 3.14, 4.14, 5.14, 6.14}) for the detection of sulcal blobs, and fitting to the average radius of gyral blobs (6.21 ± 3.18 mm, ranging from 3.032 to 9.39 mm) requiring 3 filters (σ = {7.39, 8.39, 9.39}) for detection of gyral blobs. The remaining gyral blobs are in the range of sulcal blob detectors; with the differences that they respond negatively to gyral blobs. All the filters here are designed for images with isometric voxels (1mm) but are easily scalable to other voxel sizes. In either case, these designs are robust to a small deviation in the size of the voxels due to the scale-space framework of the algorithm [7,8,9,10].
Detected blobs with weak responses are either due to noise or minimal similarity to blob-like structures. In addition, MR images are highly variable in their contrast, noise level, and intensity inhomogeneity. Under such conditions, it is impossible to set a fixed threshold to discard the weak blobs (as is done in SIFT, SURF, and SNL). In BBDD the features are selected by their response magnitudes, such that the original detected blobs are sorted by their magnitudes and a certain number of them with highest response values are selected. This process is performed for sulcal and gyral blobs separately, since the sulcal blob responses are often stronger than the gyral blobs. This makes BBDD able to extract an exact number sulcal blobs and gyral blobs (not necessarily the same number) for every brain.
Detected features outside the brain are discarded by measuring the normalized average energy of the image intensity in the circular area around the features. The radius of the area is equal to the scale in which the feature is detected. Also, if the locations of the detected features are close (within a distance equal to their scales), the feature with smaller response magnitude is discarded.
Fig. 3 shows the result of the new BBDD detector applied to brain MR images with 1mm isometric voxels in 2D (which produces more features for visual evaluation in a given slice than its 3D counterpart). As can be seen, only sulcal and gyral blobs are extracted. The white circles around each point indicate the scale in which these features were detected.
III. Descriptors
After detecting the sulcal and gyral blobs, they should be assigned descriptors which distinguish them from each other within and across individuals. A comparison of ten descriptors was done in [11]. The two top-performing descriptors were the gradient location and orientation histogram (GLOH) [11] and SIFT [9]. The SIFT descriptor is represented by a 3D histogram of gradient locations and orientations. GLOH is an extension of the SIFT descriptor designed to increase its robustness and distinctiveness. There are two new descriptors (SURF and RIFT) which are not included in [11]. The SURF descriptor is based on Haar wavelets, which is computed for subregions of a 20x20 window on each feature point, oriented with the original feature orientation. The general issue with these descriptors is the reference direction upon which all other directions are computed. Even a small deviation in this reference has a significant effect on the result. This disadvantage is address by the RIFT descriptor which computes the gradient directions with respect to the directions pointing outward at each location. The RIFT descriptor places four concentric rings of equal width around the feature point. For each ring a histogram of the gradient directions is built with eight bins, resulting in a vector of 32 components for each feature.
We were not able to locate any extension of the RIFT descriptor to 3D, so we have computed 3D RIFT descriptors simply by placing four concentric spheres with equal step radius about each feature point. We compute the gradient direction as the angle between the 3D gradient vector and another vector starting from the center of the sphere and ending at the feature point. This resolves the issue of directional reference mentioned above.
MR images are noisy and of low contrast, and the regions around each type of blob (sulcal or gyral) are very similar to each other, thus the existing descriptors do not perform well even with a small amount of noise added. In the BBDD descriptor, we reduce the size of the RIFT descriptor to an 8-component vector by PCA. We add five new components (three for location, one for scale and one for the magnitude of the impulse response), resulting in a 13-component vector descriptor. Please note that coordinates of the features may change significantly between different scans. In our BBDD descriptor we transferred the coordinates to principal component coordinates. This ensures that the deviations between corresponding coordinates are minimal.
IV. Evaluation
Table 2 shows the average number of extracted blob-like features by BBDD, SIFT, SURF, and SNL. Total number of sulcal/gyral blobs and the correctly detected sulcal blobs and gyral blobs are manually counted (in 2D for three center slices of axial, coronal, and sagittal planes of 36 participants) and the incorrect detections are reported as false positive and undetected blobs as false negative in Table 2. As can be seen, the error percentage of the BBDD is significantly lower than existing methods.
Table 2.
Comparison of the BBDE, SIFT, SURF and SNL blob detectors
| Total Blob-like | Total Detection | False Positive | False Negative | |
|---|---|---|---|---|
| BBDE | 231 | 228 | 37-16% | 40-17% |
| SIFT | 231 | 633 | 589-93% | 187-80% |
| SURF | 231 | 252 | 214-84% | 193-83% |
| SNL | 231 | 492 | 454-92% | 193-83% |
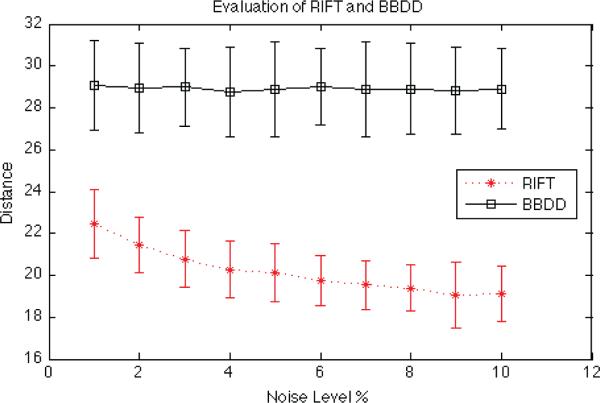
As reported in [13], SIFT descriptors are very sensitive to image noise. Since brain MR images are considered noisy and of low resolution, it is easily inferred that their performance will not be satisfactory. Since the GLOH descriptors are obtained in the same way as the SIFT descriptors, they should have similar performance. SURF descriptors are simple and they seem to be more robust to noise as reported in [10], however they still suffer from the reference direction issue mentioned in the previous section. In our evaluation, we compared the performance of the RIFT descriptor and our BBDD descriptor for gyral and sulcal blobs. Our measure of discriminability was the average Euclidean distance between all pairs of the descriptors in the image. Descriptor with higher average distance tolerates higher level of image degradation. We have computed this measure for 36 human brains. We repeated this process for different levels of added noise (1% to 10%) and report the average and standard deviation in Fig. 4. As can be seen in Fig. 4, the average distance between the RIFT descriptors decreases with noise, but is stable for our BBDD descriptor.
Fig. 4.
Evaluation of the RIFT and BBDD descriptors for human brain MR images.
V. Conclusion
In this study, we examined the performance of traditional blob-like feature extraction and matching methods applied to brain MR images. We added a new constraint of the feature structure to make sure that only sulcal blobs and gyral blobs are extracted. We achieved this by redesigning the impulse response of the blob detectors and adjusting their center lobe to the radii of sulci and gyri in the cerebral cortex. The improvement is clearly shown in Fig. 3 and Table 2. We have also introduced a new descriptor based on RIFT descriptors to maximize the distinctiveness of the features. This descriptor also discriminates sulcal blobs from gyral blobs and it is more stable to noise as is shown in Fig. 4.
Acknowledgments
This work was supported in part by the U.S. National Institute of Health under Grant NIH/NIA RO1 AG26158.
References
- 1.Dubois J, Benders M, Cachia A, Lazeyras F, Ha-Vinh Leuchter R, Sizonenko SV, Borradori-Tolsa C, Mangin JF, Hüppi PS. Cerebral Cortex. 6. Vol. 18. New York: 2008. Mapping the early cortical folding process in the preterm newborn brain; pp. 1444–1454. [DOI] [PubMed] [Google Scholar]
- 2.Rogers J, Kochunov P, Zilles K, Shelledy W, Lancaster J, Thompson P, Duggirala R, Blangero J, Fox PT, Glahn DC. On the genetic architecture of cortical folding and brain volume in primates. NeuroImage. 2010;53(3):1103–1108. doi: 10.1016/j.neuroimage.2010.02.020. [DOI] [PMC free article] [PubMed] [Google Scholar]
- 3.Sheen LV, Walsh C. Developmental genetic malformations of the cerebral cortex. Current neurology and neuroscience reports. 2003;3(5):433–441. doi: 10.1007/s11910-003-0027-8. [DOI] [PubMed] [Google Scholar]
- 4.Guerrini R, Dobyns WB, Barkovich J. Abnormal development of the human cerebral cortex: genetics, functional consequences and treatment options. Trends in neurosciences. 2008;31(3):154–162. doi: 10.1016/j.tins.2007.12.004. [DOI] [PubMed] [Google Scholar]
- 5.Mikolajczyk K, Schmid C. Scale & affine invariant interest point detectors. International Journal on Computer Vision. 2004;60:63–86. [Google Scholar]
- 6.Bauer J, Sunderhauf N, Protzel P. Comparing several implementations of two recently published feature detectors.. Proc. of the International Conference on Intelligent and Autonomous Systems; IAV, Toulouse, France. 2007. [Google Scholar]
- 7.Lindeberg T. Feature detection with automatic scale selection. International Journal of Computer Vision. 1998;30(2):77–116. [Google Scholar]
- 8.Kadir T, Brady M. Saliency, scale and image description. International Journal on Computer Vision. 2001;45(2):83–105. [Google Scholar]
- 9.Lowe DG. Distinctive Image Features from Scale-Invariant Keypoints. International Journal of Computer Vision. 2004;60(2):91–110. [Google Scholar]
- 10.Bay H, Ess A, Tuytelaars T, Vangool L. Speeded-Up Robust Features (SURF) Computer Vision and Image Understanding. 2008;110(3):346–359. [Google Scholar]
- 11.Mikolajczyk K, Schmid C. Performance evaluation of local descriptors. IEEE transactions on pattern analysis and machine intelligence. 2005;27(10):1615–1630. doi: 10.1109/TPAMI.2005.188. [DOI] [PubMed] [Google Scholar]
- 12.Lazebnik S, Schmid C, Ponce J. A sparse texture representation using local affine regions. IEEE Transactions on Pattern Analysis and Machine Intelligence. 2005;27(8):1265–1278. doi: 10.1109/TPAMI.2005.151. [DOI] [PubMed] [Google Scholar]
- 13.Flitton G, Breckon T, Bouallagu NM. Object Recognition using 3D SIFT in Complex CT Volumes. Proceedings of the British Machine Vision Conference. 2010:11.1–11.12. [Google Scholar]
- 14.Knopp J, Prasad M, Willems G, Timofte R, Van Gool L. Hough Transform and 3D SURF for robust three dimensional classification. Proceedings of the European Conference on Computer Vision. 2010 [Google Scholar]
- 15.Toews M, Wells III WM, Collins D, Louis D, Arbel T. Feature-Based Morphometry: Discovering Group-related Anatomical Patterns. NeuroImage. 2010;49(3):2318–2327. doi: 10.1016/j.neuroimage.2009.10.032. [DOI] [PMC free article] [PubMed] [Google Scholar]


