Abstract
Purpose: In this pilot study, the authors examined associations between image-based phenotypes and genomic biomarkers. The potential genetic contribution of UGT2B genes to interindividual variation in breast density and mammographic parenchymal patterns is demonstrated by performing an association study between image-based phenotypes and genomic biomarkers [single-nucleotide polymorphism (SNP) genotypes].
Methods: This candidate-gene approach study included 179 subjects for whom both mammograms and blood DNA samples had been obtained. The full-field digital mammograms were acquired using a GE Senographe 2000D FFDM system (12-bit; 0.1 mm-pixel size). Regions-of-interest, 256 × 256 pixels in size, selected from the central breast region behind the nipple underwent computerized image analysis to yield image-based phenotypes of mammographic density and parenchymal texture patterns. SNP genotyping was performed using a Sequenom MassArray System. One hundred twenty three SNPs with minor allele frequency above 5% were genotyped for the UGT2B gene clusters, and used in the study. The association between the image-based phenotypes and genomic biomarkers was assessed with the Pearson correlation coefficient via the PLINK software, and included permutation and correction for multiple SNP comparisons.
Results: From the phenotype-genotype association analysis, a parenchyma texture coarseness feature was found to be correlated with SNP rs451632 after multiple test correction for the multiple SNPs (p = 0.022). The power law β, which is used to characterize the frequency component of texture patterns, was found to be correlated with SNP rs4148298 (p = 0.035).
Conclusions: The authors’ results indicate that UGT2B gene variation may contribute to interindividual variation in mammographic parenchymal patterns and breast density. Understanding the relationship between image-based phenotypes and genomic biomarkers may help understand the biologic mechanism for image-based biomarkers and yield a future role in personalized medicine.
Keywords: image-based phenotypes, genomic biomarkers, association study, mammographic parenchymal patterns, quantitative image analysis, CAD
INTRODUCTION
Breast cancer is the most commonly diagnosed cancer among women in the United States, with approximately 232 340 new cases of invasive breast cancer and 64 640 new cases of in situ breast cancer expected to occur among women during 2013.1 An estimated 39 520 breast cancer deaths were expected in 2013.1 Currently, mammography is still the best available imaging modality for breast cancer detection, and it can detect breast cancer at an early stage.2, 3
Several studies have used either qualitative (Breast Imaging Reporting and Data System, BI-RADS) or quantitative estimates of breast density or percentage, the fibroglandular area relative to the whole breast area, to assess its association with breast cancer risk. Their results showed that women with dense breasts have an increased risk of developing breast cancer relative to women with fatty breasts.4, 5, 6, 7
In addition to mammographic breast density, the relationship between mammographic parenchymal patterns and the risk of developing breast cancer has been studied8, 9, 10, 11, 12, 13, 14, 15 extensively. Since the human visual system has difficulty assessing higher-order statistics texture information,16 computerized texture analysis becomes an important and useful tool to extract unique and clinically meaningful information from mammographic images. Our previous studies17, 18 from computerized texture analyses of mammographic parenchymal patterns showed that women at high risk of developing breast cancer tend to have dense breasts with coarse and low-contrast texture patterns.
The UDP-glucuronosyltransferases (UGTs) are coded by a gene superfamily and catalyze the glucuronidation of numerous endogenous and exogenous compounds, including bilirubin, bile acids, steroid hormones, and many carcinogens. The glucuronidation reaction transfers the glucuronosyl group to substrate molecules that contain oxygen, nitrogen, sulfur, or carboxyl functional groups, making the substrates more polar and water soluble. These water-soluble products are readily eliminated from the body through the biliary and renal systems.19, 20, 21 There are two families within the UGT superfamily, UGT1 and UGT2, and the UGT2 subfamily includes UGT2A and UGT2B gene clusters. There are seven active members – UGT2B4, UGT2B7, UGT2B10, UGT2B11, UGT2B15, UGT2B17, UGT2B28 in the UGT2B gene clusters located on chromosome 4, which are mainly expressed in liver, breast, prostate, colon, and kidney.22, 23
Numerous studies24, 25, 26, 27 have shown that exposure to increased concentrations of estrogens, androgens, and progesterone may contribute to the development of breast cancer and other hormone-dependent cancers. Since UGT2B enzymes play an important role in the metabolism of steroid hormones, it has been proposed that variations in the UGT2B enzymes may contribute to the development of breast cancer.24 Moreover, considering the fact that steroid hormone levels are correlated with mammographic density,28 it has been suggested that genetic variation in UGT2B family can influence mammographic density by altering enzyme activity or gene expression and, as a consequence, steroid hormone levels.29, 30, 31, 32 Therefore, an analysis of the association between UGT2B genetic variation and mammographic parenchymal patterns and breast density may provide useful insights into the mechanisms of breast cancer susceptibility.
However, little work has yet been done to characterize how genetic risk factors may interact with image-based phenotypes. Thus, we examine a potential genetic contribution of UGT2B gene variants to interindividual variation in breast density and mammographic parenchymal patterns by performing an association study between image-based phenotypes and genomic biomarkers (i.e., genotypes).
MATERIALS AND METHODS
Database
Patients included 179 women, including 103 breast cancer patients and 76 women without breast cancer, which were retrospectively recruited to this study under an institution review board (IRB) approved protocol from the University of Chicago Medical Center. Of the 179 subjects, there were 140 Caucasian women, 30 African-American women, 5 Asian women, 3 Hispanic women, and one woman of unknown ethnicity. Both full-field digital mammograms (FFDM) and blood DNA samples were available for the study.
Genotyping
Single-nucleotide polymorphisms (SNPs) are the most common type of genetic variation in the human genome. Each SNP represents a single DNA sequence variation where a nucleotide differs between chromosomes in one or across different individuals.
Fifty-six unrelated haplotype map (HapMap) samples were resequenced at the UGT2B gene cluster to discover sequence variation. By using ldSelect with r2 ≥ 0.8 and minor allele frequency (MAF) ≥ 0.05 as selection criteria, 314 SNPs were identified as tagging SNPs. ldSelect is a software package that uses information on the extent of association (measured by r2) between alleles at linked SNPs to identify the minimal set of maximally informative SNPs, i.e., tagging SNPs, which can capture a large fraction of the total variation in a given genomic region.33, 34 The tagging SNPs in the UGT2B gene cluster were genotyped in all 179 subjects by iPLEX SNP genotyping assay (Sequenom Inc., San Diego, CA) and described in detail in Ref. 35.
The genotype data were preprocessed by quality control on genotypes. Three filtering criteria were applied to the SNP genotype data in this study. The call-rate threshold of 95% was used to include a SNP for the analysis, since a low call-rate suggests that the SNP assay is of low quality. An exact Hardy-Weinberg equilibrium (HWE) p-value threshold of 0.001 was used to filter out those SNPs that deviated from HWE, probably reflecting genotyping errors. SNPs with MAF less than 5% were excluded from the study.36
After applying these three filtering criteria, 123 maximally informative SNPs were included in the subsequent association study as genomic biomarkers, i.e., genotypes.
Computerized texture feature extraction
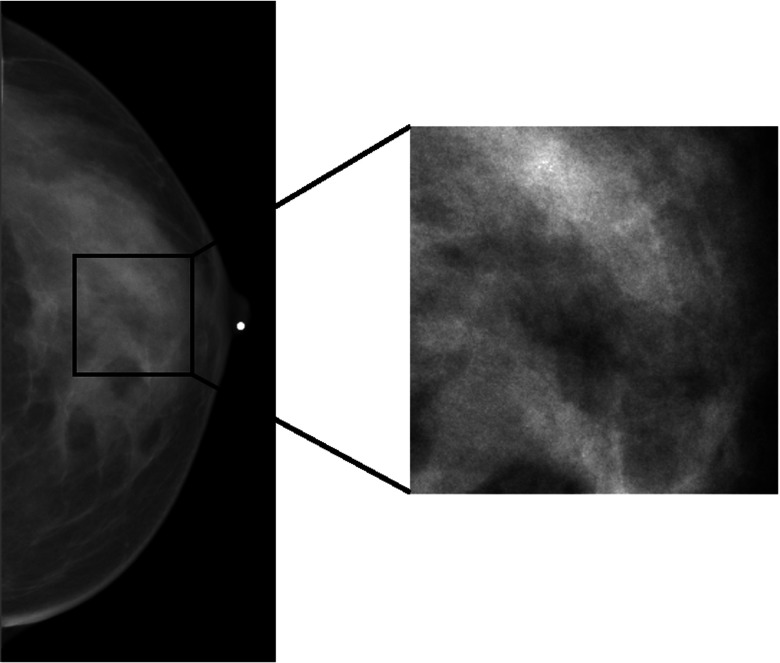
All FFDM images were acquired with a GE Senographe 2000D FFDM system with 0.1 mm pixel in size and 12-bit quantization level at the University of Chicago Medical Center. Craniocaudal (CC) view mammographic images were used in the study. Regions-of-interest (ROIs), 256 × 256 pixels in size, were manually selected from the central breast region immediately behind the nipple. A sample ROI is shown in Fig. 1.
Figure 1.
A sample ROI of size 256 × 256 pixels selected from the central breast region behind the nipple in a digital mammogram.
The ROI extraction and subsequent computerized feature extraction to assess the mammographic parenchymal patterns in the images are described in detail in Refs. 18, 37, 38, 39, 40 and briefly summarized here. Extracted were a total of 45 computerized features describing texture characteristics of (i) contrast/magnitude related to denseness and (ii) texture related to parenchymal patterns. These features were calculated based on (a) absolute value of gray levels and gray-level histogram analysis to provide denseness of the region and local tissue composition information, (b) spatial relationship among gray levels to provide contrast and homogeneity measures within texture patterns, (c) fractal analysis, including fractal dimensions from both box-counting method and Minkowski method to provide self similarity measure of the image, (d) edge-frequency analysis, including MaxEdgeGradient to provide the coarseness measure in the image, and (e) Fourier analysis, including power law β to characterize the spatial frequency content within texture patterns. These computer-extracted features served as image-based phenotypes in the association study.
Statistical analysis
The computer-extracted features (image-based phenotypes) are continuous variables and before correlation assessment each feature was normalized by a quantile normalization method so that they would have similar magnitudes.41 The genomic biomarkers (i.e., SNPs) are categorical ordered variables (i.e., genotypes) defined by the number of copies of the allele out of the two at a given SNP (i.e., 0, 1, or 2) with the lower frequency in our sample [i.e., the MAF allele]. We used the number of copies of the minor allele in the analysis, based on an additive genetic model. For example, the three genotypes of a particular SNP (AA, AT, and TT) can be assigned a value of 0, 1, and 2, respectively, indicating the number of T allele.
Association between the image-based phenotypes and genomic biomarkers was assessed using a Pearson correlation analysis. The top two performing phenotypes in terms of high correlation coefficient with genotypes were analyzed using PLINK42 association analysis [PLINK: whole genome association analysis toolset (http://pngu.mgh.harvard.edu/purcell/plink/)] to correct for multiple testing issues due to the multiple genomics biomarkers.
The PLINK outputs included an adjusted p-value after permutation of 100 000 times for correction for multiple SNP testing.43, 44, 45, 46 An association was deemed statistically significant if the adjusted p-value was less than 0.05.
The number of permutation of 100 000 was used to obtain more accurately estimated p-values (so the minimum p-value can be 0.00001). In terms of permutation procedure, the genomic biomarkers (genotype data) are retained, but the image-based phenotypes are randomly permuted to generate a new dataset. This permutation procedure satisfies the null hypothesis of no association between phenotype and genotype, and controls for the pattern of linkage disequilibrium (LD) between SNPs in the data. Only the phenotype-genotype concordance is destroyed by permutation. A fixed seed is used for the permutations to ensure the results are reproducible.
The association analyses were performed both for the entire dataset and within ethnic groups.
RESULTS
Association study for entire dataset
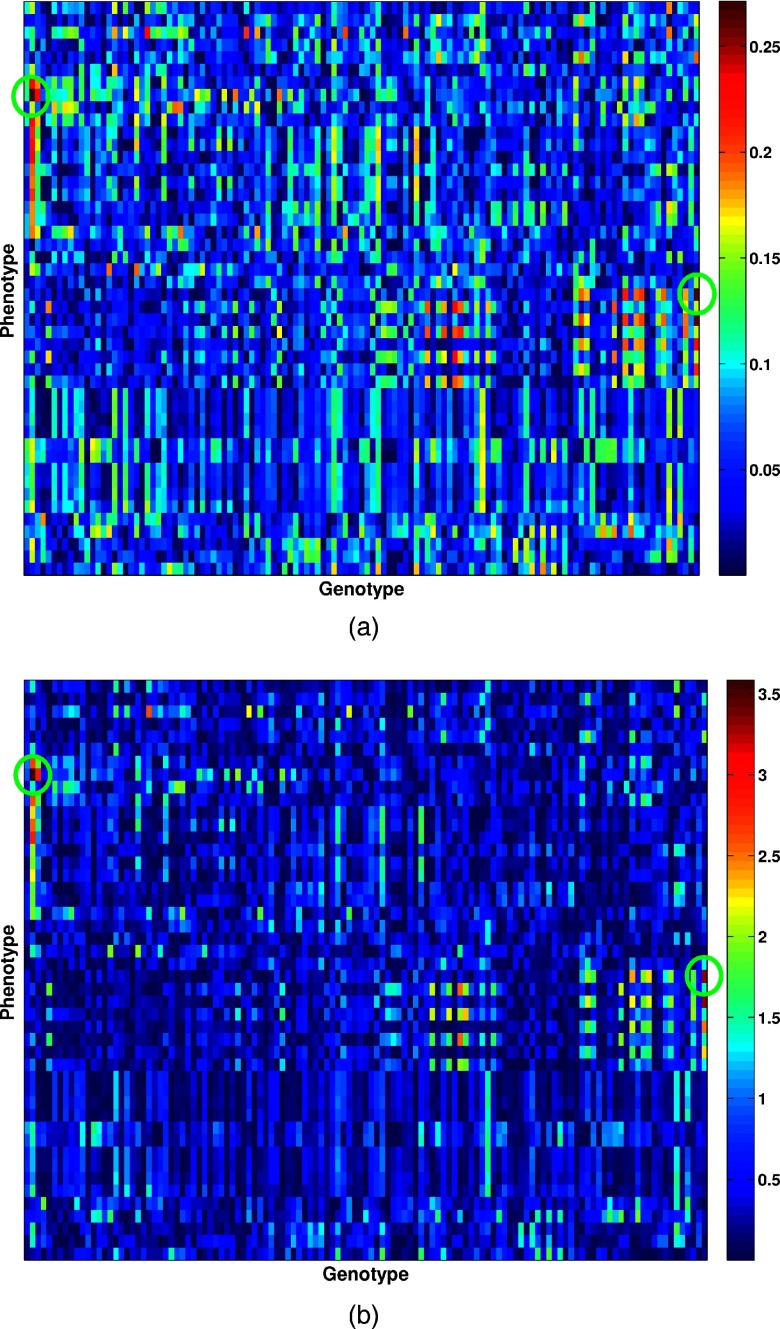
The Pearson correlation coefficient map and corresponding −log(p) map between the quantile-normalized image-based phenotypes and genomic biomarkers are shown in Fig. 2. The correlation coefficients ranged between 1.0784 × 10⁻⁵ and 0.2713.
Figure 2.
Visualization of the association between the mammographic image-based phenotypes and the SNP genotypes: (a) The Pearson correlation coefficient map; and (b) corresponding −log10(p) map. The green circles indicate the two phenotypes with the highest correlation coefficients.
The results from association analysis between image-based phenotypes and genomic biomarkers are listed in Table 1, where the adjusted p-values are also listed by permutation method including correction for multiple comparisons among the SNPs. Note that Pearson correlation only assesses the additive effects for the particular locus on the image-based phenotypes.
Table 1.
Association analysis results for the two image-based biomarkers (phenotypes) and the genomic biomarkers (genotypes) from Pearson correlation analysis (both unadjusted and corrected p-values are listed). *Corrected p-values from permutation for correction for multiple testing. *SNP positions are based on the human reference sequence (NCBI Build 36.1).
| Quantile-normalized Image-based biomarkers (Phenotypes) |
||||||
|---|---|---|---|---|---|---|
| Image characteristic | Mathematical descriptors | Genomic biomarkers (SNPs) (SNP position in Chr4*) | p-value | p-value after correction* | Relative position | Correlation with expression |
| Texture | MaxEdgeGradient | 69630002 | 0.00026 | 0.022 | 86.3kb upstream of | UGT2B17 |
| (Ref. 18) | (rs451632) | UGT2B10, 59.0kb | in liver | |||
| downstream of UGT2B15 | ||||||
| Texture | β (Power law) | 70499290 | 0.00044 | 0.035 | 103.1kb | UGT2B7 |
| and | (Ref. 31) | (rs4148298) | downstream | in liver | ||
| density | of UGT2B4 | |||||
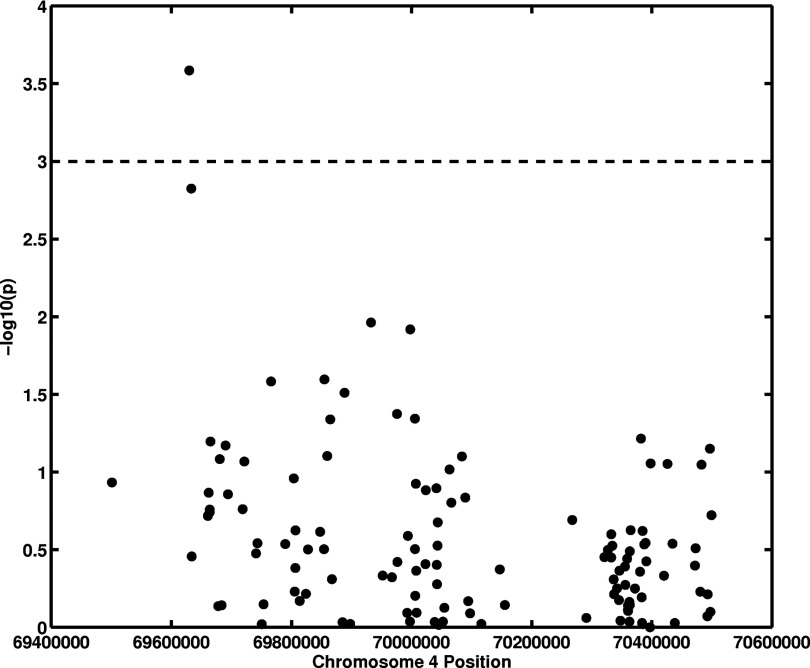
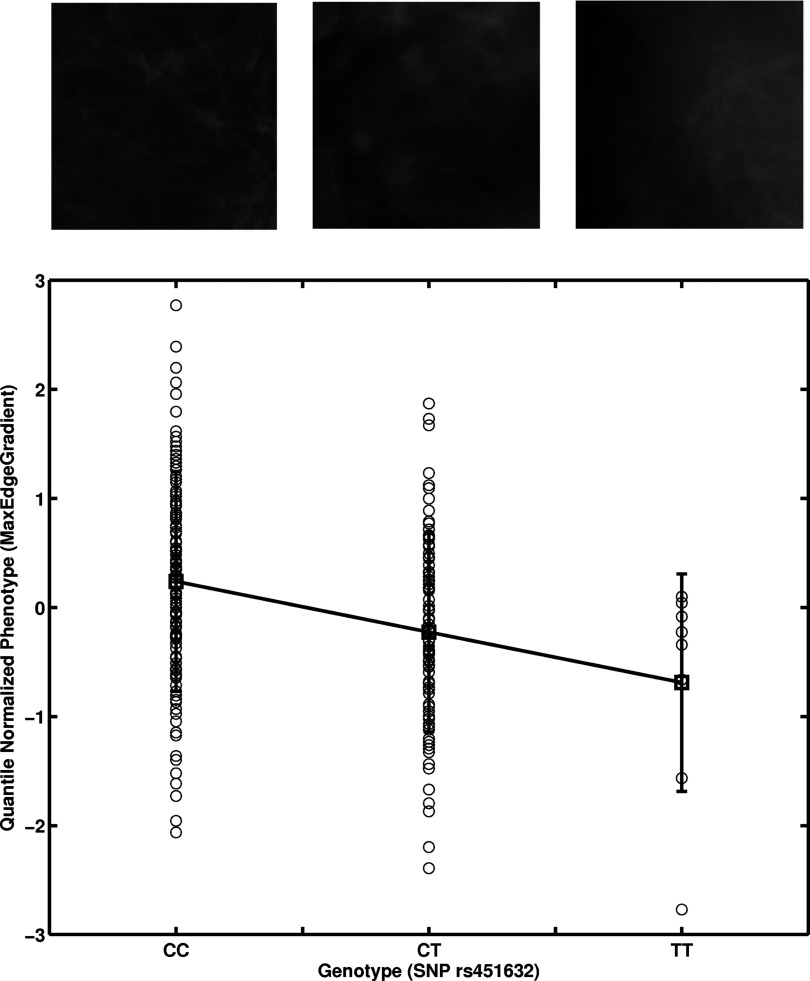
The parenchyma texture coarseness feature (MaxEdgeGradient)18 was found to be correlated (p = 0.022) with the SNP at nucleotide position 69630002 (rs451632) in chromosome 4, which is approximately 59 kb upstream to the UGT2B15 gene (Table 1; Figs. 34). The MaxEdgeGradient feature characterizes the maximum edge gradient change within the mammographic texture pattern. A smaller MaxEdgeGradient feature value corresponds to a coarser mammographic texture pattern.
Figure 3.
Association analysis between an image-based phenotype (MaxEdgeGradient) and UGT2B SNPs (genotype). The x-axis gives SNP positions at chromosome 4, and the y-axis is the −log10(p) from an additive model association analysis.
Figure 4.
Linear regression of the image-based phenotype MaxEdgeGradient on a genotype SNP position at 69630002 (rs451632) in chromosome 4 resulting in an adjusted p-value of 0.022. (See Table 1.) Selected image examples from each genotype are shown.
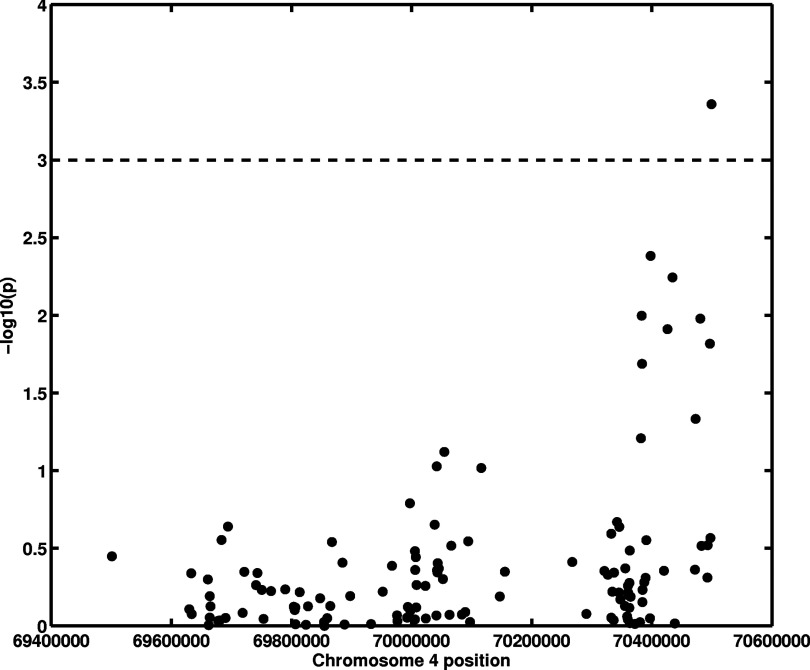
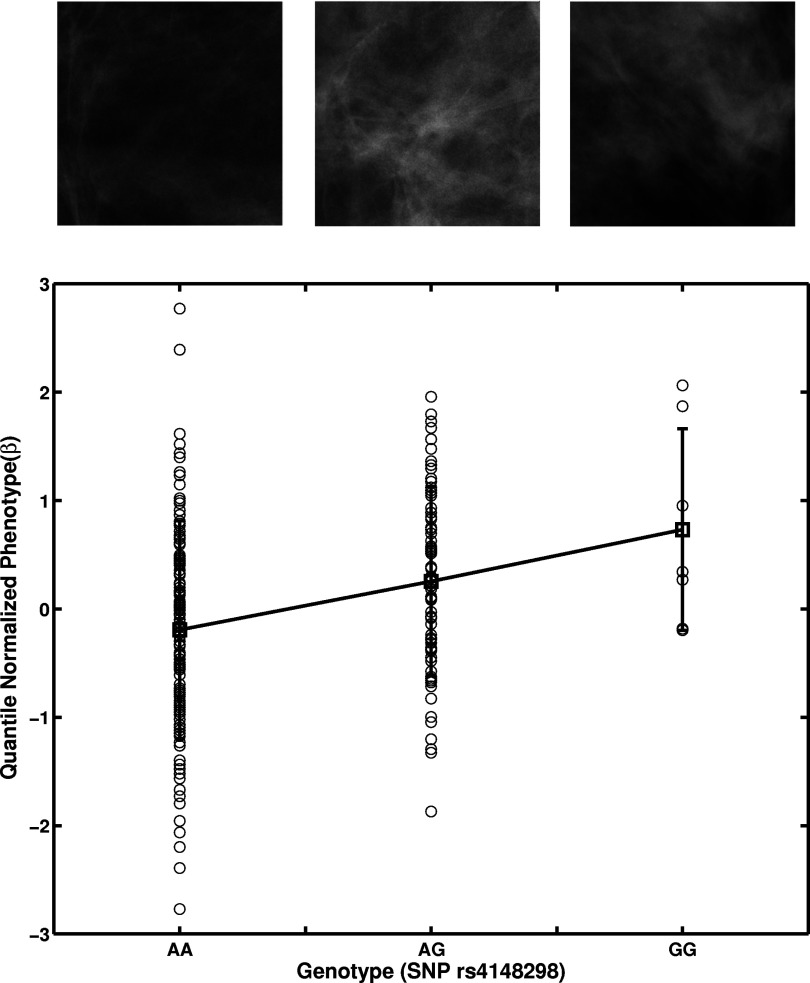
The SNP at nucleotide position 70499290 (rs4148298) (genotype) in chromosome 4 showed an additive effect on the power law β texture measure (power spectral analysis)39 with a p-value of 0.035 after multiple test correction (Table 1; Figs. 56). The power law β is used to characterize the spatial frequency content within texture patterns. A larger power law β value corresponds to a more homogeneous mammographic texture pattern.
Figure 5.
Association analysis between an image-based phenotype (power law β) and UGT2B SNPs (genotype). The x-axis gives SNP positions at chromosome 4, and the y-axis is the −log10(p) from an additive model association analysis.
Figure 6.
Linear regression of the image-based phenotype power law β on a genotype SNP position at 70499290 (rs4148298) in chromosome 4 resulting in an adjusted p-value of 0.035. (See Table 1.) Selected image examples from each genotype are shown.
Association study within ethnic groups
As a secondary aim, the two phenotype-genotype pairs discussed above were further analyzed within ethnic groups. Because of the limited size of the Asian and Hispanic ethnic groups, the additional association analyses were performed only within the Caucasian group and within the African-American group. These phenotype-genotype association results are presented in Table 2. Association between the texture measure (power law β from power spectral analysis) and the SNP at nucleotide position 70499290 (rs4148298) (genotype) in chromosome 4 was found (p = 0.030) within the Caucasian group (as it was within the entire group), although not within the other ethnic groups.
Table 2.
Association analysis results between the two image-based biomarkers (phenotypes) and the genomic biomarkers (genotypes) from Table 1 presented here within each ethic group. *SNP positions are based on the human reference sequence (NCBI Build 36.1).
| Quantile-normalized | Genomic biomarkers | All ethnic groups (179 subjects) |
Caucasian and African-American groups (170 subjects) |
Caucasian group (140 subjects) |
African-American group (30 subjects) |
||||
|---|---|---|---|---|---|---|---|---|---|
| Image-based biomarkers (Phenotypes) | (SNPs) (SNP position in Chr4*) | p-value | p-value after correction* | p-value | p-value after correction* | p-value | p-value after correction* | p-value | p-value after correction* |
| MaxEdgeGradient (Ref. 18) | 69630002 (rs451632) | 0.00026 | 0.022 | 0.00016 | 0.015 | 0.0023 | 0.14 | 0.038 | 0.98 |
| β (power law) (Ref. 31) | 70499290 (rs4148298) | 0.00044 | 0.035 | 0.0017 | 0.124 | 0.00037 | 0.030 | 0.81 | 1 |
DISCUSSION
In this pilot study, we demonstrated methodology to evaluate the association between image-based phenotypes and genomic biomarkers from UGT2B gene clusters using an additive model. The identified association between phenotypes and genotypes suggests that some UGT2B SNPs may be related to imaging characteristics, including mammographic parenchymal patterns and breast density. Understanding the relationship between image-based phenotypes and genomic biomarkers may allow image-based phenotypes to play a role in personalized medicine.
Our effort identified multiple SNPs that may correlate with mammographic pattern. Though previous studies reported associations between mammographic density and SNPs in the UGT2Bgenes,31 no previous study has identified a significant association between mammographic parenchyma texture and the candidate gene variants. Since all the UGT2B SNPs associated with imaging phenotypes are located far from genes, we hypothesize that they affect mammographic density and parenchymal texture pattern by influencing the function of sequence elements that regulate the expression of UGT2B genes. To investigate this possibility, we searched public databases (SCAN database: http://scan.bsd.uchicago.edu/newinterface/index.html and the eQTL database: http://eqtl.uchicago.edu/cgi-bin/gbrowse/eqtl/) of gene expression quantitative trait loci for the SNPs associated with mammographic features, or the ones in linkage disequilibrium with them.35 Two SNPs, rs451632 and rs4148298, were found to be correlated with UGT2B17 and UGT2B7 expression levels in liver, respectively (see Table 1). Interestingly, these two enzymes are the ones with the highest activity on steroid hormones within this family.47 The A allele of rs4148298, which was associated with higher UGT2B7 expression in liver,35 was correlated with smaller power law β value, and thus lower mammographic density (Fig. 3). These results are particularly interesting in light of a previous genome-wide expression profiling study which showed a correlation between UGT2B gene expression levels and mammographic density; consistent with our findings, this study found that higher expression of UGT2B genes is inversely correlated with breast density.32 No SNPs were associated with the expression of UGT2B or other genes in breast or other tissues. These results taken together raise the possibility that the genetic variations in the UGT2B family affect mammographic density by altering systemic hormone levels rather than the levels in the target organ, e.g., the breast. To explore this possibility further, we further searched for potential transcription factor binding sites near the significant SNPs associated with mammographic features, or the ones in LD with them, by using the program Match in the TRANSFAC database (http://www.gene-regulation.com/cgi-bin/pub/programs/match/bin/match.cgi); consistent with our proposal, we identified multiple SNPs located in predicted binding sites for liver-enriched transcription factors.35
Although the datasets were too limited to analyze based on ethnicity, the association between the power law β texture phenotype and the SNP at nucleotide position 70499290 (rs4148298) (genotype) in chromosome 4 was found to be correlated within the entire group as well as within the Caucasian group, suggesting a potential role of ethnicity in modulating the image-based phenotypes, which remains to be verified in future studies with larger datasets. Since allele frequency usually varies by race, the association difference that we observed in this preliminary study may be caused by the allele frequency difference from the Caucasian group to the African-American group. Further investigations on a larger dataset in the future are warranted.
In an additional analysis, we identified texture features based on their ability to distinguish between the cancers and controls in the dataset, thus, making the choice of phenotype completely independent of the PLINK analysis. A power law β texture feature was chosen along with a magnitude feature in feature selection for the cancer/control classification task, and the linear discriminant analysis combination of these two features, which was input to PLINK, yielded a correlation with SNP with a p-value of 0.00097 [p-value after correction of 0.074 after multiple test correction]. This secondary analysis further supports the observed association of texture phenotype and genotype.
There are some limitations in this study, including a relatively small dataset for the limited set of genotypes and multiple image-based phenotypes. In the future, the image-based phenotypes and genomic biomarkers (genotypes), along with gene expression phenotypes, will be studied with a larger patient dataset from different risk and ethnic groups. Also, use of both linear and nonlinear data dimension reduction methods on the phenotype data will be explored.48
By performing association studies among image-based phenotypes, gene expression phenotypes, and SNP genotypes, we hope to be able to better assess breast cancer risk for specific populations. Since little research has been done to demonstrate the relationship between image-based phenotypes and genomic biomarkers, we believe that the results from this pilot study will inspire other researchers to pursue further investigations associating image-based phenotypes with genomic information.
ACKNOWLEDGMENTS
Authors are grateful for the many helpful scientific discussions with Matthew Stephens, Ph.D., Heejung Shim, PhD., and Charles E. Metz, Ph.D. This work was supported in parts by USPHS Grant Nos. R01-CA89452, R33-CA113800, and P50-CA125183, DOE Grant No. DE-FG02-08ER6478, NIH S10 RR021039, and P30 CA14599. M. L. Giger is a stockholder in R2 Technology/Hologic, is the cofounder of Quantitative Insights, and receives royalties from Hologic, GE Medical Systems, MEDIAN Technologies, Riverain Medical, Mitsubishi, and Toshiba. It is the University of Chicago Conflict of Interest Policy that investigators disclose publicly actual or potential significant financial interest with would reasonably appear to be directly and significantly affected by the research activities.
References
- Siegel R., Naishadham D., and Jemal A., “Cancer statistics, 2013,” CA Cancer J. Clin. 63, 11–30 (2013). 10.3322/caac.21166 [DOI] [PubMed] [Google Scholar]
- Chlebowski R. T., “Breast cancer risk reduction: Strategies for women at increased risk,” Annu. Rev. Med. 53, 519–540 (2002). 10.1146/annurev.med.53.082901.103925 [DOI] [PubMed] [Google Scholar]
- Boyd N. F. et al. , “Mammographic densities and breast cancer risk,” Breast Disease 10, 113–126 (1998). [DOI] [PubMed] [Google Scholar]
- Saftlas A. F. et al. , “Mammographic densities and risk of breast cancer,” Cancer 67, 2833–2838 (1991). [DOI] [PubMed] [Google Scholar]
- Byrne C. et al. , “Mammographic features and breast cancer risk: Effects with time, age, and menopause status,” J. Natl. Cancer Inst. 87, 1622–1629 (1995). 10.1093/jnci/87.21.1622 [DOI] [PubMed] [Google Scholar]
- Boyd N. F., Byng J., and Jong R., “Quantitative classification of mammographic densities and breast cancer risk: Results from the Canadian National Breast Screening Study,” J. Natl. Cancer Inst. 87, 670–675 (1995). 10.1093/jnci/87.9.670 [DOI] [PubMed] [Google Scholar]
- Ghosh K. et al. , “Independent association of lobular involution and mammographic breast density with breast cancer risk,” J. Natl. Cancer Inst. 102, 1716–23 (2010). 10.1093/jnci/djq414 [DOI] [PMC free article] [PubMed] [Google Scholar]
- Wolfe J. N., “Breast patterns as an index of risk for developing breast cancer,” AJR Am. J. Roentgenol. 126, 1130–1139 (1976). 10.2214/ajr.126.6.1130 [DOI] [PubMed] [Google Scholar]
- Boyd N. F. et al. , “Mammographic patterns and bias in breast cancer detection,” Radiology 143, 671–674 (1982). [DOI] [PubMed] [Google Scholar]
- Boyd N. F. et al. , “Mammographic patterns and breast cancer risk: Methodological standards and contradictory results,” J. Natl. Cancer Inst. 72, 1253–1259 (1984). [PubMed] [Google Scholar]
- Brisson J. et al. , “Diet, mammographic features of breast tissue, and breast cancer risk,” Am. J. Epidemiol. 130, 14–24 (1989). [DOI] [PubMed] [Google Scholar]
- Atkinson C. et al. , “Mammographic patterns as a predictive biomarker of breast cancer risk: effect of tamoxifen,” Cancer Epidemiol. Biomarkers Prev. 8, 863–866 (1999). [PubMed] [Google Scholar]
- Ciatto S. and Zappa M., “A prospective study of the value of mammographic patterns as indicators of breast cancer risk in a screening experience,” Eur. J. Radiol. 17, 122–125 (1993). 10.1016/0720-048X(93)90048-R [DOI] [PubMed] [Google Scholar]
- Jakes R. W. et al. , “Mammographic parenchymal patterns and risk of breast cancer at and after a prevalence screen in Singaporean women,” Int. J. Epidemiol. 29, 11–19 (2000). 10.1093/ije/29.1.11 [DOI] [PubMed] [Google Scholar]
- Tahoces P. G. et al. , “Computer-assisted diagnosis: The classification of mammographic breast parenchymal patterns,” Phys. Med. Biol. 40, 103–117 (1995). 10.1088/0031-9155/40/1/010 [DOI] [PubMed] [Google Scholar]
- Julesz B. et al. , “Inability of humans to discriminate between visual features that agree in second-order statistics-re-visited,” Perception C 22, 678–689 (1973). [DOI] [PubMed] [Google Scholar]
- Huo Z. et al. , “Computerized analysis of digitized mammograms of BRCA1 and BRCA2 gene mutation carriers,” Radiology 225, 519–526 (2002). 10.1148/radiol.2252010845 [DOI] [PubMed] [Google Scholar]
- Li H. et al. , “Computerized texture analysis of mammographic parenchymal patterns of digitized mammograms,” Acad. Radiol. 12, 863–873 (2005). 10.1016/j.acra.2005.03.069 [DOI] [PubMed] [Google Scholar]
- Guillemette C., “Pharmacogenomics of human UDP-glucuronosyl-transferase enzymes,” Pharmacogenom. J. 3, 136–158 (2003). 10.1038/sj.tpj.6500171 [DOI] [PubMed] [Google Scholar]
- King C. D., Rios G. R., Green M. D., and Tephly T. R., “UDP-glucuronosyltransferase,” Curr. Drug Metab. 1, 143–161 (2000). 10.2174/1389200003339171 [DOI] [PubMed] [Google Scholar]
- Mackenzie P. I. et al. , “Nomenclature update for the mammalian UDP glycosyltransferase (UGT) gene superfamily,” Pharmacogen. Genom. 15, 677–685 (2005). 10.1097/01.fpc.0000173483.13689.56 [DOI] [PubMed] [Google Scholar]
- Nakamura A. et al. , “Expression of UGT1A and UGT2B mRNA in human normal tissues and various cell lines,” Drug Metab. Dispos. 36, 1461–1464 (2008). 10.1124/dmd.108.021428 [DOI] [PubMed] [Google Scholar]
- Ohno S. and Nakajin S., “Determination of mRNA expression of human UDP-glucuronosyltransferases and application for localization in various human tissues by real-time reverse transcriptase-polymerase chain reaction,” Drug Metab. Dispos. 37, 32–40 (2009). 10.1124/dmd.108.023598 [DOI] [PubMed] [Google Scholar]
- Sparks R. et al. , “UDP-glucurosyltransferase and sulfotransferase polymorphisms, sex hormone concentrations, and tumor receptor status in breast cancer patients,” Breast Cancer Res. 6, R488–R498 (2004). 10.1186/bcr818 [DOI] [PMC free article] [PubMed] [Google Scholar]
- Key T. J., “Serum oestradiol and breast cancer risk,” Endocr.-Relat. Cancer 6, 175–180 (1999). 10.1677/erc.0.0060175 [DOI] [PubMed] [Google Scholar]
- Lillie E. O., Bernstein L., and Ursin G., “The role of androgens and polymorphisms in the androgen receptor in the epidemiology of breast cancer,” Breast Cancer Res. 5, 164–173 (2003). 10.1186/bcr593 [DOI] [PMC free article] [PubMed] [Google Scholar]
- de Moura Ramos E. H. et al. , “Association between estrogen receptor gene polymorphisms and breast density in postmenopausal women,” Climacteric 31, 1–12 (2009). 10.1080/13697130902952585 [DOI] [PubMed] [Google Scholar]
- Greendale G. A. et al. , “The association of endogenous sex steroids and sex steroid binding proteins with mammographic density: Results from the postmenopausal Estrogen/progestin interventions mammographic density study,” Am. J. Epidemiol. 162, 826–834 (2005). 10.1093/aje/kwi286 [DOI] [PubMed] [Google Scholar]
- Haiman C. A. et al. , “Polymorphisms in steroid hormone pathway genes and mammographic density,” Breast Cancer Res. Treat. 77, 27–36 (2003). 10.1023/A:1021112121782 [DOI] [PubMed] [Google Scholar]
- Wells P. G. et al. , “Glucuronidation and the UDP-glucuronosyltransferases in health and disease,” Drug Metab. Dispos. 32, 281–290 (2004). 10.1124/dmd.32.3.281 [DOI] [PubMed] [Google Scholar]
- Yong M. et al. , “Associations between polymorphisms in glucuronidation and sulfation enzymes and mammographic breast density in premenopausal women in the United States,” Cancer Epidemiol. Biomark. Prev. 19, 537–546 (2010). 10.1158/1055-9965.EPI-09-0898 [DOI] [PMC free article] [PubMed] [Google Scholar]
- Haakensen V. D. et al. , “Expression levels of uridine 5′-diphospho-glucuronosyltransferase genes in breast tissue from healthy women are associated with mammographic density,” Breast Cancer Res. 12, 1–11 (2010). 10.1186/bcr2632 [DOI] [PMC free article] [PubMed] [Google Scholar]
- Carlson C. S. et al. , “Selecting a maximally informative set of single-nucleotide polymorphisms for association analyses using linkage disequilibrium,” Am. J. Hum. Genet. 74, 106–120 (2004). 10.1086/381000 [DOI] [PMC free article] [PubMed] [Google Scholar]
- ldSelect documentation, http://droog.gs.washington.edu/ldSelect.html
- Sun C. et al. , “SNP discovery, expression, and cis-regulation variation in the UGT2B genes,” Pharmacogenom. J. 12, 287–296 (2012). 10.1038/tpj.2011.2 [DOI] [PMC free article] [PubMed] [Google Scholar]
- Franke L. and Jansen R. C., “eQTL analysis in humans,” Methods Mol. Biol. 573, 311–328 (2009). 10.1007/978-1-60761-247-6_17 [DOI] [PubMed] [Google Scholar]
- Li H. et al. , “Computerized analysis of mammographic parenchymal patterns for assessing breast cancer risk: Effect of ROI size and location,” Med. Phys. 31, 549–555 (2004). 10.1118/1.1644514 [DOI] [PubMed] [Google Scholar]
- Li H. et al. , “Fractal analysis of mammographic parenchymal patterns in breast cancer risk assessment,” Acad. Radiol. 14, 513–521 (2007). 10.1016/j.acra.2007.02.003 [DOI] [PubMed] [Google Scholar]
- Li H. et al. , “Power spectral analysis of mammographic parenchymal patterns for breast cancer risk assessment,” J. Digit. Imaging 21, 145–152 (2008). 10.1007/s10278-007-9093-9 [DOI] [PMC free article] [PubMed] [Google Scholar]
- Chen W., Giger M. L., Li H., Bick U., and Newstead G. M., “Volumetric texture analysis of breast lesions on contrast-enhanced magnetic resonance images,” Magn. Reson. Med. 58, 562–571 (2007). 10.1002/mrm.21347 [DOI] [PubMed] [Google Scholar]
- Bolstad B. M., Irizarry R. A., Anstrand M., and Speed T. P., “A comparison of normalization methods for high density oligonucleotide array data based on variance and bias,” Bioinformatics 19, 185–193 (2003). 10.1093/bioinformatics/19.2.185 [DOI] [PubMed] [Google Scholar]
- Purcell S. et al. , “PLINK: A tool set for whole-genome association and population-based linkage analyses,” Am. J. Hum. Genet. 81, 559–575 (2007). 10.1086/519795 [DOI] [PMC free article] [PubMed] [Google Scholar]
- Balding D. J., “A tutorial on statistical methods for population association studies,” Nat. Rev. Genet. 7, 781–791 (2006). 10.1038/nrg1916 [DOI] [PubMed] [Google Scholar]
- Hirschhorn J. N. and Daly M. J., “Genome-wide association studies for common diseases and complex traits,” Nat. Rev. Genet. 6, 95–108 (2005). 10.1038/nrg1521 [DOI] [PubMed] [Google Scholar]
- Cantor R. M., Lange K., and Sinsheimer J. S., “Prioritizing GWAS results: A review of statistical methods and recommendations for their application,” Am. J. Hum. Genet. 86, 6–22 (2010). 10.1016/j.ajhg.2009.11.017 [DOI] [PMC free article] [PubMed] [Google Scholar]
- Singer J. B., “Candidate gene association analysis,” Methods Mol. Biol. 573, 223–230 (2009). 10.1007/978-1-60761-247-6_13 [DOI] [PubMed] [Google Scholar]
- Turgeon D. et al. , “Relative enzymatic activity, protein stability, and tissue distribution of human steroid-metabolizing UGT2B subfamily members,” Endocrinology 142, 778–787 (2001). 10.1210/endo.142.2.7958 [DOI] [PubMed] [Google Scholar]
- Jamieson A. R., Giger M. L., Drukker K., Li H., Yuan Y., and Bhooshan N., “Exploring nonlinear feature space dimension reduction and data representation in breast CADx with Laplacian eigenmaps and t-SNE,” Med. Phys. 37, 339–351 (2010). 10.1118/1.3267037 [DOI] [PMC free article] [PubMed] [Google Scholar]


