

Abstract
Changes in cerebral blood volume (CBV) and blood magnetization each induce changes in the transverse relaxation rate of MRI signal that are associated with changes in cerebral activity. BOLD signal, the preeminent method for non-invasive localization of task-induced brain function in human subjects, reflects of combination of changes in CBV and blood magnetization. Intravenous injection of paramagnetic contrast media, usually iron oxide particles surrounded by larger macromolecules, can overwhelm the BOLD response and sensitize signal to blood plasma volume, a method we have deemed “IRON” fMRI. The practical advantage of this technique is the ability to optimize blood magnetization at any echo time, enabling high detection power and the use of short echo times; for these reasons, IRON fMRI has become a valuable imaging tool in animals models. The temporal response of blood plasma volume is quite different from blood flow and BOLD signal; thus, CBV has been identified as a prominent source of transient features of the BOLD response. This article reviews the methodological advantages of the IRON method and how CBV measurements have informed our understanding of the BOLD response.
Keywords: fMRI, CBV, IRON, contrast agent, BOLD, undershoot
1. Introduction
Exogenous paramagnetic agents long have been used to enhance MRI signals associated with physiological function in the brain and other organs. The first fMRI study of human task-induced cerebral activation reported changes in magnetic susceptibility due to injection of a gadolinium chelate (Belliveau et al., 1991). Using serial injections to measure cerebral blood volume (CBV) at rest and during photoic stimulation in each subject, that study demonstrated a significant task-induced increase of CBV in primary visual cortex.
Although early gadolinium-based studies lacked the high temporal resolution associated with modern fMRI, many investigators recognized “the possibility of performing continuous serial imaging of cortical function with subsecond temporal resolution using intravascular contrast agents at equilibrium within the vascular space” (Belliveau et al., 1991). The key to enabling dynamic measurement of CBV was the development of paramagnetic contrast agents that resided in the blood stream for hours, rather than minutes. In fact, suitable agents for animal studies were developed even prior to the demonstration of BOLD or flow-weighted fMRI (Josephson et al., 1990, Weissleder et al., 1990). The excitement generated by BOLD fMRI (Bandettini et al., 1992, Kwong et al., 1992, Ogawa et al., 1992) provided an impetus for the development of complementary methods to shed light on the physiology underlying the BOLD response.
Although CBV measurements inform many aspects of normal and pathological physiology, within the domain of “brain mapping” there are two essential reasons to employ CBV measurements based upon exogenous contrast agent: 1) blood volume influences BOLD signal, and there are few good alternative methods for dynamically assessing CBV, and 2) exogenous agents enable manipulation of blood magnetization independently of magnetic field strength and echo time, which in turn enables high detection power and other advantageous experimental conditions.
The remainder of this article focuses upon the characteristics that make this technique so useful for fMRI in animal models, the contributions of this methodology to our understanding of BOLD signal, remaining questions about the role of CBV in BOLD signal, and future prospects for fMRI using exogenous agent. Results summarize findings specific to fMRI employing iron oxide, whereas complementary methods are addressed in the Discussion.
2. Background and Results
2.1 Signal mechanisms
Injection of paramagnetic contrast media increases the transverse relaxation rate of MR signal by increasing the local content of agent proportional to the blood concentration and the local blood plasma volume. Following injection of a bolus of gadolinium, relative measurements of steady-state CBV can be obtained by integrating the temporal response of the transverse relaxation rate as the bolus traverses the brain vasculature (Rosen et al., 1989); this analysis remains the clinical standard for obtaining maps of relative CBV by “perfusion weighted imaging” (Zaharchuk, 2007). Conversely, if the concentration of agent in the blood changes very slowly in time, then normalized changes in the agent-induced relaxation rate report fractional changes in CBV with the same temporal resolution as BOLD signal. To differentiate this method based upon exogenous agent from other MRI techniques that are sensitive to aspects of CBV, we now employ the acronym “IRON” fMRI to denote “increased relaxation for optimized neuro-imaging” (Chen et al., 2001).
Intravascular paramagnetic contrast media produce the signal changes underlying both BOLD and IRON signals. However, IRON signal is simpler to understand from both a physical and physiological viewpoint. Whereas the BOLD effect includes signal contributions from water inside and outside vessels, exogenous agents severely shorten the transverse relaxation rate of blood water, so signal origins are extravascular (Villringer et al., 1988). This unique feature of MRI physics – paramagnetic intravascular agents affect extravascular water, rather than just the small water volume fraction associated with CBV – is ultimately the basis for the high detection power of IRON fMRI or high-field BOLD signal. Although clinical doses of gadolinium are not quite uniformly sensitive to all vessels sizes (Boxerman et al., 1995), higher blood magnetizations associated with IRON fMRI have a gradient-echo sensitivity profile that is independent of vessel size (Mandeville et al., 2007a), thereby providing accurate measurements of total CBV consistent with the static dephasing approximation (Yablonskiy and Haacke, 1994) as long as the agent-induced relaxation rate far exceeds the induced BOLD relaxation rate due a functional task. This last criteria is easily satisfied in animal models, but large doses of agent should be employed at high magnetic field strengths when the accuracy of functional CBV changes is paramount to the study (Mandeville et al., 2004, Lu et al., 2007).
From a physiological viewpoint, exogenous agents enable measurements of blood plasma volume, whereas BOLD signal has contributions from changes in blood oxygenation in addition to capillary and venous CBV. Additionally, resting state BOLD relaxation rates, which act as amplification factors for relative changes in hemodynamic and metabolic responses, are difficult to measure accurately and routinely. Conversely, the baseline IRON relaxation rate is determined directly from signal attenuation during injection. Thus, IRON signals can be converted to percentage changes in CBV, whereas it is difficult generally to separate functional reactivity from basal physiology using BOLD signal.
2.2. Early studies at MGH
The first dynamic CBV measurements investigated global ischemia (Hamberg et al., 1996). Subsequently, we initiated efforts to develop and characterize CBV-sensitive imaging for mapping neuronal activity in animal models after failure to obtain satisfactory results using BOLD signal. At the magnetic field strengths (2 and 4.7 Tesla) available in our laboratory at the Massachusetts General Hospital in the mid and late 1990s, BOLD signal revealed little more than draining veins and superficial cortex after intravenous infusion of relatively large doses of psycho-stimulants (e.g., (Mandeville et al., 2001)). In order to determine whether we could perform fMRI more efficaciously using contrast agent, we employed respiratory challenges, focal neuronal activation, and pharmacological infusions to evaluate the utility of CBV-based fMRI relative to BOLD signal. Prior to these studies, it was unclear whether this method could improve fMRI detection power relative to BOLD signal for two reasons: 1) when using methods sensitive to the transverse relaxation rate, paramagnetic contrast agents degrade the signal to noise ratio (SNR), so detection power will suffer unless functional signal changes due to CBV are large enough to overcome the SNR penalty, and 2) it was difficult to quantitatively relate BOLD signal to underlying changes in physiology prior to the development of “calibrated fMRI” (Davis et al., 1997, Mandeville et al., 1997), which provided insight into the resting state BOLD relaxation rate that defines the maximum achievable BOLD signal.
Although we suspected that exogenous agent might significantly improve detection power, we did not foresee that the temporal response of CBV might diverge from that of CBF, a result that has been widely reproduced using this method but one that remains poorly understood. This piece of fundamentally new physiological information – the slower temporal response of CBV in relation to CBF – has been very informative for our understanding of BOLD dynamics. Furthermore, iron oxides have proven invaluable for fMRI applications in animal models.
2.3 Contrast to noise ratio
From a methodological viewpoint, the main distinguishing characteristic of IRON fMRI is the high detection power afforded by this technique. Although the CNR principles in this discussion follow from straightforward MRI physics, some of the consequences may seen non-intuitive: 1) paramagnetic agent lowers MRI signal yet significantly improves fMRI detection power; 2) contrast agent sensitizes signal to changes in CBV yet reduces the dependence of signal changes on basal CBV; 3) spin-echo techniques underestimate changes in microvascular CBV and cannot achieve signal changes as large as gradient-echo methods; 4) the relative CNR of the BOLD and IRON methods is a function of stimulus duration.
The contrast to noise ratio (CNR) for fMRI is the product of SNR and percent signal changes; injection of agent decreases the former and increases the latter, so how much contrast agent should be injected for effective IRON fMRI? For experimenters, there are two adjustable knobs: the echo time and blood magnetization. At any echo time, the optimal agent dose will drop signal by a factor of e. Shorter echo times improve CNR in proportion to the pre-agent SNR, but the penalty for decreasing the echo time is an increase in the optimal dose of contrast agent. Figure 1a depicts CNR as a function of echo time and agent-induced relaxation rate in the absence of BOLD contamination, which depends upon field strength. One-dimensional projections of CNR parallel to axes describe dose optimization at fixed echo time or echo optimization at fixed dose. For pharmacological studies in rodents at 9.4T, our imaging strategy has been to use very short echo times like 5 ms to minimize susceptibility artifacts, and we then inject large doses of iron (30–40 mg/kg, corresponding to an agent-induced relation rate of 200/sec) to optimize detection power (Mandeville et al., 2004). For single-shot EPI in awake non-human primates at 3T, we employ longer echo times like 20 ms and limit the injected dose to about 10 mg/kg in each session to reduce iron accumulation due to repeated studies over years (Leite et al., 2002).
Figure 1.

Contrast to noise (CNR) concepts for IRON fMRI. a) In the plane of IRON detection power versus echo time and agent-induced relaxation rate (a function of injected dose), the highest detection powers occur at short echo times with large doses of agent. b) The IRON method improves CNR relative to BOLD signal, particularly at lower magnetic field strengths. The shaded region encompasses IRON echo times that range from one quarter to one half of the endogenous tissue T2*, while the BOLD echo time is matched to tissue T2*. c) IRON and BOLD detection powers have very different dependencies on basal CBV. The scaling of curves corresponds to 3 Tesla, and the spread of each curve is set by the range of maximal BOLD signal changes reported in human subjects at 3 Tesla. d) Gradient-echo (GE) signal acquisitions are insensitive to vessel size, whereas spin-echo (SE) sensitivity drops with vessel diameter. As a consequence, activation-induced vessel dilation produces larger signal changes using GE measurements.
Figure 1b depicts the ratio of IRON to BOLD CNR as a function of magnetic field strength. At high doses of agent, IRON CNR is proportional to the percentage change in CBV independent of field strength (Kennan et al., 1998, Mandeville et al., 1998), whereas BOLD CNR increases with field strength. Consequently, the relative CNR advantage of the IRON method decreases with field strength. Calculations have been validated by numerous empirical results versus field strength (Mandeville et al., 1998, Chen et al., 2001, Mandeville et al., 2001, Vanduffel et al., 2001, Mandeville et al., 2004, Zhao et al., 2006, Lu et al., 2007).
The amount of signal attenuation due to exogenous agent varies with CBV across the brain, so the transverse relaxation rate in Fig. 1a represents a global average. The dependence of CNR on local CBV is quite different than for BOLD signal, as shown in Fig. 1c (Mandeville et al., 2004). The range of the theoretical curves in the figure is set by the range of results obtained for the maximal strength of the BOLD signal at 3 Tesla (Leontiev et al., 2007). In a regime of very low blood magnetization, such as produced by the BOLD effect, absolute signal changes have a roughly linear dependence upon CBV, so that large veins and other high CBV regions, including superficial cortex, exhibit markedly higher BOLD signal changes than parenchymal tissue. Conversely, an appropriate dose of contrast agent tunes the peak of the IRON CNR curve to parenchymal tissue while reducing detection power in regions with very high CBV. Across a 3-fold range of parenchymal CBV, the IRON CNR curve varies by only about 20%. These different dependencies on basal CBV predict a shift between BOLD and IRON activation foci across cortical laminae due to the progressive increase in CBV from inner to outer layers, and this is observed (Mandeville and Marota, 1999). In gyrencephalic species like monkeys, the shift of IRON activation foci toward central lamina has the practical advantage of aiding the determination of which cortical bank is activated in a sulcus (Vanduffel et al., 2001).
It should be noted that the spatial shift of activation foci across cortical laminae cannot be attributed entirely to the different CNR characteristics of BOLD and IRON fMRI versus basal CBV. Indeed, several high-resolution studies of cat visual cortex have argued for a physiological contribution to this shift (Harel et al., 2006, Zhao et al., 2006). The most obvious physiological source is non-local BOLD signal changes within draining veins, a well-established phenomenon. Exclusion of surface laminae was shown to narrow the spread of BOLD signal tangential to the pial surface (Polimeni et al., 2010), consistent with a draining vein contribution in superficial cortex. Additionally, total basal CBV and mean vessel size both increase from middle to outer cortical layers (Mandeville et al., 2007a), consistent with the notion that superficial cortex contains a greater contribution from large conduit vessels than the middle cortical layers. Changes in total CBV near the cortical surface are small; in fact, the mean vessel size in this region actually drops during activation as relative changes in microvascular CBV exceed relative changes in total CBV (Zhao et al., 2006, Mandeville et al., 2007b). Again, this response is consistent with a greater number of weakly reactive conduit vessels near the cortical surface.
Because the choice of agent dose enables optimization of blood magnetization irrespective of whether gradient echoes or spin echoes are employed for acquisition, it is tempting to think that spin echoes could be employed to eliminate macroscopic susceptibility artifacts while achieving a detection power equal to that provided by gradient echoes. In fact, spin-echo measurements systematically underestimate changes in microvascular CBV. As vessels swell in response to functional activation, more paramagnetic media enters activated voxels but with a sub-linear effect on the relaxation rate (Fig. 1d), due to a monotonic decrease in sensitivity with increasing vessel diameter (Mandeville et al., 2007a). As a consequence, spin-echo measurements are not a reliable index of CBV changes in the microvasculature, and spin echo methods cannot achieve detection powers as high as gradient-echo methods.
2.4 Temporal Response of CBV: Background
The basic dynamics of CBF were well known prior to the first IRON fMRI studies of CBV. Local blood flow is regulated primarily through changes in vessel caliper at the level of arterioles, the primary resistance vessels. As such, the temporal response of total CBV must contain a rapid component associated with arterial dilation under active control mechanisms that enforce neurovascular coupling. As arterials dilate, more pressure is shifted downstream onto capillaries and venules. Although capillaries once were considered to be nondistensible, animal studies using perfusion fixation reported that “capillaries are not rigid tubes as previously portrayed” (Atkinson et al., 1990), but rather have a “moderate degree of extensibility” (Duelli and Kuschinsky, 1993). Optical imaging of intrinsic signals and intravascular dye found rapid and highly localized changes in blood volume (Frostig et al., 1990), also implicating a capillary response. Together, these data and principles suggested a rapid response of CBV that is quite similar to CBF in the temporal domain.
Empirical data for the temporal response of CBV, particularly using long stimulus durations, were sparse by the middle 1990s. PET studies using respiratory challenges defined a CBF-CBV relationship in which relative changes in CBV (v=V/V0) could be related to relative changes in CBF (f=F/F0) by a power law: v = fϕ, where the exponent was approximately 0.4 (Grubb et al., 1974). However, PET cannot capture the temporal domain with sufficient resolution to define the hemodynamic responses that accompany rapid changes in cerebral function. Optical imaging experiments typically employed stimuli of very short duration, which do not efficiently capture slow-frequency changes in CBV. Moreover, most optical imaging analyses during the 1990s did not accurately separate absorption due to oxygenated and deoxygenated hemoglobin, leading to transient features of chromophore concentrations that were highly exaggerated (Kohl et al., 2000, Lindauer et al., 2001). Optical analyses still face an ill-posed inverse problem when probing focal activation, due to different sampling volumes at each wavelength (Boas et al., 2001).
Functional imaging using exogenous contrast agents in animal models opened a temporal window on the transient response of CBV during focal brain activation. The basic features of the IRON fMRI response have been observed in anesthetized rodents and awake non-human primates by multiple laboratories (Mandeville et al., 1998, Vanduffel et al., 2001, Leite et al., 2002, Lu et al., 2005, Yacoub et al., 2006, Kida et al., 2007, Lu et al., 2007, Silva et al., 2007, Hirano et al., 2011). CBV shares temporal components with both CBF and BOLD signal, although the overall temporal response of CBV is markedly different from CBF and BOLD signal. Empirically, the slow response of CBV appears to adequately explain the post-stimulus undershoot in BOLD signal, although this response has not been reproduced by some alternative methods, and other factors also may contribute to the BOLD undershoot.
2.5 Temporal Response of CBV: Empirical Results
During focal neuronal activation in a rat model, we observed a magnitude relationship between functional changes in CBV and CBF that was very similar to prior results by PET after prolonged stimulation, but this relationship was variable during transition states. Using a relatively long sampling interval of 3 seconds, we found a slow response of CBV following both stimulus onset and cessation that could be described by a single exponential function that did not reach a steady state for tens of seconds (Mandeville et al., 1998). We ascribed the slow CBV response to a passive dilation of capillaries and veins in response to increased intraluminal pressure, and we suggested that a CBF-CBV temporal mismatch could explain the BOLD post-stimulus undershoot. Faster sampling rates in rat models revealed both fast and slow CBV temporal components that were clearly differentiated (Mandeville et al., 1999b, Lu et al., 2005, Kida et al., 2007, Silva et al., 2007, Hirano et al., 2011). In fact, CBV initially responds as rapidly as CBF measured by laser Doppler flowmetry (Mandeville et al., 1999b) and faster than BOLD signal (Silva et al., 2007), which is shifted relative to CBF due to the washout time for deoxygenated hemoglobin (Marota et al., 1999). For short stimulus presentations, the slow component of the CBV response is subtle and is manifest as a small post-stimulus tail (Mandeville et al., 1998, Silva et al., 2007). Also, the magnitude of the CBV response after a short stimulus is much smaller in relation to CBF than would predicted by the steady-state formulation suggested by Grubb (Mandeville et al., 1999b, Kida et al., 2007).
During prolonged stimulation, a slow increase of CBV follows the initial rapid response in a way that is generally consistent with a linear model analysis based upon a short stimulus (Vanduffel et al., 2001, Leite et al., 2002, Lu et al., 2005, Silva et al., 2007). Figure 2a shows IRON and BOLD hemodynamic response functions, each scaled to the same integrated area, as measured in awake non-human primates (Leite et al., 2002); to view response functions normalized to the same peak magnitude, refer to the original manuscript. In monkeys, the fast and slow components of the CBV response (Vanduffel et al., 2001, Leite et al., 2002) are not as obviously differentiated as in the rat (Mandeville et al., 1998, Silva et al., 2007), which might be a consequence of different arteriole-venous transit times (see Discussion). However, short and long stimulus paradigms clearly reveal two temporal components in the monkey (Leite et al., 2002).
Fig. 2.
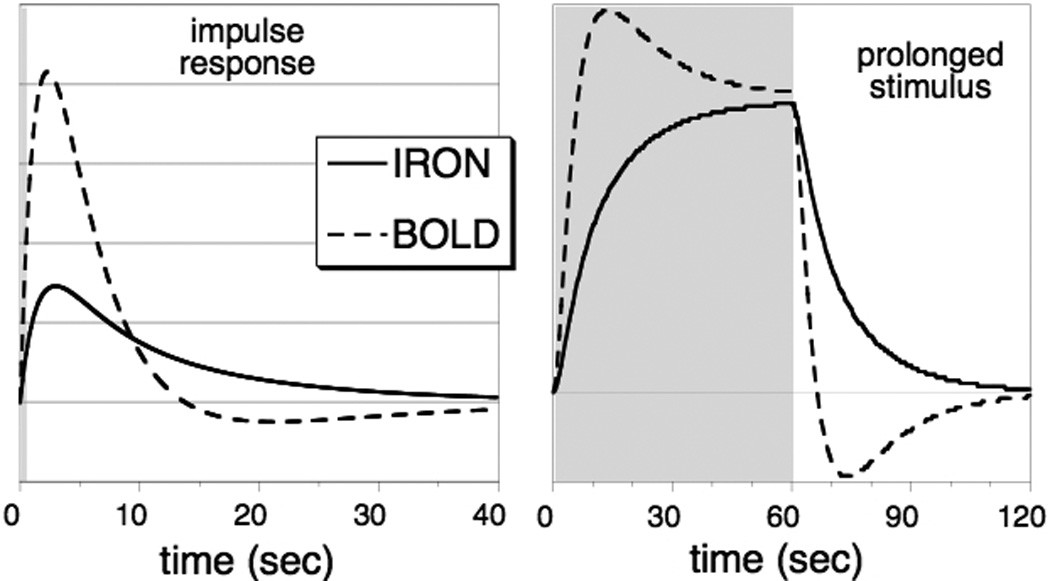
LEFT: The impulse response function for IRON and BOLD fMRI, normalized to the same integrated area, as measured in awake non-human primates (Leite et al., 2002). RIGHT: The convolution of the respective impulse response functions with a long block stimulus, showing the slow response of total CBV in relation to the BOLD post-stimulus undershoot.
Qualitatively, the main difference between the BOLD and IRON impulse response functions is the opposite sign of the post-stimulus tails. Also, the IRON response contains much more relative strength at long times (low frequencies) relative to the BOLD response. As a consequence, neuronal stimulation causes the IRON response to wax and wane slowly relative to BOLD signal during prolonged stimulation (Figure 2b). As a practical matter, this means that experiments that require event-related designs or short stimulus durations do not benefit as much from the use of contrast agent as block designs (Leite et al., 2002, Leite and Mandeville, 2006), where the slow response is dominant. As with BOLD signal, randomization of inter-stimulus intervals improves detection power in event-related designs; this is particularly important for IRON fMRI due to the larger fraction of the response at low frequencies (Leite and Mandeville, 2006). Note that rapid stimulus presentation induces a pronounced baseline shift of IRON signal, because the slow component of the CBV response does not resolve to baseline during the interstimulus intervals (Leite et al., 2002, Leite and Mandeville, 2006).
Can we quantify the relative strengths of the fast and slow components in the temporal response of CBV? Using visual stimulation in awake monkeys, a temporal decomposition of IRON signal found that 70–80% of the strength resided in the slow component for prolonged stimulation (Leite et al., 2002). In a rat model of forepaw stimulation, the slow response accounted for about 80% of the response after 30 seconds (Silva et al., 2007).
2.6 BOLD Post-stimulus Undershoot
Transients features of BOLD signal can be driven by neuronal transients through neurovascular coupling, but one transient feature – a post-stimulus undershoot – is particularly pervasive and appears not to be present with same frequency and strength in CBF. Following prolonged stimulation, BOLD signal generally drops below baseline for several tens of seconds, as noted in the earliest BOLD publications (Kwong et al., 1992, Ogawa et al., 1992). This feature of BOLD signal is so commonly observed that most fMRI analysis packages include an undershoot in the canonical BOLD impulse response function.
In a rat forepaw stimulation model, our data showed that the BOLD post-stimulus undershoot began at a time point when CBF dropped below CBV following stimulus cessation, and the post-stimulus undershoot resolved to baseline with CBV (Mandeville et al., 1999a). Note that elevation of CMRO2 during the post-stimulus time window would shift the onset of the BOLD undershoot relative to the crossover point of CBF and CBV, but this was not observed. Stimulus-correlated elevation of CMRO2 was about 3-fold smaller than the relative change in CBF, consistent with the range of results obtained in human studies (reviewed elsewhere in this issue). The temporal relationship between BOLD and IRON fMRI data across a wide range of stimulus paradigms provides particularly compelling evidence that the slow component of CBV affects both signals (Leite et al., 2002).
Data from cat visual cortex found a spatially variable post-stimulus relationship between BOLD and IRON signal (Yacoub et al., 2006). Specifically, tissue regions exhibited a response similar to results reported in anesthetized rats and awake monkeys, but superficial cortex exhibited a BOLD post-stimulus undershoot without a pronounced elevation of CBV during that time window. These data raise the possibility that changes in blood oxygenation might account for part of the BOLD undershoot. However, undershoots in arteriole diameter also might explain a different temporal response of CBV in superficial cortex. This issue is addressed in Discussion.
3. Discussion
3.1 Impact of IRON fMRI studies
IRON fMRI studies had several immediate impacts on the neuroimaging community. From a physiological viewpoint, it became apparent that the relationship between blood flow (f) and volume (v) was far more complicated than the simple power-law relationship (v = fϕ) suggested by a pipe model or by prior PET measurements. Rather, data demonstrated a variable flow-volume relationship during transition states and implicated the temporal mismatch between flow and volume as a source of prominent transient features in the BOLD response. These data motivated the development of computational frameworks of BOLD signal that allowed for different dynamics in flow and volume (Buxton et al., 1998) and for physiological models that attempted to describe those dynamics (Mandeville et al., 1999b, Buxton et al., 2004, Kong et al., 2004, Zheng and Mayhew, 2009). The variable flow-volume relationship emphasized the necessity of measuring CBV when drawing inferences about the temporal evolution of oxygen utilization using the “calibrated BOLD” method (Mandeville et al., 1999a) and cautioned human studies to avoid transient features of BOLD signal when CBV data are lacking, as noted by Davis et al. (Davis et al., 1998). Finally, CBV measurements in animal models suggested that the BOLD undershoot may result purely from vascular mechanics, rather than from a temporal “uncoupling” between blood flow and oxygen utilization (Frahm et al., 1996).
As an imaging technique applied within animal models, IRON fMRI has been invaluable for numerous applications (Tootell et al., 2003, Jenkins et al., 2004, Mandeville et al., 2011). In our laboratory, this method quickly became the imaging tool of choice for most fMRI applications in animal models, and its use continues to expand with the increased availability of suitable contrast agents and the increased awareness of the advantages of the IRON method, particularly for field strengths below 10 Tesla.
3.2 Open questions and on-going controversies
3.2.1 CBF-CBV models and interpretation
The response of CBV, as measured by IRON fMRI, clearly exhibits two temporal components following stimulus onset and cessation: a “fast” response that is comparable to the response of CBF, and a “slow” component relative to CBF that is most clearly visualized during prolonged stimulation. Obviously, arterial dilation must account for a portion of the fast response, but an elastic response from down-stream vessels also may contribute. Arterial dilation produces an increase in intraluminal pressure in capillaries and venules, which should respond in time as a temporal convolution of arterial dilation with a transit time function. As such, the downstream elastic response should occur together with the arteriole response but be subtly skewed toward later times. One indication of the existence of an elastic contribution to the fast CBV response might be the difference observed between rats and monkeys: while both CBV components are observed in both species, they are more clearly differentiated in the rat. The longer arteriole-venous transit time in the monkey might blur the distinction between temporal components by elongating the elastic contribution to the fast component.
The more interesting part of the CBV temporal response is the slow component, for which the mechanism is completely unclear. Because the slow component of the CBV response is not associated with a pronounced effect on blood flow, arterioles cannot be a major contributor to this effect. Hence, the slow response of CBV can be explained only by postulating active control of vessel caliper in capillaries and venules (which can occur on any time scale, in principle) or by invoking a physical mechanism that opposes the volumetric expansion in these vessels in response to arterial-mediated pressure changes.
Simple models of the relationship between CBF and post-arteriole CBV have focused on the latter explanation. Using values for flow and volume normalized to pre-stimulus baselines (f=F/F0, v=V/V0), the time derivative of the volume change can be related to flow by a time constant τ
If we set the “delayed compliance” term a(t) to unity and define the time constant to be the mean transit time (MTT), then this reflects an “elastic windkessel” (Mandeville et al., 1999b) or a “simple balloon” (Kong et al., 2004, Zheng and Mayhew, 2009). A step change in flow produces a rapid pressure-modulated downstream expansion of blood volume that follows an exponential form on the time scale of the MTT to a final steady state condition defined by a power law: v(∞) = fϕ (∞). For stimuli of short duration, where the BOLD post-stimulus undershoot and the tail of the CBV response are small, this basic form has been applied to model data from fMRI (Friston et al., 2000) and optical imaging (Huppert et al., 2007). In order to accurately model BOLD dynamics on the time scale of the MTT, including subtle shifts between the responses of oxyhemoglobin and deoxyhemoglobin (Huppert et al., 2007), it is necessary to abandon steady-state BOLD frameworks that ignore transit-time phenomena (e.g., (Ogawa et al., 1993)) and instead use a dynamic computational framework like the Balloon model (Buxton et al., 1998).
The elastic windkessel ignores the slow phase of the CBV response, so it cannot describe empirical IRON data for prolonged stimuli. One solution to this problem is to extend the time constant (τ = τMTT + τ′) by conjecturing a resistance to volume expansion that resolves with a new time constant much longer than the MTT (Buxton et al., 2004). The new time constant can be tuned to explain either a fast or a slow response of post-arteriole CBV, but not both simultaneously.
By maintaining the MTT in Equation 1 but positing a time-dependent change in compliance, the downstream response will be comprised of a rapid elastic expansion followed by a slow response driven by “delayed compliance” (Mandeville et al., 1999b). Casting vessel compliance in terms of CBV and its rate of change can eliminate the explicit time dependence of the delayed compliance (Kong et al., 2004, Zheng and Mayhew, 2009). All these models require the introduction of a time constant in addition to the MTT in order to describe the IRON fMRI data, and so the downstream response no longer is described by a time-independent pressure-volume curve; instead, it is a viscoelastic “balloon”. These models can describe both rapid expansion of capillary CBV, as suggested by optical imaging, and a subsequent slow response of post-arteriole CBV in order to describe IRON fMRI data.
Stress relaxation of venous smooth muscle is one proposed mechanism for the delayed compliance effect that produces a slow phase of CBV (Buxton et al., 1998, Mandeville et al., 1999b, Kong et al., 2004, Zheng and Mayhew, 2009). Pressure-response curves in isolated ex vivo veins provide a compelling case for the physiological plausibility of this argument (Porciuncula et al., 1964). However, this mechanism is conjecture. Stress relaxation data exist only for large veins, which possess almost no resistance and would not be expected to participate in a pressure-modulated expansion of post-arteriole CBV. Alternative mechanisms in vivo include rate limitations on the displacement of extravascular volume (primarily CSF) during CBV expansion, or even pericyte-mediated capillary dilation due to vasoactive agents that augment and focus the response of the neurovascular unit. It is important to emphasize that we understand neither the mechanism nor the volume compartments (capillary, venule) that produce the slow response of CBV. Stress relaxation would implicate venous vessels, whereas other mechanisms could involve capillaries as well, and thereby have implications for the dynamics of oxygen extraction.
3.2.2 Role of venous CBV in BOLD signal
BOLD signal arises from competing influences that alter the concentration of paramagnetic deoxygenated hemoglobin in a tissue volume. If relative changes in task-induced CBF and CMRO2 were matched, then deoxyhemoglobin would function as an endogenous tracer of venous-weighted CBV, much as exogenous agent functions as a tracer of total CBV. However, CBF outstrips CMRO2 to increase venous oxygenation (Fox and Raichle, 1986), and this effect exceeds the negative influence from CBV to produce an increased BOLD signal shortly after increased neuronal activity. While these basic contributions to BOLD signal are understood, the precise temporal and magnitude relationships remain controversial, largely because there is no way to directly and accurately measure CMRO2. As a result, CMRO2 is inferred as a missing variable in the BOLD response after accounting for all other contributions, and this is where CBV methods become important tools for probing BOLD physiology. However, BOLD signal is influenced only by the volumetric response of vessels containing deoxygenated hemoglobin, and the nature of the “venous” CBV response is controversial in several respects. What is the magnitude of the venous CBV response in relation to relative changes in CBF? What is the temporal response of venous CBV, and does this create BOLD transients including the post-stimulus undershoot?
Uncertainties in the magnitude response of venous CBV propagate into uncertainties in the CBF-CMRO2 response ratio, as measured through the BOLD response. Using temporal decompositions of IRON fMRI signal, about three quarters of the steady-state response of total CBV was attributed to the slow component of the response (Leite et al., 2002, Silva et al., 2007). By comparing changes in total and arterial CBV, the steady-state venous response was estimated to compromise about half of the total CBV change (Kim and Kim, 2011). Of course, these results should be normalized to the resting state venous blood volume fraction for determining the CBV influence on BOLD signal. Assuming that the basal “venous” contribution is 75% of total CBV, these reports suggest that relative changes in post-arteriole CBV are two-thirds as large, or even equal to, relative changes in total CBV following prolonged stimulation. Conversely, the VERVE method estimated that relative changes in venous CBV are only about 60% as large as changes inferred through the Grubb relationship (Chen and Pike, 2009a).
Fortunately, the self-correcting nature of the hypercapnia calibration method is such that uncertainties in the CBF-CBV coupling relationship do not appear to drive uncertainties in CMRO2 under most circumstances. Rather, the largest source of variation is statistical and systematic error in the BOLD-CBF scaling parameter M (Chiarelli et al., 2007, Leontiev et al., 2007). Nevertheless, a better understanding of the resting state distribution of CBV and the relative functional responses of arteries, capillaries, and veins ultimately will be required to improve estimates of CMRO2 that are derived from BOLD signal.
During the past decade, the BOLD-CBV temporal relationship has been addressed by several MRI techniques that report aspects of CBV, and each method has potential drawbacks. The IRON method measures plasma volume, not red blood cell volume, and so potential changes in hematocrit during brain activation would be reflected in the temporal response of this method. Correlations between plasma CBV by MRI and total blood cell volume by optical imaging provide an obvious means to evaluate this issue, and some comparisons have shown a high degree of similarity between MRI and optical markers of CBV and BOLD signal (Siegel et al., 2003, Herman et al., 2009). However, there currently appears to be no consensus within the optical imaging literature about the response of CBV or the origin of the post-stimulus overshoot in deoxygenated hemoglobin, as this issue is clouded by a wide range of sampling methods, tissue volumes, and analysis techniques.
The VASO MRI technique (Lu et al., 2003) sensitizes signal to CBV without the need to inject contrast agent, which enables measurements in human subjects. The original implementation of this method inferred changes in CBV by globally inverting signal and imaging at the null point for T1 recovery of the blood signal, assuming a two-compartment model comprised of tissue and blood. This method reported that CBV exhibited a slow decay after stimulus cessation (Lu et al., 2003), but that CBV did not contribute to the BOLD undershoot when selecting voxels that were activated by both methods (Lu et al., 2004). Among several confounds that must be minimized in order to associate VASO signal with CBV (Donahue et al., 2006), the method must account for all volume compartments that are being displaced as CBV increases. In particular, a failure to null signal from cerebral spinal fluid (CSF) leads to an incorrect sign of CBV changes in some brain regions using a well-established respiratory challenge (Scouten and Constable, 2007, Scouten and Constable, 2008). However, data based upon a double-inversion technique to simultaneously null both blood and CSF signal did not revealed a flow-volume mismatch but rather attributed the BOLD post-stimulus undershoot to CMRO2 (Donahue et al., 2009).
Unlike VASO or IRON signals, the VERVE technique (Stefanovic and Pike, 2005) is based upon BOLD signal and thus is sensitive to the same “venous” CBV compartments that contribute to the BOLD effect. Because this method isolates intravascular blood signal as a difference of spin-echo BOLD measurements, signal changes are weak and a model correction is required to remove blood oxygenation contributions to the signal in order to interpret results in terms of CBV. The VERVE method reported a negative correlation between venous CBV and BOLD signal in the post-stimulus region (Chen and Pike, 2009b), in agreement with IRON fMRI measurements.
3.2.3 BOLD post-stimulus undershoot
Although the BOLD undershoot is a small feature of fMRI signal that may not seem worthy of the amount of attention it has received, this phenomenon generates interest due to its potential to reveal aspects of neurvascular coupling on a relatively short time scale. How tightly does the brain regulate flow and oxygen delivery during neuronal activity? Results obtained by the IRON method consistently implicate CBV as a source of the BOLD post-stimulus undershoot, but there also have been reports of post-stimulus undershoots in CBF (Hoge et al., 1999, Chen and Pike, 2009b) and arteriole diameters (Hillman et al., 2007, Tian et al., 2010), while other multimodal measurements have attributed BOLD post-stimulus dynamics to CMRO2 (Lu et al., 2004, Donahue et al., 2009).
Given the tight temporal correlation between the BOLD post-stimulus undershoot and the IRON response, any model of the post-stimulus undershoot should explain this relationship. If we start from a viewpoint that a flow-volume mismatch occurs and contributes to the BOLD post-stimulus undershoot, what implications can be drawn for other measurements? First, a post-stimulus undershoot in arteriole CBV must occur in order to counter decreased resistance (elevated volume) in post-arteriole compartments if the CBF response is to normalize (or undershoot) during the post-stimulus window associated with the BOLD undershoot. In fact, arteriole diameters undershoot with a temporal response that is roughly consistent with this explanation (Tian et al., 2010). Some estimates ascribe the majority of cerebral arterial resistance to pial and larger arteries (Iadecola and Nedergaard, 2007), suggesting that the arterial CBV response is more prominent in superficial cortex than in brain tissue. A larger contribution from arterioles near the cortical surface might explain two phenomena: 1) the lack of the characteristic delayed CBV response near superficial cortex (Yacoub et al., 2006), due to a cancellation between decreased arterial CBV and elevated post-arteriole CBV, and 2) reports of undershoots in oxygenated and/or total hemoglobin (Siegel et al., 2003, Huppert et al., 2006) by optical imaging, a modality that weights results toward superficial cortex. The model outlined here assumes that CBF regulation follows neural function in the temporal domain.
Considerably more complex issues arise if capillaries participate in the slow response of CBV. There are reasons to suspect this occurs: spin-echo and gradient-echo MRI measurements of CBV have similar temporal profiles (Lu et al., 2007), and regions devoid of large vessels show a small post-stimulus tail of total hemoglobin change following short stimuli (Hillman et al., 2007). Elevation of capillary surface area during the post-stimulus window would facilitate increased oxygen delivery even if CBF has resolved to baseline. Conversely, a small post-stimulus undershoot of CBF would provide a mechanism to renormalize the rate of oxygen extraction into tissue even during post-stimulus elevation of capillary CBV.
Thus, it is not difficult to envision theoretical scenarios with temporal correlations between the post-stimulus responses of BOLD signal, total CBV, arteriole diameters, CBF, and even blood oxygenation with or without post-stimulus elevation of CMRO2. Although the hypothesis of a temporal mismatch between CBF and CBV accounts for many experimental observations regarding the BOLD undershoot, physiological couplings certainly add a layer of complexity to this problem, and the BOLD undershoot ultimately may result from more than just a slow response of CBV. Once again, the main source of uncertainty derives from our inability to measure CMRO2 directly, placing an emphasis on the accuracy of other experimental measurements and illustrating the need to formulate models of the dynamic functional response that consistently address multi-scale and multi-modality measurements.
3.3 Future Prospects: IRON fMRI as a clinical tool?
The IRON method has not been applied in human subjects to date. While BOLD signal is a proven neuroscience tool for drawing inferences in multi-subject studies, potential fMRI applications for individualized medicine, such as pre-operative brain mapping, place a premium on detection power.
There currently are no iron oxides approved for use as MRI contrast agents in human subjects. However, ferumoxytol has been approved in the USA for the treatment of iron deficiency anemia in adult patients with chronic kidney disease (Lu et al., 2010). With a blood half-life of hours, this agent is a suitable candidate for clinical fMRI, so it is appropriate to speculate whether the recommended intravenous iron dosage of 510 mg would enable effective clinical brain mapping. Using a body weight of 70 kg to normalize this dose, standard theoretical calculations and empirical data in awake non-human primates suggest that this dosage should improve detection power relative to BOLD signal by factors of approximately 5 at 1.5 Tesla and 2 at 3 Tesla (Mandeville et al., 2010), while elevating total body iron levels by about 10%. Although higher detection power provides a compelling argument for use of exogenous agent for clinical fMRI, the utility of this method ultimately will be determined by safety profiles for injected agents and by a broader range of issues that have limited the clinical use of fMRI to date (Jezzard and Buxton, 2006).
Acknowledgments
These studies were funded primarily by the National Institutes of Health, and particularly by the National Institute for Biomedical Imaging and Bioengineering (NIBIB) and the National Institute on Drug Abuse (NIDA). Many co-investigators contributed to this work. In particular, John Marota was a key collaborator in the studies that first characterized this methodology, and Wim Vanduffel and colleagues developed the awake non-human primate model for functional MRI that is used in our laboratory and many others.
References
- Atkinson JL, Anderson RE, Sundt J, T M. The effect of carbon dioxide on the diameter of brain capillaries. Brain Res. 1990;517:333–340. doi: 10.1016/0006-8993(90)91046-j. [DOI] [PubMed] [Google Scholar]
- Bandettini PA, Wong EC, Hinks RS, Tikofsky RS, Hyde JS. Time course EPI of human brain function during task activation. Magn Reson Med. 1992;25:390–397. doi: 10.1002/mrm.1910250220. [DOI] [PubMed] [Google Scholar]
- Belliveau JW, Kennedy DN, Jr, McKinstry RC, Buchbinder BR, Weisskoff RM, Cohen MS, Vevea JM, Brady TJ, Rosen BR. Functional mapping of the human visual cortex by magnetic resonance imaging. Science. 1991;254:716–719. doi: 10.1126/science.1948051. [DOI] [PubMed] [Google Scholar]
- Boas DA, Gaudette T, Strangman G, Cheng X, Marota JJA, Mandeville JB. The Accuracy of Near Infrared Spectroscopy and Imaging during Focal Changes in Cerebral Hemodynamics. NeuroImage. 2001;13:76–90. doi: 10.1006/nimg.2000.0674. [DOI] [PubMed] [Google Scholar]
- Boxerman JL, Hamberg LM, Rosen BR, Weisskoff RM. MR contrast due to intravascular magnetic susceptibility perturbations. Magn Reson Med. 1995;34:555–566. doi: 10.1002/mrm.1910340412. [DOI] [PubMed] [Google Scholar]
- Buxton RB, Uludag K, Dubowitz DJ, Liu TT. Modeling the hemodynamic response to brain activation. Neuroimage. 2004;23(Suppl 1):S220–S233. doi: 10.1016/j.neuroimage.2004.07.013. [DOI] [PubMed] [Google Scholar]
- Buxton RB, Wong EC, Frank LR. Dynamics of Blood Flow and Oxygenation Changes during Brain Activation: The Balloon Model. Magn Reson Med. 1998;39:855–864. doi: 10.1002/mrm.1910390602. [DOI] [PubMed] [Google Scholar]
- Chen JJ, Pike GB. BOLD-specific cerebral blood volume and blood flow changes during neuronal activation in humans. NMR Biomed. 2009a;22:1054–1062. doi: 10.1002/nbm.1411. [DOI] [PubMed] [Google Scholar]
- Chen JJ, Pike GB. Origins of the BOLD post-stimulus undershoot. Neuroimage. 2009b;46:559–568. doi: 10.1016/j.neuroimage.2009.03.015. [DOI] [PubMed] [Google Scholar]
- Chen YI, Mandeville JB, Nguyen TV, Talele A, Cavagna F, Jenkins BG. Improved Mapping of Pharmacologically Induced Neuronal Activation using the IRON Technique with Superparamagnetic Iron Blood Pool Agents. J Magn Reson Imaging. 2001;14:517–524. doi: 10.1002/jmri.1215. [DOI] [PubMed] [Google Scholar]
- Chiarelli PA, Bulte DP, Gallichan D, Piechnik SK, Wise R, Jezzard P. Flow-metabolism coupling in human visual, motor, and supplementary motor areas assessed by magnetic resonance imaging. Magn Reson Med. 2007;57:538–547. doi: 10.1002/mrm.21171. [DOI] [PubMed] [Google Scholar]
- Davis TL, Kwong KK, Bandettini PA, Weisskoff RM, Rosen BR. Mapping the Dynamics of Oxidative Metabolism by Functional MRI. Proceedings of the Int Soc Magn Reson Med, Fifth Annual Meeting; Vancouver, BC, Canada. 1997. p. 151. [Google Scholar]
- Davis TL, Kwong KK, Weisskoff RM, Rosen BR. Calibrated functional MRI: Mapping the dynamics of oxidative metabolism. Proc Natl Acad Sci USA. 1998;95:1834–1839. doi: 10.1073/pnas.95.4.1834. [DOI] [PMC free article] [PubMed] [Google Scholar]
- Donahue MJ, Blicher JU, Ostergaard L, Feinberg DA, MacIntosh BJ, Miller KL, Gunther M, Jezzard P. Cerebral blood flow, blood volume, and oxygen metabolism dynamics in human visual and motor cortex as measured by whole-brain multi-modal magnetic resonance imaging. J Cereb Blood Flow Metab. 2009;29:1856–1866. doi: 10.1038/jcbfm.2009.107. [DOI] [PubMed] [Google Scholar]
- Donahue MJ, Lu H, Jones CK, Edden RA, Pekar JJ, van Zijl PC. Theoretical and experimental investigation of the VASO contrast mechanism. Magn Reson Med. 2006;56:1261–1273. doi: 10.1002/mrm.21072. [DOI] [PubMed] [Google Scholar]
- Duelli R, Kuschinsky W. Changes in Brain Capillary Diameter During Hypocapnia and Hypercapnia. Journal of Cerebral Blood Flow and Metabolism. 1993;13:1025–1028. doi: 10.1038/jcbfm.1993.129. [DOI] [PubMed] [Google Scholar]
- Fox PT, Raichle ME. Focal physiological uncoupling of cerebral blood flow and oxidative metabolism during somatosensory stimulation in human subjects. Proc Natl Acad Sci USA. 1986;83:1140–1144. doi: 10.1073/pnas.83.4.1140. [DOI] [PMC free article] [PubMed] [Google Scholar]
- Frahm J, Kruger G, Merboldt KD, Kleinschmidt A. Dynamic uncoupling and recoupling of perfusion and oxidative metabolism during focal brain activation in man. Magn Reson Med. 1996;35:143–148. doi: 10.1002/mrm.1910350202. [DOI] [PubMed] [Google Scholar]
- Friston KJ, Mechelli A, Turner R, Price CJ. Nonlinear responses in fMRI: the Balloon model, Volterra kernels, and other hemodynamics. Neuroimage. 2000;12:466–477. doi: 10.1006/nimg.2000.0630. [DOI] [PubMed] [Google Scholar]
- Frostig RD, Lieke EE, Tso DY, Grinvald A. Cortical functional architecture and local coupling between neuronal activity and the microcirculation revealed by in vivo high-resolution optical imaging of intrinsic signals. Proc Natl Acad Sci USA. 1990;87:6082–6086. doi: 10.1073/pnas.87.16.6082. [DOI] [PMC free article] [PubMed] [Google Scholar]
- Grubb RL, Raichle ME, Eichling JO, Ter-Pogossian MM. The effects of changes in PaCO2 on cerebral blood volume, blood flow, and vascular mean transit time. Stroke. 1974;5:630–639. doi: 10.1161/01.str.5.5.630. [DOI] [PubMed] [Google Scholar]
- Hamberg LM, Boccalini P, Stranjalis G, Hunter GJ, Huang Z, Halpern E, Weisskoff RM, Moskowitz MA, Rosen BR. Continuous Assessment of Relative Cerebral Blood Volume in Transient Ischemia using Steady State Susceptibility-Contrast MRI. Magn Reson Med. 1996;35:168–173. doi: 10.1002/mrm.1910350207. [DOI] [PubMed] [Google Scholar]
- Harel N, Lin J, Moeller S, Ugurbil K, Yacoub E. Combined imaging-histological study of cortical laminar specificity of fMRI signals. Neuroimage. 2006;29:879–887. doi: 10.1016/j.neuroimage.2005.08.016. [DOI] [PubMed] [Google Scholar]
- Herman P, Sanganahalli BG, Hyder F. Multimodal measurements of blood plasma and red blood cell volumes during functional brain activation. J Cereb Blood Flow Metab. 2009;29:19–24. doi: 10.1038/jcbfm.2008.100. [DOI] [PMC free article] [PubMed] [Google Scholar]
- Hillman EM, Devor A, Bouchard MB, Dunn AK, Krauss GW, Skoch J, Bacskai BJ, Dale AM, Boas DA. Depth-resolved optical imaging and microscopy of vascular compartment dynamics during somatosensory stimulation. Neuroimage. 2007;35:89–104. doi: 10.1016/j.neuroimage.2006.11.032. [DOI] [PMC free article] [PubMed] [Google Scholar]
- Hirano Y, Stefanovic B, Silva AC. Spatiotemporal evolution of the functional magnetic resonance imaging response to ultrashort stimuli. J Neurosci. 2011;31:1440–1447. doi: 10.1523/JNEUROSCI.3986-10.2011. [DOI] [PMC free article] [PubMed] [Google Scholar]
- Hoge RD, Atkinson J, Gill B, Crelier GR, Marrett S, Pike GB. Stimulus-dependent BOLD and perfusion dynamics in human V1. NeuroImage. 1999;9:573–585. doi: 10.1006/nimg.1999.0443. [DOI] [PubMed] [Google Scholar]
- Huppert TJ, Allen MS, Benav H, Jones PB, Boas DA. A multicompartment vascular model for inferring baseline and functional changes in cerebral oxygen metabolism and arterial dilation. J Cereb Blood Flow Metab. 2007;27:1262–1279. doi: 10.1038/sj.jcbfm.9600435. [DOI] [PMC free article] [PubMed] [Google Scholar]
- Huppert TJ, Hoge RD, Diamond SG, Franceschini MA, Boas DA. A temporal comparison of BOLD, ASL, and NIRS hemodynamic responses to motor stimuli in adult humans. Neuroimage. 2006;29:368–382. doi: 10.1016/j.neuroimage.2005.08.065. [DOI] [PMC free article] [PubMed] [Google Scholar]
- Iadecola C, Nedergaard M. Glial regulation of the cerebral microvasculature. Nat Neurosci. 2007;10:1369–1376. doi: 10.1038/nn2003. [DOI] [PubMed] [Google Scholar]
- Jenkins BG, Sanchez-Pernaute R, Brownell AL, Chen YC, Isacson O. Mapping dopamine function in primates using pharmacologic magnetic resonance imaging. J Neurosci. 2004;24:9553–9560. doi: 10.1523/JNEUROSCI.1558-04.2004. [DOI] [PMC free article] [PubMed] [Google Scholar]
- Jezzard P, Buxton RB. The clinical potential of functional magnetic resonance imaging. J Magn Reson Imaging. 2006;23:787–793. doi: 10.1002/jmri.20581. [DOI] [PubMed] [Google Scholar]
- Josephson L, Groman EV, Menz E, Luis JM, Bengele H. A Functionalized Superparamagnetic Iron Oxide Colloid as a Receptor Directed MR Contrast Agent. Magn Reson Imag. 1990;8:637. doi: 10.1016/0730-725x(90)90143-p. [DOI] [PubMed] [Google Scholar]
- Kennan RP, Scanley BE, Innis RB, Gore JC. Physiological basis for BOLD MR signal changes due to neuronal stimulation: separation of blood volume and magnetic susceptibility effects. Magn Reson Med. 1998;40:840–846. doi: 10.1002/mrm.1910400609. [DOI] [PubMed] [Google Scholar]
- Kida I, Rothman DL, Hyder F. Dynamics of changes in blood flow, volume, and oxygenation: implications for dynamic functional magnetic resonance imaging calibration. J Cereb Blood Flow Metab. 2007;27:690–696. doi: 10.1038/sj.jcbfm.9600409. [DOI] [PMC free article] [PubMed] [Google Scholar]
- Kim T, Kim SG. Temporal dynamics and spatial specificity of arterial and venous blood volume changes during visual stimulation: implication for BOLD quantification. J Cereb Blood Flow Metab. 2011;31:1211–1222. doi: 10.1038/jcbfm.2010.226. [DOI] [PMC free article] [PubMed] [Google Scholar]
- Kohl M, Lindauer U, Royl G, Kuhl M, Gold L, Villringer A, Dirnagl U. Physical model for the spectroscopic analysis of cortical intrinsic optical signals. Phys Med Biol. 2000;45:3749–3764. doi: 10.1088/0031-9155/45/12/317. [DOI] [PubMed] [Google Scholar]
- Kong Y, Zheng Y, Johnston D, Martindale J, Jones M, Billings S, Mayhew J. A model of the dynamic relationship between blood flow and volume changes during brain activation. J Cereb Blood Flow Metab. 2004;24:1382–1392. doi: 10.1097/01.WCB.0000141500.74439.53. [DOI] [PubMed] [Google Scholar]
- Kwong KK, Belliveau JW, Chesler DA, Goldberg IE, Weisskoff RM, Poncelet BP, Kennedy DN, Hoppel BE, Cohen MS, Turner R, Cheng H-M, Brady TJ, Rosen BR. Dynamic magnetic resonance imaging of human brain activity during primary sensory stimulation. Proc Natl Acad Sci USA. 1992;89:5675–5679. doi: 10.1073/pnas.89.12.5675. [DOI] [PMC free article] [PubMed] [Google Scholar]
- Leite FP, Mandeville JB. Characterization of event-related designs using BOLD and IRON fMRI. Neuroimage. 2006;29:901–909. doi: 10.1016/j.neuroimage.2005.08.022. [DOI] [PubMed] [Google Scholar]
- Leite FP, Tsao D, Vanduffel W, Fize D, Sasaki Y, Wald LL, Dale AM, Kwong KK, Orban GA, Rosen BR, Tootell RB, Mandeville JB. Repeated fMRI Using Iron Oxide Contrast Agent in Awake, Behaving Macaques at 3 Tesla. Neuroimage. 2002;16:283–294. doi: 10.1006/nimg.2002.1110. [DOI] [PubMed] [Google Scholar]
- Leontiev O, Dubowitz DJ, Buxton RB. CBF/CMRO2 coupling measured with calibrated BOLD fMRI: sources of bias. Neuroimage. 2007;36:1110–1122. doi: 10.1016/j.neuroimage.2006.12.034. [DOI] [PMC free article] [PubMed] [Google Scholar]
- Lindauer U, Royl G, Leithner C, Kuhl M, Gold L, Gethmann J, Kohl-Bareis M, Villringer A, Dirnagl U. No evidence for early decrease in blood oxygenation in rat whisker cortex in response to functional activation. Neuroimage. 2001;13:988–1001. doi: 10.1006/nimg.2000.0709. [DOI] [PubMed] [Google Scholar]
- Lu H, Golay X, Pekar JJ, Van Zijl PC. Functional magnetic resonance imaging based on changes in vascular space occupancy. Magn Reson Med. 2003;50:263–274. doi: 10.1002/mrm.10519. [DOI] [PubMed] [Google Scholar]
- Lu H, Golay X, Pekar JJ, Van Zijl PC. Sustained poststimulus elevation in cerebral oxygen utilization after vascular recovery. J Cereb Blood Flow Metab. 2004;24:764–770. doi: 10.1097/01.WCB.0000124322.60992.5C. [DOI] [PubMed] [Google Scholar]
- Lu H, Scholl CA, Zuo Y, Stein EA, Yang Y. Quantifying the blood oxygenation level dependent effect in cerebral blood volume-weighted functional MRI at 9.4T. Magn Reson Med. 2007;58:616–621. doi: 10.1002/mrm.21354. [DOI] [PubMed] [Google Scholar]
- Lu H, Soltysik DA, Ward BD, Hyde JS. Temporal evolution of the CBV-fMRI signal to rat whisker stimulation of variable duration and intensity: a linearity analysis. Neuroimage. 2005;26:432–440. doi: 10.1016/j.neuroimage.2005.02.016. [DOI] [PubMed] [Google Scholar]
- Lu M, Cohen MH, Rieves D, Pazdur R. FDA report: Ferumoxytol for intravenous iron therapy in adult patients with chronic kidney disease. Am J Hematol. 2010;85:315–319. doi: 10.1002/ajh.21656. [DOI] [PubMed] [Google Scholar]
- Mandeville JB, Choi JK, Jarraya B, Rosen BR, Jenkins BG, Vanduffel W. FMRI of cocaine self-administration in macaques reveals functional inhibition of basal ganglia. Neuropsychopharmacology. 2011;36:1187–1198. doi: 10.1038/npp.2011.1. [DOI] [PMC free article] [PubMed] [Google Scholar]
- Mandeville JB, Jenkins BG, Chen YC, Choi JK, Kim YR, Belen D, Liu C, Kosofsky BE, Marota JJ. Exogenous contrast agent improves sensitivity of gradient-echo functional magnetic resonance imaging at 9.4 T. Magn Reson Med. 2004;52:1272–1281. doi: 10.1002/mrm.20278. [DOI] [PubMed] [Google Scholar]
- Mandeville JB, Jenkins BG, Kosofsky BE, Moskowitz MA, Rosen BR, Marota JJA. Regional Sensitivity and Coupling of BOLD and CBV Changes during Stimulation of Rat Brain. Magn Reson Med. 2001;45:443–447. doi: 10.1002/1522-2594(200103)45:3<443::aid-mrm1058>3.0.co;2-3. [DOI] [PubMed] [Google Scholar]
- Mandeville JB, Leite FP, Marota JJ. Spin-echo MRI underestimates functional changes in microvascular cerebral blood plasma volume using exogenous contrast agent. Magn Reson Med. 2007a;58:769–776. doi: 10.1002/mrm.21380. [DOI] [PubMed] [Google Scholar]
- Mandeville JB, Liu C, Marota JJA. Spin Echoes Underestimate Functional Changes in Microvascular Cerebral Blood Volume. Proceedings of the Int Soc Magn Reson Med, Berlin. 2007b:770. doi: 10.1002/mrm.21380. [DOI] [PubMed] [Google Scholar]
- Mandeville JB, Marota JJA. Vascular Filters of Functional MRI: Spatial Localization using BOLD and CBV Contrast. Magn Reson Med. 1999;42:591–598. doi: 10.1002/(sici)1522-2594(199909)42:3<591::aid-mrm23>3.0.co;2-8. [DOI] [PubMed] [Google Scholar]
- Mandeville JB, Marota JJA, Ayata C, Moskowitz MA, Weisskoff RM, Rosen BR. An MRI Measurement of the Temporal Evolution of Relative CMRO2 During Rat Forepaw Stimulation. Magn Reson Med. 1999a;42:944–951. doi: 10.1002/(sici)1522-2594(199911)42:5<944::aid-mrm15>3.0.co;2-w. [DOI] [PubMed] [Google Scholar]
- Mandeville JB, Marota JJA, Ayata C, Zaharchuk G, Moskowitz MA, Rosen BR, Weisskoff RM. Evidence of a Cerebrovascular Post-arteriole Windkessel with Delayed Compliance. J Cereb Blood Flow Metab. 1999b;19:679–689. doi: 10.1097/00004647-199906000-00012. [DOI] [PubMed] [Google Scholar]
- Mandeville JB, Marota JJA, Kosofsky BE, Keltner JR, Weissleder R, Rosen BR, Weisskoff RM. Dynamic Functional Imaging of Relative Cerebral Blood Volume During Rat Forepaw Stimulation. Magn Reson Med. 1998;39:615–624. doi: 10.1002/mrm.1910390415. [DOI] [PubMed] [Google Scholar]
- Mandeville JB, Marota JJA, Weisskoff RM, Rosen BR. An NMR Methodology for Measuring Changes in CMRO2 During Functional Challenge. Proceedings of the Int Soc Magn Reson Med, Fifth Annual Meeting; Vancouver, BC, Canada. 1997. p. 155. [Google Scholar]
- Mandeville JB, Srihasam K, Vanduffel W, Livingston MS. Evaluating Feraheme as a potential contrast agent for clinical IRON fMRI. Proceedings of the Int Soc Magn Reson Med, Stockholm. 2010:1110. [Google Scholar]
- Marota JJA, Ayata C, Moskowitz MA, Weisskoff RM, Rosen BR, Mandeville JB. Investigation of the Early Response to Rat Forepaw Stimulation. Magn Reson Med. 1999;41:247–252. doi: 10.1002/(sici)1522-2594(199902)41:2<247::aid-mrm6>3.0.co;2-u. [DOI] [PubMed] [Google Scholar]
- Ogawa S, Lee RM, Barrere B. The Sensitivity of Magnetic Resonance Image Signals of a Rat Brain to Changes in the Cerebral Venous Blood Oxygenation. Magn Reson Med. 1993;29:205–210. doi: 10.1002/mrm.1910290208. [DOI] [PubMed] [Google Scholar]
- Ogawa S, Tank DW, Menon R, Ellermann JM, Kim SG, Merkle H, Ugurbil K. Intrinsic signal changes accompanying sensory stimulation: functional brain mapping with magnetic resonance imaging. Proc Natl Acad Sci U S A. 1992;89:5951–5955. doi: 10.1073/pnas.89.13.5951. [DOI] [PMC free article] [PubMed] [Google Scholar]
- Polimeni JR, Fischl B, Greve DN, Wald LL. Laminar analysis of 7T BOLD using an imposed spatial activation pattern in human V1. Neuroimage. 2010;52:1334–1346. doi: 10.1016/j.neuroimage.2010.05.005. [DOI] [PMC free article] [PubMed] [Google Scholar]
- Porciuncula CI, Armstrong JGG, Guyton AC, Stone HL. Delayed compliance in external jugular vein of the dog. Am J Phsiol. 1964;207:728–732. doi: 10.1152/ajplegacy.1964.207.3.728. [DOI] [PubMed] [Google Scholar]
- Rosen BR, Belliveau JW, Chien D. Perfusion imaging by nuclear magnetic resonance. Magn Reson Quart. 1989;5:263–281. [PubMed] [Google Scholar]
- Scouten A, Constable RT. Applications and limitations of whole-brain MAGIC VASO functional imaging. Magn Reson Med. 2007;58:306–315. doi: 10.1002/mrm.21273. [DOI] [PMC free article] [PubMed] [Google Scholar]
- Scouten A, Constable RT. VASO-based calculations of CBV change: accounting for the dynamic CSF volume. Magn Reson Med. 2008;59:308–315. doi: 10.1002/mrm.21427. [DOI] [PMC free article] [PubMed] [Google Scholar]
- Siegel AM, Culver JP, Mandeville JB, Boas DA. Temporal comparison of functional brain imaging with diffuse optical tomography and fMRI during rat forepaw stimulation. Phys Med Biol. 2003;48:1391–1403. doi: 10.1088/0031-9155/48/10/311. [DOI] [PubMed] [Google Scholar]
- Silva AC, Koretsky AP, Duyn JH. Functional MRI impulse response for BOLD and CBV contrast in rat somatosensory cortex. Magn Reson Med. 2007;57:1110–1118. doi: 10.1002/mrm.21246. [DOI] [PMC free article] [PubMed] [Google Scholar]
- Stefanovic B, Pike GB. Venous refocusing for volume estimation: VERVE functional magnetic resonance imaging. Magn Reson Med. 2005;53:339–347. doi: 10.1002/mrm.20352. [DOI] [PubMed] [Google Scholar]
- Tian P, Teng IC, May LD, Kurz R, Lu K, Scadeng M, Hillman EM, De Crespigny AJ, D'Arceuil HE, Mandeville JB, Marota JJ, Rosen BR, Liu TT, Boas DA, Buxton RB, Dale AM, Devor A. Cortical depth-specific microvascular dilation underlies laminar differences in blood oxygenation level-dependent functional MRI signal. Proc Natl Acad Sci U S A. 2010;107:15246–15251. doi: 10.1073/pnas.1006735107. [DOI] [PMC free article] [PubMed] [Google Scholar]
- Tootell RB, Tsao D, Vanduffel W. Neuroimaging weighs in: humans meet macaques in "primate" visual cortex. J Neurosci. 2003;23:3981–3989. doi: 10.1523/JNEUROSCI.23-10-03981.2003. [DOI] [PMC free article] [PubMed] [Google Scholar]
- Vanduffel W, Fize D, Mandeville JB, Nelissen K, Van Hecke P, Rosen BR, Tootell RBH, Orban GA. Visual Motion Processing Investigated using Contrast-enhanced fMRI in Awake Behaving Monkeys. Neuron. 2001;32:565–577. doi: 10.1016/s0896-6273(01)00502-5. [DOI] [PubMed] [Google Scholar]
- Villringer A, Rosen BR, Belliveau JW, Ackerman JL, Lauffer RB, Buxton RB, Chao Y, Wedeen VJ, Brady TJ. Dynamic imaging with lanthanide chelates in normal brain: Contrast due to magnetic susceptibility effects. Magn Reson Med. 1988;6:164–174. doi: 10.1002/mrm.1910060205. [DOI] [PubMed] [Google Scholar]
- Weissleder R, Elizondo G, Wittenberg K. Ultrasmall superparamagnetic iron oxide. Characterization of a new class of contrast agents for MR imaging. Radiology. 1990;175:489–493. doi: 10.1148/radiology.175.2.2326474. [DOI] [PubMed] [Google Scholar]
- Yablonskiy D, Haacke EM. Theory of NMR Signal Behavior in magnetically inhomogeneous tissues: the static dephasing regime. Magn Reson Med. 1994;32:749–763. doi: 10.1002/mrm.1910320610. [DOI] [PubMed] [Google Scholar]
- Yacoub E, Ugurbil K, Harel N. The spatial dependence of the poststimulus undershoot as revealed by high-resolution BOLD- and CBV-weighted fMRI. J Cereb Blood Flow Metab. 2006;26:634–644. doi: 10.1038/sj.jcbfm.9600239. [DOI] [PubMed] [Google Scholar]
- Zaharchuk G. Theoretical basis of hemodynamic MR imaging techniques to measure cerebral blood volume, cerebral blood flow, and permeability. AJNR Am J Neuroradiol. 2007;28:1850–1858. doi: 10.3174/ajnr.A0831. [DOI] [PMC free article] [PubMed] [Google Scholar]
- Zhao F, Wang P, Hendrich K, Ugurbil K, Kim SG. Cortical layer-dependent BOLD and CBV responses measured by spin-echo and gradient-echo fMRI: insights into hemodynamic regulation. Neuroimage. 2006;30:1149–1160. doi: 10.1016/j.neuroimage.2005.11.013. [DOI] [PubMed] [Google Scholar]
- Zheng Y, Mayhew J. A time-invariant visco-elastic windkessel model relating blood flow and blood volume. Neuroimage. 2009;47:1371–1380. doi: 10.1016/j.neuroimage.2009.04.022. [DOI] [PMC free article] [PubMed] [Google Scholar]