Abstract

β-Lactam antibiotics have faced obsolescence with the emergence of methicillin-resistant Staphylococcus aureus (MRSA). A complex set of events ensues upon exposure of MRSA to these antibiotics, which culminates in proteolysis of BlaI or MecI, two gene repressors, and results in the induction of resistance. We report studies on the mechanism of binding of these gene repressors to the operator regions by fluorescence anisotropy. Within the range of in vivo concentrations for BlaI and MecI, these proteins interact with their regulatory elements in a reversible manner, as both a monomer and a dimer.
A variant of Staphylococcus aureus that emerged in the early 1960s came to be known as methicillin-resistant S. aureus (MRSA).1 This evolutionary outcome in response to selection for resistance to second-generation penicillins negated the achievements by medicinal chemists in the preceding decade, as resistance to the β-lactam class of antibiotics was and is overencompassing.2
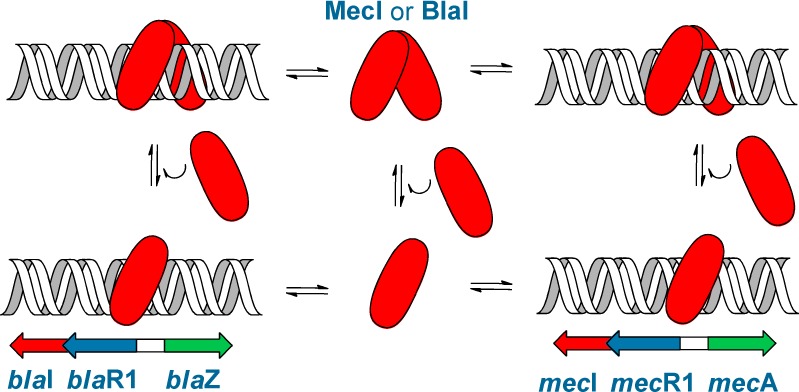
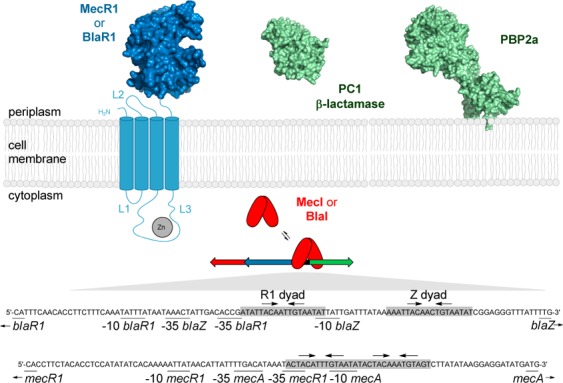
The manifestation of resistance, which is inducible in most strains, is due to two related systems, termed the bla and mec operons (Figure 1).3 Each is comprised of a β-lactam sensor/signal transducer membrane protein (BlaR1 and MecR1 for bla and mec, respectively), whose surface domain binds covalently to the antibiotic.4,5 Binding of the antibiotic leads to transduction of the signal across the membrane, whereby the cytoplasmic zinc-dependent protease domain of BlaR1 or MecR1 is activated.6,7 The membrane-bound protease degrades the respective gene repressor, BlaI or MecI, which regulates transcription of the blaI or mecI gene for the repressor and of the blaR1 or mecR1 gene for the corresponding sensor/transducer protein, respectively.6−8 The two systems also comprise two additional genes, blaZ and mecA, which encode the antibiotic-resistance determinants, namely, the PC1 β-lactamase and penicillin-binding protein 2a (PBP2a), respectively. The PC1 β-lactamase hydrolyzes the β-lactam ring of these antibiotics, hence rendering them ineffective. On the other hand, PBP2a is a unique cell-wall cross-linking dd-transpeptidase (the target for β-lactam antibiotics), which is impervious to inhibition by these antibiotics. The molecular basis for this dichotomy of function for the enablement of PBP2a for its physiological function and for evasion from inhibition by β-lactam antibiotics has recently been elucidated.9
Figure 1.

Transcription of the genes for antibiotic-resistance determinants PBP2a and PC1 β-lactamase is regulated by MecI and BlaI. Red, blue, and green arrows represent the blaI/mecI, blaR1/mecR1, and blaZ/mecA genes, respectively. The gene repressor binding sites in each operon are highlighted in gray.
Our survey of the known genomes of MRSA strains (Supporting Information) has revealed that the strains that have MecI also have MecR1. MecR1 may exist in the absence of MecI, in which case mecA transcription is either constitutive (in the absence of the bla operon) or, conversely, regulated by the bla operon, if it were to be present. These findings are also supported by complementation studies that documented that MecI- or BlaI-mediated mecA transcription repression could be lifted by induction through homologous, but not heterologous, sensor proteins.10,11 Hence, the two systems exhibit corepression, but not co-induction. In this report, we disclose our investigation of the interactions of the MecI and BlaI repressor proteins with the mec and bla operons. The mechanism of DNA binding is complex, involving both the monomeric and dimeric forms of the repressor proteins, for which we report the dissociation constants. Binding by both these species would appear to be relevant at the in vivo concentrations that we have evaluated for the repressors.
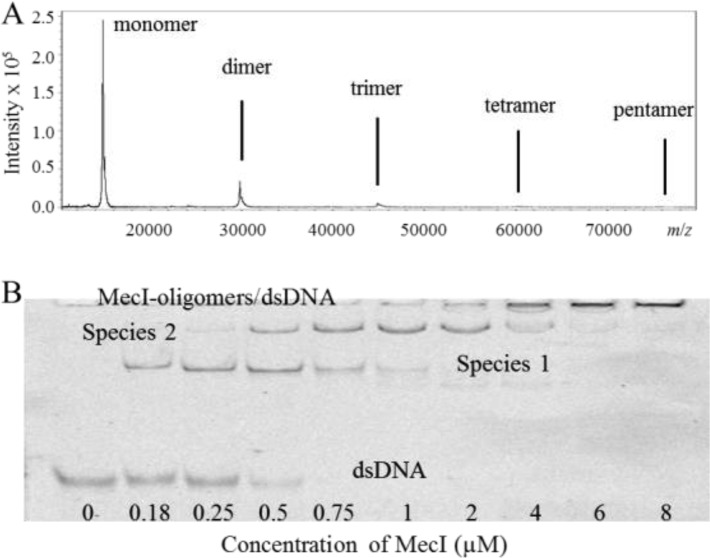
We amplified the mecI gene from S. aureus NRS70 (N315) by polymerase chain reaction and cloned it in plasmid pET-24a(+), which was used to transform Escherichia coli OverExpress C41(DE3). The MecI protein was expressed and purified to homogeneity (Supporting Information). The BlaI protein was also purified to homogeneity by the method that was described previously.12 We had documented previously that the BlaI repressor exists as both monomeric and dimeric species in solution.12 Purified MecI exhibits the ability to oligomerize (Figure 2A). We were able to detect distinct species from monomer to pentamer in a 12 μM solution of MecI by matrix-assisted laser desorption ionization (MALDI) mass spectrometry. In the presence of DNA, we also detected the complexes with the monomer and dimer of MecI. Even at this high concentration, the monomer and dimer appear to dominate the mixture (Figure 2A). Clearly, the potential relevance of the higher-order oligomers under physiological conditions depends on the solution concentration of MecI in vivo, to which we will return shortly.
Figure 2.
(A) MALDI mass spectrum of MecI at 12 μM. (B) Electrophoresis mobility shift assay of mec double-stranded DNA (150 nM) in the presence of increasing concentrations of MecI.
Nonetheless, to gain insight into the nature of MecI in solution, we conducted sedimentation velocity and sedimentation equilibrium assays. The average molecular mass of MecI, calculated within the concentration range of 0.5–36 μM, revealed the existence of a monomer–dimer equilibrium with a dissociation constant of 0.30 ± 0.03 μM. The details of these experiments are given in the Supporting Information.
The bla operator consists of a 61 bp stretch with two binding sites designated as the R1 and Z dyads. Each of these dyads is an 18 bp palindrome separated by a 13 bp linker (Figure 1).13 The mec operator is shorter, consisting of a 43 bp sequence with a single 30 bp palindrome with two 15 bp half-sites, with 12 bp dyad symmetry within each half-site.14,10 To characterize the interactions of MecI with the mec and bla operator regions by electrophoretic mobility shift assays (EMSAs) and by fluorescence anisotropy assays, two fluorescein-labeled double-stranded DNA samples were prepared, each containing one of the operator regions (Supporting Information). The concentration of the mec double-stranded DNA (dsDNA) was kept constant (150 nM) in the EMSA, and the concentration of MecI was changed (Figure 2B). A transition to species 1 was noted at lower MecI concentrations, followed by the formation of species 2 at higher concentrations. Species 2 was the predominant one at 2 μM MecI, but at higher concentrations, oligomeric complexes of MecI and DNA accumulated, which did not move out of the well in the electrophoretic cell. An EMSA for MecI protein with bla dsDNA and for BlaI protein with mec and bla dsDNA segments also showed two species, in addition to higher-order oligomer–dsDNA complexes that remained trapped in the well (Supporting Information). On the basis of these results and the previously reported equilibria for binding of BlaI to the bla dsDNA,12 we propose that species 1 and 2 correspond to monomer–dsDNA and dimer–dsDNA complexes, respectively. We also note that the transition between species 1 and 2 straddles the dissociation constant for the MecI dimer of 0.30 ± 0.03 μM (Figure 2B).
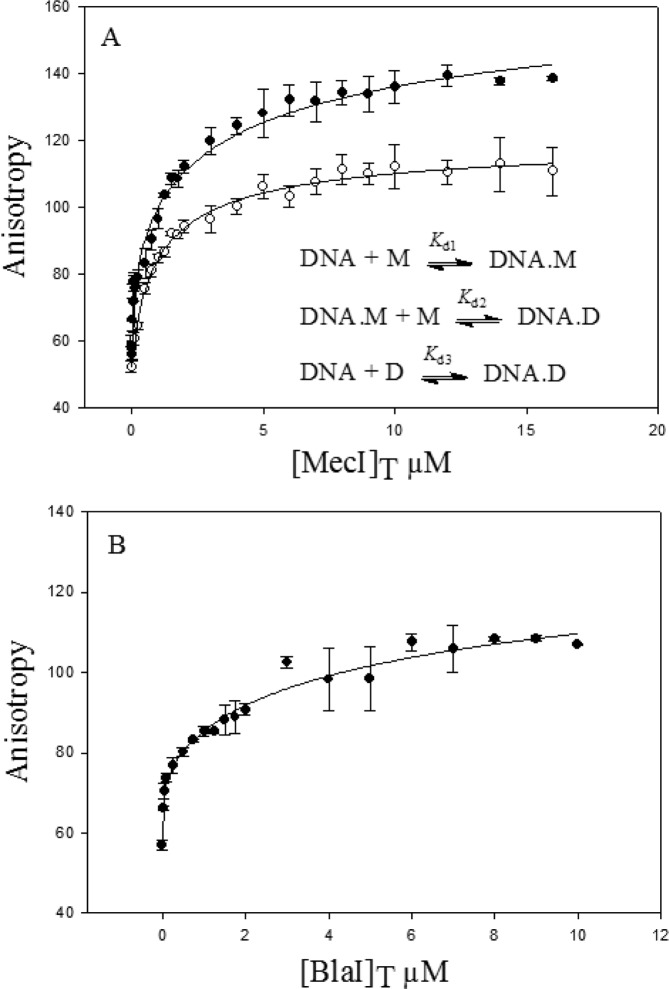
We studied binding of the MecI protein to the operator regions of the mec and bla operons by fluorescence anisotropy. Anisotropy data were fit using equations for seven distinct models of binding.12 The best fit for binding of MecI to the bla operator region (Figure 3A) was achieved with the equations derived for the model described in the inset of Figure 3A (see the Supporting Information for equations), which accounted for sequential binding of two MecI monomers (Kd1 = 0.3 ± 0.1 μM, and Kd2 = 0.3 ± 0.1 μM) and for binding of the MecI dimer to the DNA (Kd3 = 0.4 ± 0.2 μM) (Table 1). Similarly, for the case of binding of MecI to the mec operator region, the best fit was obtained with the same model [Kd1 < 0.01 μM; Kd2 = 0.67 ± 0.02 μM; Kd3 < 0.03 μM (Figure 3A and Table 1)]. These data correlated with the mass spectrometry data and with the sedimentation equilibrium data that revealed that both the monomer and dimer of MecI were present in solution. We add that our previous evaluation of binding of BlaI to the operator region of the bla operon was also consistent with this model. Here we also show that the same model accounted for binding of BlaI to the mec operator region (Figure 3B and Table 1). Hence, the four sets of interactions that are outlined for the two proteins with the two operators are similar to each other, as indeed the systems are kin from an evolutionary perspective (Table 1). However, there are some subtle differences as MecI and BlaI monomers and dimers bind tighter to the mec operator region. The predominant DNA complex is the one with the monomer in the case of BlaI, while the amount of the dimer–DNA complex equals or exceeds the amount of the monomer complex for MecI, in the higher range of in vivo protein concentrations (Supporting Information).
Figure 3.
Fluorescence anisotropy measurements for (A) binding of MecI to the mec (●) and bla (○) operators and (B) binding of BlaI to the mec operator (●). The lines show the fit to the model given as the inset of panel A.
Table 1. Dissociation Constants for Binding of MecI or BlaI to the mec or bla Operatora.
| dsDNA | Kd1 (μM) | Kd2 (μM) | Kd3 (μM) | |
|---|---|---|---|---|
| MecI | mec | <0.01 | 0.67 ± 0.02 | <0.03 |
| bla | 0.3 ± 0.1 | 0.3 ± 0.1 | 0.4 ± 0.2 | |
| BlaI | mec | 0.013 ± 0.006 | 2.8 ± 0.1 | <0.04 |
| blab | 0.45 ± 0.07 | 2.6 ± 0.1 | 0.72 ± 0.07 |
Kd1 and Kd2 define dissociation of the monomer from the monomer–DNA and dimer–DNA complexes, respectively, and Kd3 is for dissociation of the dimer from the dimer–DNA complex.
Data from ref (12).
To assess the relevance of these dissociation constants to the case of living bacteria, we evaluated the concentrations of MecI in S. aureus strains NRS70 and MRSA252. The analysis was performed by Western blotting, and the concentration of MecI was estimated with a standard curve prepared with purified MecI (Supporting Information). The cytoplasmic concentrations of MecI in S. aureus MRSA252 were estimated to be approximately 0.6–1.6 μM at the exponential phase of growth and 1.1–3.0 μM in the stationary phase. On the other hand, S. aureus NRS70 gave lower levels of MecI (<0.2 μM in the stationary phase). Incidentally, we have determined (Supporting Information) that our anti-BlaI and anti-MecI antibodies do not have cross-reactivities between the MecI and BlaI proteins, notwithstanding their similarities in sequence and structure. These in vivo concentrations indicate that the full set of events of the DNA binding model are relevant for S. aureus strain MRSA252, but the contribution of MecI to the repression of genes in strain NRS70 is dominated by monomer binding.
The data of Table 1 indicate that in the cases of binding of MecI to the mec operator and binding of BlaI to either the mec or bla operator, monomer binding (Kd1) dominates, followed by that of the dimer (Kd3). The second step in sequential monomer binding (Kd2) cannot occur, except at much higher repressor concentrations. All three binding events would appear to compete with one another in the case of binding of MecI to the bla operator, so this scenario is distinct.
How does S. aureus recover from mobilization in response to the antibiotic? First, the activated BlaR1 or MecR1 should return to its unactivated form. Because the ester linkage of the sensor domain with the antibiotic enjoys considerable longevity,15 nature resorted to proteolytic turnover of these proteins, which is initiated by an autolytic process in the case of BlaR1.6−8 This allows for the buildup of the concentration of the gene repressor(s), which slows transcription of the genes in the operon. The transcriptional events cannot be shut down entirely, as a basal level is needed to replenish proteins that are turned over regularly as vanguards against future contact with antibiotics. Given the concentration of the operator, that of MecI in vivo, and the DNA dissociation constants reported herein, our analysis reveals that 1–4% of the operator molecules in a S. aureus culture would be uncomplexed and would experience transcription in the absence of an antibiotic (Supporting Information). A similar analysis for binding of BlaI to the mec operator gives 0.7–2.4% uncomplexed DNA. Because we deal with a single chromosomal copy in the case of the mec operon and a few in the case of the plasmid-borne bla operon, one needs to consider populations of bacteria in this analysis and not a single microorganism. As such, a basal level of transcription will take place incrementally in an entire population of S. aureus upon removal of the challenge by the β-lactam antibiotic, to allow for the return to demobilization of resources in the antibiotic.
Supporting Information Available
Experimental procedures for MecI and BlaI (cloning and purification), MecI ultracentrifugation experiments (sedimentation velocity and sedimentation equilibrium), MecI quantification in S. aureus cells, fluorescence anisotropy experiments, and simulation of species. This material is available free of charge via the Internet at http://pubs.acs.org.
Author Contributions
B. Blázquez and L. I. Llarrull contributed equally to this work.
This work was supported by National Institutes of Health Grant AI104987 and by postdoctoral fellowships from the Fundación Española para la Ciencia y la Tecnología and Ministerio de Educación, Cultura y Deporte (to B. Blázquez).
The authors declare no competing financial interests.
Funding Statement
National Institutes of Health, United States
Supplementary Material
References
- Jevons M. P. (1961) Br. Med. J. 124–125. [Google Scholar]
- Llarrull L. I.; Fisher J. F.; Mobashery S. (2009) Antimicrob. Agents Chemother. 53, 4051–4063. [DOI] [PMC free article] [PubMed] [Google Scholar]
- Clarke S. R.; Dyke K. G. (2001) J. Antimicrob. Chemother. 47, 377–389. [DOI] [PubMed] [Google Scholar]
- Thumanu K.; Cha Y.; Fisher J. F.; Perrins R.; Mobashery S.; Wharton C. (2006) Proc. Natl. Acad. Sci. U.S.A. 103, 10630–10635. [DOI] [PMC free article] [PubMed] [Google Scholar]
- Cha J.; Vakulenko S. B.; Mobashery S. (2007) Biochemistry 46, 7822–7831. [DOI] [PubMed] [Google Scholar]
- Zhang H. Z.; Hackbarth C. J.; Chansky K. M.; Chambers H. F. (2001) Science 291, 1962–1965. [DOI] [PubMed] [Google Scholar]
- Llarrull L. I.; Mobashery S. (2012) Biochemistry 51, 4642–4649. [DOI] [PMC free article] [PubMed] [Google Scholar]
- Llarrull L. I.; Toth M.; Champion M. M.; Mobashery S. (2011) J. Biol. Chem. 286, 38148–38158. [DOI] [PMC free article] [PubMed] [Google Scholar]
- Otero L. H.; Rojas-Altuve A.; Llarrull L. I.; Carrasco-López C.; Kumarasiri M.; Lastochkin E.; Fishovitz J.; Dawley M.; Hesek D.; Lee M.; Johnson J. W.; Fisher J. F.; Chang M.; Mobashery S.; Hermoso J. A. (2013) Proc. Natl. Acad. Sci. U.S.A. 110, 16808–16813. [DOI] [PMC free article] [PubMed] [Google Scholar]
- McKinney T. K.; Sharma V. K.; Craig W. A.; Archer G. L. (2001) J. Bacteriol. 183, 6862–6868. [DOI] [PMC free article] [PubMed] [Google Scholar]
- Ryffel C.; Kayser F. H.; Berger-Bächi B. (1992) Antimicrob. Agents Chemother. 36, 25–31. [DOI] [PMC free article] [PubMed] [Google Scholar]
- Llarrull L. I.; Prorok M.; Mobashery S. (2010) Biochemistry 49, 7975–7977. [DOI] [PMC free article] [PubMed] [Google Scholar]
- Gregory P. D.; Lewis R. A.; Curnock S. P.; Dyke K. G. (1997) Mol. Microbiol. 24, 1025–1037. [DOI] [PubMed] [Google Scholar]
- Safo M. K.; Ko T. P.; Musayev F. N.; Zhao Q.; Wang A. H.; Archer G. L. (2006) Acta Crystallogr. F62, 320–324. [DOI] [PMC free article] [PubMed] [Google Scholar]
- Golemi-Kotra D.; Cha J. Y.; Meroueh S. O.; Vakulenko S. B.; Mobashery S. (2003) J. Biol. Chem. 278, 18419–18425. [DOI] [PubMed] [Google Scholar]
Associated Data
This section collects any data citations, data availability statements, or supplementary materials included in this article.


