

Abstract
Pharmacology is currently transformed by the vast amounts of genome-associated information available for system-level interpretation. Here I review the potential of systems biology to facilitate this interpretation, thus paving the way for the emerging field of systems pharmacology. In particular, I will show how gene regulatory and metabolic networks can serve as a framework for interpreting high throughput data and as an interface to detailed dynamical models. In addition to the established connectivity analyses of effective networks, I suggest here to also analyze higher order architectural properties of effective networks.
Keywords: biological networks, mathematical modeling, nonlinear dynamics
Introduction
In their seminal paper on ‘network medicine’ Barabási et al. argue that ‘[g]iven the functional interdependencies between the molecular components in a human cell, a disease is rarely a consequence of an abnormality in a single gene, but reflects the perturbations of the complex intracellular and intercellular network[.]’ 1. Systems biology attempts to incorporate this systemic view into its modelling and data analysis endeavours. In its simplest form, systems biology is the systemic contextualization of large numbers of individual observations. At the core of systems thinking in biology is the concept of networks. In particular, the notion of diseases as coherent network states that can, in principle, be destabilized and transferred into healthy coherent network states is currently challenging our conventional perspective on diseases 1–4. The sections ‘Network-based data analysis and the concept of effective networks’ and ‘A brief primer on network architecture’ focus on the general idea of biological network concepts, as well as their main architectural parameters.
The main data sources for pharamacogenomics, which can be incorporated into such a view, are genome-wide association studies (GWAS), transcriptome profiles and, particularly on the way towards pharmacoepigenetics, methylation profiles. Individual differences in DNA sequence are the genetic basis of human variability. In particular, single-nucleotide polymorphisms (SNPs) are the most abundant form of DNA variation in the human genome (see, for example, 5). SNPs are the basic unit of GWAS data. However, any such ‘genome-wide data mining’ is complicated due to the large inherent complexity of these networks 6.
Modelling in systems biology has contributed (and is still making progress towards) high level concepts allowing us to view diseases as coherent states of a system, which can be transformed into alternative coherent states, very much in the spirit of coexisting stable fixed points with their respective basin of attraction and their alterations in stability upon parameter variation (bifurcations). But modeling has also contributed a set of specific models (for metabolic systems, individual signalling pathways, important building blocks or 'motifs' of regulation, etc.). An important trend is to estimate the (often very numerous) parameters of these models from high throughput data of individual patients and then use this ‘individualized model’ to predict disease progression and treatment responses for individual patients (see, for example, 7,8). This aspect will be briefly explored in ‘Outlook 1: some of the next challenges in systems biology’.
Beyond the standard networks considered in systems biology (gene regulatory networks, metabolic networks, signalling networks and protein–protein interaction networks), in which each link corresponds to a specific biological process, several relational networks have been explored in the past years, which are capable of serving as very efficient sources of information for pharmacogenomics: the diseasome, a network where a disease (node type 1) is linked to a gene (node type 2), when there is data evidence relating the gene to the disease 2,9 and the drug–target network, where drugs and proteins linked by drug-target associations 10.
Such networks consisting of two types of nodes are called ‘bipartite networks’. Frequently, they serve as a starting point for considering projections to single types of nodes. These projections are very powerful in revealing unexpected relationships among nodes (see, for example, 1).
How can the network perspective facilitate the interpratation of GWAS data (as well as high throughput data from other sources)? It has been pointed out that most SNPs discovered via GWAS have small effects on disease susceptibility and thus may not be suitable for improving health care through genetic testing (see, for example, 11). Further, the linear modelling framework that is employed in GWAS often considers only one SNP at a time thus ignoring their genomic and environmental context and the network perspective. Precisely due to the enormous successes of network approaches, there is now a shift away from the purely biostatistical approaches towards GWAS data to a more holistic approach that recognizes the complexity of the genotype–phenotype relationships, as well as gene–gene and gene–environment interactions (see 12 for details).
An example of a complex multifactorial disease is amyotrophic lateral sclerosis (ALS). Several tens of genes have been associated with the disease and no clear ‘big picture’ of involved pathways etc. emerges from the available high throughput data, leading to the assumption of multiple rare variants 13. The challenge of interpreting high throughput data in a situation of complex, multifactorial, rare diseases is enormous. Employing individually tuned mathematical models as virtual patient representations may constitute an important step forward in personalized medicine. Pharmacogenomics could in this context be a principal driving force paving the way towards personalized medicine.
With suitable methods emerging for a whole genome assessment of genetic variants, e.g. of treatment responders against treatment non-responders (in particular with GWAS), drug efficiency and other relevant parameters could be related to genetic variants (see, for example, 14). In particular, the interplay of environment and genetic variants affecting drug efficiency can be explored with the most recent variants of metabolic flux models (e.g. 15,16).
In the following I will sketch a set of network-based methods for contextualizing high throughput data (transcriptome profiles, GWAS data, methylation patterns) and facilitating their interpretation.
Network-based data analysis and the concept of effective networks
In addition to simulation and prediction, models from systems biology can also be seen as tools for interpreting high throughput data and thus helping to translate molecular information into clinical application. Given a model prediction of metabolic fluxes, for example, the subset of matching gene expression data can be interpreted as a coherent metabolic state 3,17,18. Furthermore, any gene activity not consistent with the flux prediction will point to errors in the metabolic model, to errors in the data set or to a novel mechanism not accounted for by the current data.
In 3 the analysis strategy described above was developed and applied to transcriptome profiles from patients with aldosterone-producing adenomas of the adrenal gland, revealing two distinct metabolic states in the patient data. Similar approaches of merging flux predictions with gene expression data have been highly successful over the last years in, for example, establishing cell-type specific metabolic models 7,19–21.
Figure 1 illustrates this concept of effective networks derived from static global networks by incorporation of high throughput data. In Figure 2 the association of metabolic networks (and their diverse representations) with different types of high throughput data is further explored. Just as the relational network structures discussed in the introduction, a graph representation of metabolism consists of two types of nodes, metabolites and enzymes (or reactions), thus also forming a bipartite graph. From this graph, two projections to single types of nodes are frequently used – the metabolite-centric graph and the enzyme-centric graph. In the first representation, metabolites are the nodes and a link denotes the involvement of any two (or more) metabolites used by a given enzyme reaction. Distinguishing between substrates and products of an enzyme reaction can provide directed links. In the second representation, enzymes are the nodes and edges indicate shared metabolites between their individual reactions. Due to their gene associations, the enzyme-centric metabolic network can also be represented within the genome. Each of these three representations is an appropriate starting point for deriving effective networks (in the sense of Figure 1) from a specific data type: metabolomics data for a metabolite-centric representation, transcriptome profiles for an enzyme-centric representation and GWAS data for the enzyme-centric graph embedded in the genome.
Figure 1.
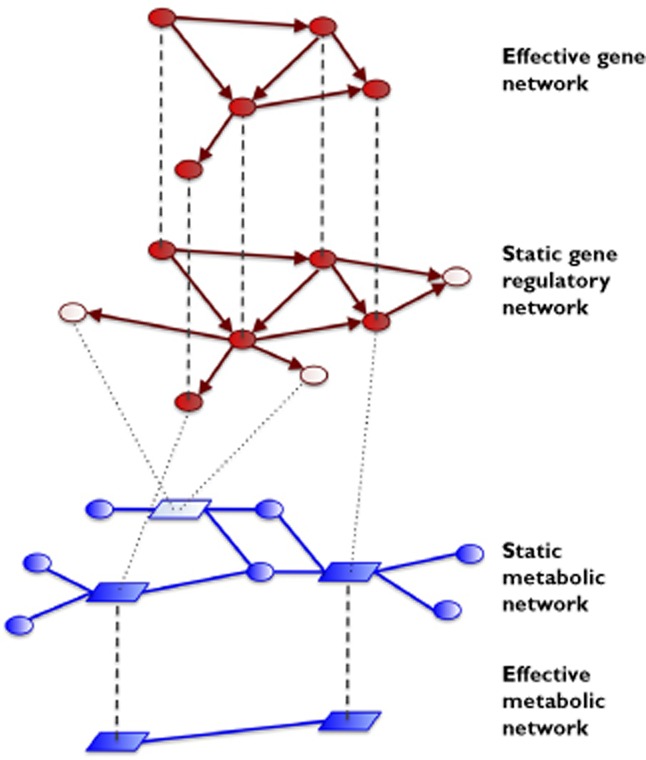
Concept of effective networks. The starting point for an analysis of high throughput data based upon effective networks is given by static global network architectures, both on the level of gene regulation (upper middle network, depicted in red) and on the level of metabolism (lower middle network, depicted in blue), together with the corresponding gene–enzyme associations (dotted lines). High throughput data (e.g. transcriptome profiles or GWAS data) are then translated into a set of ‘flags’ for a subset of genes. Genes highlighted in this way (depicted in dark red), together with their interactions, form the effective gene network. All enzymes associated with ‘flagged’ genes, together with their metabolic interactions, form the effective metabolic network. The statistical properties of these effective networks are highly informative about the mechanisms underlying the data. Qualitatively speaking, the effective networks measure the part of the data compatible with the network architecture at hand.  , gene;
  , highlighted gene;
  , enzyme;
  , highlighted enzyme;
  , metabolite;
  , regulation;
  , gene–enzyme association;
  , metabolic reaction (metabolite–enzyme link).
Figure 2.
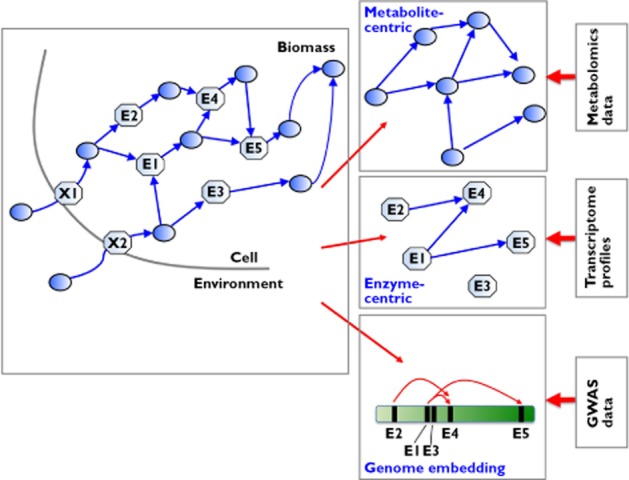
Metabolic networks as bipartite graphs (schematic representation), together with their projections and suitable representations for the interpretation of different data types. (Figure adapted from 58).  , metabolite;
  , enzyme
What is the ‘added value’ of a network perspective? In which way does the interpretation go beyond, for example, enrichment analysis of gene ontology (GO) terms or clustering analyses? The benefit of network-based analyses is on two levels, a practical, methodological level and a conceptual, systems-theory level. I will first address the practical level. The network perspective allows asking questions about the higher order relationship between data points: How many shortest paths among nodes pass through a particular node of the network? Does this ‘topological centrality’ correlate with biological significance? How many links are found among neighbors of a node? Is this ‘clustering’ unexpectedly high? Does a group of data points also form a group from the perspective of network architecture? Are there other such ‘topological modules’?
In the next section such network properties particularly important for a network-driven data analysis will be discussed in more detail. Currently the gap between network-based data analysis and such ‘higher order network properties’ (beyond the total number of links, the connectivity and the distribution of neighborhood sizes, the degree distribution) is still enormous. With the following ‘primer’ on network architecture I want to suggest additional candidates for a detailed analysis of the effective networks discussed above.
The conceptual benefit of a network perspective is in the unifying view of seeing high throughput data as coherent states of a biological network. This will be further discussed in the section ‘Outlook II: High throughput data as coherent network states’.
A brief primer on network architecture
General background
The most famous and widely discussed network property is the degree distribution P(k), counting the percentage of nodes in the network with exactly k neighbours. Over the last 14 years the observation that many biological networks have a very broad distribution of node degrees has been explored from diverse angles and associated with potential evolutionary ‘construction rules’ (e.g. preferential attachment) and with functional requirements (e.g. tolerance against random failures). In 22 details of these approaches are given.
How is a broad degree distribution relevant to biology and to a theoretical interpretation of such networks? A network with a degree distribution given by a power law (like the Barabási-Albert (BA) model, which is based on nodes preferentially attaching themselves to nodes with already many links) is called ‘scalefree’, because such networks do not contain a particular scale of reference. There is no typical (e.g. average) degree of a node. The degree is a node property spread over several orders of magnitude. In a scalefree network, the vast majority of nodes only have very few links. At the same time, the network contains nodes, which have several orders of magnitude more links. In metabolism, hubs (highly connected elements) are more conserved across species than low or intermediate degree nodes 23.
Historically, the connectedness of a graph (i.e. the lack of fragmentation) has been a focus of interest, both in theoretical research and in applications. In the famous Erdős-Renyi (ER) model of random graphs, connectedness appears spontaneously, when a critical value of the connectivity is exceeded. This phenomenon is called percolation and is associated with additional topological properties of functional relevance, e.g. the combinatorical explosion of path multiplicities among nodes above (but close to) the percolation threshold and the existence of a giant connected network component below (but close to) the percolation threshold. These properties can still be considered an important driving mechanism behind many functional observations about networks 22. Figure 3 gives examples of these two network types, the ER random graph model, as well as the preferential attachment BA model. Consistent with these two foci of interest, the connectedness and the degree distribution, many studies of effective networks have focused on these architectural parameters (see, for example, 18,24–26. Here I would like to extend the catalogue of network properties, which can be analyzed in effective networks.
Figure 3.
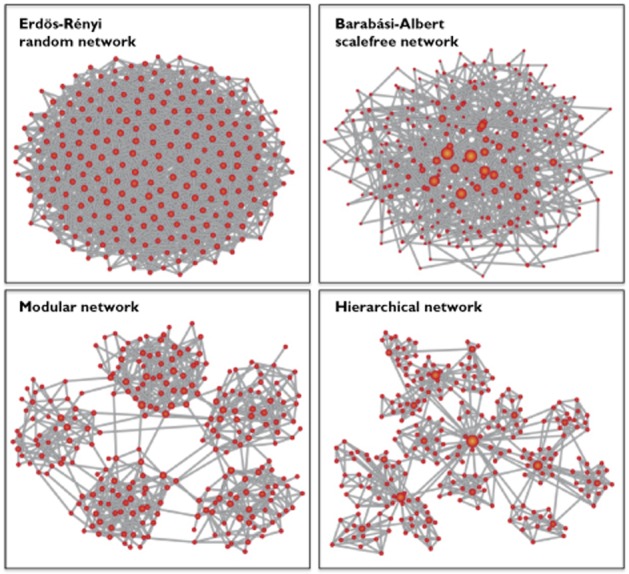
Different types of networks. In each of the examples, the size of a node is depicted proportional to its degree to emphasize the differences between these network types. Erdős-Renyi networks are obtained by randomly (with a probability P) linking each node with each other node. The parameter P regulates the link density (or ‘connectivity’) of the network. The degree distribution of ER networks is a comparatively narrow unimodal distribution around an average degree. Barábasi-Albert (BA) networks are obtained via preferential attachment: nodes are sequentially added to the network with m links; for each of the already present nodes, the probability of receiving one of the m links is proportional to the node's degree (‘the rich get richer’ principle). The degree distribution of BA networks is a power law. In modular networks, dense regions (‘modules’) are sparsely interlinked. In hierarchical networks (see, for example, 22, for details on this specific model of hierarchy) one finds modules within modules, all organized around central hub nodes on each level. (Figure adapted from 56).
In the following, I would like to explore in more detail, how topological properties of effective networks can be informative for the interpretation of pharmacologically relevant high throughput data. Specifically, I would like to discuss the notions of modularity, hierarchy, centrality, network motifs and clustering.
Modularity and hierarchy
Very often biological networks do not possess a homogeneous distribution of links among the nodes. Some groups of nodes have a very large number of links among each other, but these dense regions or modules are sparsely interconnected. Networks with such dense regions are called modular networks. Modularity is a fascinating and important property of many complex networks. It can be at the same time formally defined on the level of the graph, as briefly sketched above (see also 27), as well as due to functional criteria (see, for example, 28). Modularity is also one of the major topological properties known to shape dynamical processes on graphs. The fact that maps of random walks reveal the community structure of complex networks 29,30 is one of the few very clear observations about the interplay between network topology and dynamics. Starting from the influential review article by Hartwell et al. 31, this interplay between network architecture and function has received an enormous amount of attention in biology. One frequent question is whether topological modules (or communities) coincide with functional models. In 31 the analysis of functional modules was discussed as a suitable step from molecular observations to a systems level understanding. Figure 3 shows an example of a modular graph consisting of five (ER graph) modules.
A variant of modularity (at least in one possible definition) is nested modularity or hierarchy, where modules consist of sub-modules, each of which in turn possesses a modular structure and so on. Figure 3 gives an example for a hierarchical network, following the definition discussed in 22.
Centrality
The topological concept behind measures of centrality is very simple: A node in a network is characterized by the proportion of shortest paths from any node to any other node (betweenness centrality). Figure 4 shows a small random (ER) graph, where the size of each node is proportional to its betweenness centrality. Although, frequently the centrality correlates with the degree, these quantities are independent. An interface node between two modules, for example, will have a high centrality (because all shortest paths from any node in the one module to any node in the other module will pass through this node), but it might have a very low degree. Alternatively, a hub in the periphery of the the network will, in spite of its high degree, be visited by comparatively few shortest paths and thus have a low centrality.
Figure 4.
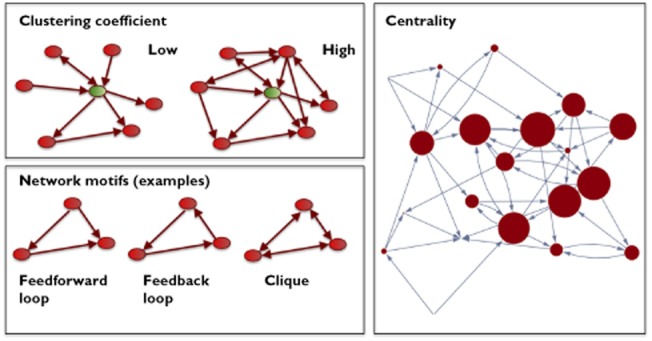
Some classifiers of network architecture
Network motifs and clustering
A hot topic of network research is the functional role of small subgraphs, like feedforward loops, branching points, small cycles and feedback loops. Statistically over-represented subgraphs (compared with randomized graphs), termed ‘network motifs’, have been hypothesized to be device-like building blocks capable of explaining some of the functional properties of complex networks 32.
Figure 4 gives some examples of three subgraphs in directed graphs, which are particularly relevant for biological considerations, namely a feed-forward loop, a feedback loop and a clique. ‘Cliquishness’ or clustering is at the same time a more statistical view on networks, addressing the question, how many links are found among the neighbours of a node. Intuitively, in a social network, where nodes are people and a link indicates friendship, high clustering indicates that a large number of a person's friends are also friends among each other. Formally, the clustering coefficient of a node is given by the number of links among the node's neighbours divided by the maximal number of possible links among these neighbours 33.
Motivated by graph theory and non-linear dynamics, an influential trend of research in systems biology currently attributes properties of biological function to specific regulatory motifs 34,35. Examples include circuits of negative feedback loops 36, interlinked feedback loops acting on different time scales 37, regulatory devices capable of adaptation 38, the composition of a system out of regulatory units 39 and their relation to robustness 40,41 and the number of positive and negative feedback loops in regulatory circuits 42. In order to understand better the validity of the motif perspective for transcriptional regulatory networks, in 43 the interplay between feed-forward loops and larger scale structures (subsets formed by all nodes topologically downstream of a reference node) in gene regulatory networks has been explored. The goal of this analysis has been to study the internal logic of gene regulation by looking at the interplay of two scales within the transcriptional regulatory network of E. coli. It is seen that when one scale dominates (high subnet usage) few regulatory devices on the smaller scale are found (low feed-forward loop occurrence).
Outlook I: some of the next challenges in systems biology
Here I would like to briefly discuss some of the current challenges of systems biology that are of particular relevance to pharmacogenomics and pharmacoepigenetics. The purely statistical forms of GWAS data interpretation (data mining, machine learning) face dramatic computational and bioinformatics challenges due to the fact that more than a million SNPs can be identified in the human genome. Even with ideal data about a patient's genotype (via GWAS data) and dynamical system states (via metabolome and transcriptome profiles), the bioinformatics and systems biology data analysis and interpretation pipelines are not yet established. We lack suitable multiscale modelling methods, as well as efficient and reliable algorithms to estimate vast numbers of (often interdependent) parameters from data.
Figure 5 qualitatively describes an idealized data interpretation pipeline that covers the range from the original data to network states, individualized models and, eventually, to a mechanistic understanding of the relevant biological processes. Starting from genetic variations (and other genotype information) and from ‘snapshots’ of the system's dynamical states, we can resort to available network information on various levels of organization (gene regulatory networks, metabolic networks, signalling networks and protein–protein interaction networks) and derive effective networks, which are a network representation of the static network's coherent state represented by the dynamical data (see the section on ‘Network-based data analysis and the concept of effective networks’). A next step must be to relate these states with predictions from genome-wide models, for example, for (steady-state) metabolic flux patterns. Within the elegant framework of flux-balance analysis 44, the optimal steady-state distribution of metabolic fluxes can be predicted, given the structure of the environment (the availability of nutrients) and the cellular objective function (for example, biomass production or ATP maximization). In the future, patient specific, individualized models will be estimated from high throughput data and, via in silico predictions of treatment responses and disease progression, guide medical and pharmaceutical strategies. In spite of their high dimensionality and their enormous level of detail, ‘template’ models used as starting points for estimating individualized models from data still contain substantial uncertainties, both in model architectures (Which regulatory interactions need to be incorporated? What are suitable system boundaries? etc.) and in the exact forms of non-linearities describing regulations. Here, it is important to construct detailed models from the precise knowledge of the mechanics of the underlying regulations (called ‘dedicated modelling’ in Figure 5).
Figure 5.
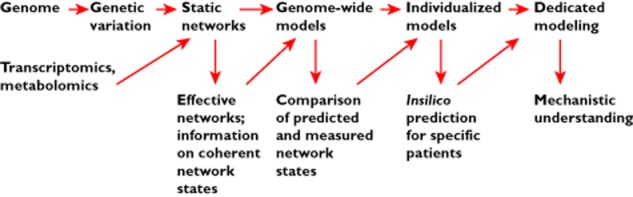
Different levels of complexity in interpreting genome-wide observations
The purely statistical forms of GWAS data interpretation (data mining, machine learning) face substantial computational and bioinformatics challenges due to the fact that more than a million SNPs can be identified in the human genome 12. The ENCODE project has recently provided a remarkable compilation of functional elements in the genome 45. Knowing that a substantial number of SNPs observed in GWAS data are outside the coding regions of the genome, it is of outstanding interest to use these inventory of regulatory elements to reinterpret GWAS data sets (see, for example, 46).
It is intuitively clear that DNA methylation and the regulatory action of microRNAs are of relevance for pharmacological questions. Methylation patterns are dynamic responses to environmental factors. The epigenetic regulation of drug metabolizing enzymes is established 47. DNA methylation could provide explanations for interindividual variations in drug response in the (many) cases where genetic variation does not offer a coherent picture 48. The DNA methylation maps becoming available, in particular for clinical cohorts, provide datasets of outstanding importance for systems biology (see, for example, 49).
Currently, from my perspective, the mathematical and conceptual tools for a systems biology exploration of epigenetic phenomena are not yet developed. The step from a methylation pattern to a (dynamical) system is not yet clearly defined. Also, we currently lack mathematical models for the underlying processes, which could help us to look deeper into the regulation, the time scales, the interdependencies within methylation signals and the influencing factors. In this light, it will be of high interest to explore the relation of the ENCODE data to methylation patterns 46.
Outlook II: high throughput data as coherent network states
The evidence that network architecture determines aspects of biological function, both on the levels of gene regulation and metabolism, is incontrovertible (see, for example, 22,24,32,50). Furthermore, a wide range of abstract model studies have demonstrated that network architecture shapes dynamical processes (see, for example, 51,52).
Modelling biological processes as dynamical systems has for a very long time been a highly successful strategy to interpret and understand functionally the underlying systemic principles (see 53 for an account of this strategy in modeling gene regulation). Simulating generic dynamics on graphs can be a very efficient way of calibrating analysis methods based on effective networks, as well as understanding more deeply, which coherent states or ‘patterns’ are possible on a given network. From my perspective, such a pattern-oriented view, aiming at a theoretical framework of pattern formation in networks, could allow us to interpret and understand high throughput data as coherent network states.
Theories of spatiotemporal pattern formation have contributed fundamentally to a deep understanding of natural processes, particularly in biology. One striking example is Turing's concept of reaction-diffusion processes, which has a vast range of applications, from biology to social systems 54. At the same time, these theories (or classes of models) are well embedded in the broader framework of self-organization. Very much in the light of 55 and 56 we should set out to understand, what the network equivalents of classical spatiotemporal patterns are, and how, for example, the presence of loops and feedbacks in networks relate the processes behind spatiotemporal patterns to the theory of complex systems.
This pattern view, when properly incorporated in systems biology, could lead to a new paradigm for the interpretation of high throughput data: architecture-compatible collective modes that establish themselves in a network due to the interplay of architectural and dynamical parameters. A few years ago the development of systems biology, based on molecular and biochemical information, has been compared with the historical development of astronomy 57: from the design of instrumentation (by Galileo) and accumulation of data (by Brahe) to an understanding of natural laws (by Newton) progressing to an interpretation of patterns in the data (by Kepler). If this analogy holds, systems biology is about to turn to a most exciting point of this path involving the move from observing patterns towards an understanding of the natural governing laws and fundamental principles.
Competing Interests
The author has completed the Unified Competing Interest form at http://www.icmje.org/coi_disclosure.pdf (available on request from the corresponding author) and declares no support from any organization for the submitted work, no financial relationships with any organizations that might have an interest in the submitted work in the previous 3 years and no other relationships or activities that could appear to have influenced the submitted work.
I am grateful for stimulating discussions with Moritz Beber, Miriam Grace, Georgi Muskhelishvili (all Bremen), Annick Lesne (Paris), Claus Hilgetag (Hamburg) and Nikolaus Sonnenschein (San Diego). Some of the concepts presented here have been developed in projects supported by Volkswagen Foundation (grant I/82 717), DFG grant HU-937/4 (spatiotemporal patterns), DFG grant HU-937/6 (digital and analog control) and DFG grant HU-937/7 (excitable dynamics on hierarchical graphs).
References
- 1.Barabási AL, Gulbahce N, Loscalzo J. Network medicine: a network-based approach to human disease. Nat Rev Genet. 2011;12:56–68. doi: 10.1038/nrg2918. [DOI] [PMC free article] [PubMed] [Google Scholar]
- 2.Vidal M, Cusick ME, Barabási AL. Interactome networks and human disease. Cell. 2011;144:986–998. doi: 10.1016/j.cell.2011.02.016. [DOI] [PMC free article] [PubMed] [Google Scholar]
- 3.Sonnenschein N, Golib Dzib JF, Lesne A, Eilebrecht S, Boulkroun S, Zennaro MC, Benecke A, Hütt MT. A network perspective on metabolic inconsistency. BMC Syst Biol. 2012;6:41. doi: 10.1186/1752-0509-6-41. [DOI] [PMC free article] [PubMed] [Google Scholar]
- 4.Ideker T, Krogan NJ. Differential network biology. Mol Syst Biol. 2012;8:565. doi: 10.1038/msb.2011.99. [DOI] [PMC free article] [PubMed] [Google Scholar]
- 5.Hinds DA, Stuve LL, Nilsen GB, Halperin E, Eskin E, Ballinger DG, Frazer KA, Cox DR. Whole-genome patterns of common DNA variation in three human populations. Science. 2005;307:1072–1079. doi: 10.1126/science.1105436. [DOI] [PubMed] [Google Scholar]
- 6.van Someren EP, Wessels LFA, Backer E, Reinders MJT. Genetic network modeling. Pharmacogenomics. 2002;3:507–525. doi: 10.1517/14622416.3.4.507. [DOI] [PubMed] [Google Scholar]
- 7.Kuepfer L. Towards whole-body systems physiology. Mol Syst Biol. 2010;6:409. doi: 10.1038/msb.2010.70. [DOI] [PMC free article] [PubMed] [Google Scholar]
- 8.Kühn A, Lehrach H. The ‘Virtual Patient’ system: modeling cancer using deep sequencing technologies for personalized cancer treatment. J Verbr Lebensm. 2012;7:55–62. [Google Scholar]
- 9.Goh KI, Cusick ME, Valle D, Childs B, Vidal M, Barabási AL. The human disease network. Proc Natl Acad Sci U S A. 2007;104:8685–8690. doi: 10.1073/pnas.0701361104. [DOI] [PMC free article] [PubMed] [Google Scholar]
- 10.Yildirim MA, Goh KI, Cusick ME, Barabási AL, Vidal M. Drug-target network. Nat Biotechnol. 2007;25:1119–1126. doi: 10.1038/nbt1338. [DOI] [PubMed] [Google Scholar]
- 11.Bader JS. The relative power of SNPs and haplotype as genetic markers for association tests. Pharmacogenomics. 2001;2:11–24. doi: 10.1517/14622416.2.1.11. [DOI] [PubMed] [Google Scholar]
- 12.Moore JH, Asselbergs FW, Williams SM. Bioinformatics challenges for genome-wide association studies. Bioinformatics. 2010;26:445–455. doi: 10.1093/bioinformatics/btp713. [DOI] [PMC free article] [PubMed] [Google Scholar]
- 13.Kiernan MC, Vucic S, Cheah BC, Turner MR, Eisen A, Hardiman O, Burrell JR, Zoing MC. Amyotrophic lateral sclerosis. Lancet. 2011;377:942–955. doi: 10.1016/S0140-6736(10)61156-7. [DOI] [PubMed] [Google Scholar]
- 14.Ritchie MD. The success of pharmacogenomics in moving genetic association studies from bench to bedside: study design and implementation of precision medicine in the post-GWAS era. Hum Genet. 2012;131:1615–1626. doi: 10.1007/s00439-012-1221-z. [DOI] [PMC free article] [PubMed] [Google Scholar]
- 15.Duarte NC, Becker SA, Jamshidi N, Thiele I, Mo ML, Vo TD, Srivas R, Palsson BØ. Global reconstruction of the human metabolic network based on genomic and bibliomic data. Proc Natl Acad Sci U S A. 2007;104:1777–1782. doi: 10.1073/pnas.0610772104. [DOI] [PMC free article] [PubMed] [Google Scholar]
- 16.Ma H, Sorokin A, Mazein A, Selkov A, Selkov E, Demin O, Goryanin I. The Edinburgh human metabolic network reconstruction and its functional analysis. Mol Syst Biol. 2007;3:135. doi: 10.1038/msb4100177. [DOI] [PMC free article] [PubMed] [Google Scholar]
- 17.Becker SA, Palsson BØ. Context-specific metabolic networks are consistent with experiments. PLoS Comput Biol. 2008;4:e1000082. doi: 10.1371/journal.pcbi.1000082. [DOI] [PMC free article] [PubMed] [Google Scholar]
- 18.Sonnenschein N, Geertz M, Muskhelishvili G, Hütt M. Analog regulation of metabolic demand. BMC Syst Biol. 2011;5:40. doi: 10.1186/1752-0509-5-40. [DOI] [PMC free article] [PubMed] [Google Scholar]
- 19.Gille C, Bölling C, Hoppe A, Bulik S, Hoffmann S, Hübner K, Karlstädt A, Ganeshan R, König M, Rother K, Weidlich M, Behre J, Holzhütter HG. HepatoNet1: a comprehensive metabolic reconstruction of the human hepatocyte for the analysis of liver physiology. Mol Syst Biol. 2010;6:411. doi: 10.1038/msb.2010.62. [DOI] [PMC free article] [PubMed] [Google Scholar]
- 20.Jerby L, Shlomi T, Ruppin E. Computational reconstruction of tissue-specific metabolic models: application to human liver metabolism. Mol Syst Biol. 2010;6:401. doi: 10.1038/msb.2010.56. [DOI] [PMC free article] [PubMed] [Google Scholar]
- 21.Mintz-Oron S, Meir S, Malitsky S, Ruppin E, Aharoni A, Shlomi T. Reconstruction of Arabidopsis metabolic network models accounting for subcellular compartmentalization and tissue-specificity. Proc Natl Acad Sci U S A. 2012;109:339–344. doi: 10.1073/pnas.1100358109. [DOI] [PMC free article] [PubMed] [Google Scholar]
- 22.Barabási AL, Oltvai ZN. Network biology: understanding the cell's functional organization. Nat Rev Genet. 2004;5:101–113. doi: 10.1038/nrg1272. [DOI] [PubMed] [Google Scholar]
- 23.Jeong H, Tombor B, Albert R, Oltvai ZN, Barabási AL. The large-scale organization of metabolic networks. Nature. 2000;407:651–654. doi: 10.1038/35036627. [DOI] [PubMed] [Google Scholar]
- 24.Luscombe NM, Babu MM, Yu H, Snyder M, Teichmann SA, Gerstein M. Genomic analysis of regulatory network dynamics reveals large topological changes. Nature. 2004;431:308–312. doi: 10.1038/nature02782. [DOI] [PubMed] [Google Scholar]
- 25.Jothi R, Balaji S, Wuster A, Grochow JA, Gsponer J, Przytycka TM, Aravind L, Babu MM. Genomic analysis reveals a tight link between transcription factor dynamics and regulatory network architecture. Mol Syst Biol. 2009;5:294. doi: 10.1038/msb.2009.52. [DOI] [PMC free article] [PubMed] [Google Scholar]
- 26.Marr C, Geertz M, Hütt M, Muskhelishvili G. Dissecting the logical types of network control in gene expression profiles. BMC Syst Biol. 2008;2:18. doi: 10.1186/1752-0509-2-18. [DOI] [PMC free article] [PubMed] [Google Scholar]
- 27.Newman ME. Modularity and community structure in networks. Proc Natl Acad Sci U S A. 2006;103:8577–8582. doi: 10.1073/pnas.0601602103. [DOI] [PMC free article] [PubMed] [Google Scholar]
- 28.Alexander RP, Kim PM, Emonet T, Gerstein MB. Understanding modularity in molecular networks requires dynamics. Sci Signal. 2009;2:e44. doi: 10.1126/scisignal.281pe44. [DOI] [PMC free article] [PubMed] [Google Scholar]
- 29.Schulman L, Gaveau B. Dynamical distance: coarse grains, pattern recognition, and network analysis. Bull Sci Math. 2005;129:631–642. [Google Scholar]
- 30.Rosvall M, Bergstrom C. Maps of random walks on complex networks reveal community structure. Proc Natl Acad Sci U S A. 2008;105:1118–1123. doi: 10.1073/pnas.0706851105. [DOI] [PMC free article] [PubMed] [Google Scholar]
- 31.Hartwell LH, Hopfield JJ, Leibler S, Murray AW. From molecular to modular cell biology. Nature. 1999;402:47. doi: 10.1038/35011540. [DOI] [PubMed] [Google Scholar]
- 32.Alon U. Network motifs: theory and experimental approaches. Nat Rev Genet. 2007;8:450–461. doi: 10.1038/nrg2102. [DOI] [PubMed] [Google Scholar]
- 33.Watts DJ, Strogatz SH. Collective dynamics of ‘small-world’ networks. Nature. 1998;393:440–442. doi: 10.1038/30918. [DOI] [PubMed] [Google Scholar]
- 34.Brandman O, Meyer T. Feedback loops shape cellular signals in space and time. Science. 2008;322:390–395. doi: 10.1126/science.1160617. [DOI] [PMC free article] [PubMed] [Google Scholar]
- 35.Novák B, Tyson JJ. Design principles of biochemical oscillators. Nat Rev Mol Cell Biol. 2008;9:981–991. doi: 10.1038/nrm2530. [DOI] [PMC free article] [PubMed] [Google Scholar]
- 36.Pigolotti S, Krishna S, Jensen MH. Oscillations in negative feedback loops. Proc Natl Acad Sci U S A. 2007;104:6533–6537. doi: 10.1073/pnas.0610759104. [DOI] [PMC free article] [PubMed] [Google Scholar]
- 37.Brandman O, Ferrell JEJ, Li R, Meyer T. Interlinked fast and slow positive feedback loops drive reliable cell decisions. Science. 2005;310:496–498. doi: 10.1126/science.1113834. [DOI] [PMC free article] [PubMed] [Google Scholar]
- 38.Ma W, Trusina A, El-Samad H, Lim WA, Tang C. Defining network topologies that can achieve biochemical adaptation. Cell. 2009;138:760–773. doi: 10.1016/j.cell.2009.06.013. [DOI] [PMC free article] [PubMed] [Google Scholar]
- 39.Milo R, Itzkovitz S, Kashtan N, Levitt R, Shen-Orr S, Ayzenshtat I, Sheffer M, Alon U. Superfamilies of evolved and designed networks. Science. 2004;303:1538–1542. doi: 10.1126/science.1089167. [DOI] [PubMed] [Google Scholar]
- 40.Klemm K, Bornholdt S. Topology of biological networks and reliability of information processing. Proc Natl Acad Sci U S A. 2005;102:18414–18419. doi: 10.1073/pnas.0509132102. [DOI] [PMC free article] [PubMed] [Google Scholar]
- 41.Kaluza P, Vingron M, Mikhailov AS. Self-correcting networks: function, robustness, and motif distributions in biological signal processing. Chaos. 2008;18:026113. doi: 10.1063/1.2945228. [DOI] [PubMed] [Google Scholar]
- 42.Kwon Y, Cho K. Analysis of feedback loops and robustness in network evolution based on Boolean models. BMC Bioinformatics. 2007;8:430. doi: 10.1186/1471-2105-8-430. [DOI] [PMC free article] [PubMed] [Google Scholar]
- 43.Marr C, Theis F, Liebovitch L, Hütt M. Patterns of subnet usage reveal distinct scales of regulation in the transcriptional regulatory network of Escherichia coli. PLoS Comput Biol. 2010;6:e1000836. doi: 10.1371/journal.pcbi.1000836. [DOI] [PMC free article] [PubMed] [Google Scholar]
- 44.Price ND, Reed JL, Palsson BØ. Genome-scale models of microbial cells: evaluating the consequences of constraints. Nat Rev Microbiol. 2004;2:886–897. doi: 10.1038/nrmicro1023. [DOI] [PubMed] [Google Scholar]
- 45.The ENCODE Project Consortium. An integrated encyclopedia of DNA elements in the human genome. Nature. 2012;488:57–74. doi: 10.1038/nature11247. [DOI] [PMC free article] [PubMed] [Google Scholar]
- 46.Ecker JR, Bickmore WA, Barroso I, Pritchard JK, Gilad Y, Segal E. Genomics: ENCODE explained. Nature. 2012;489:52–55. doi: 10.1038/489052a. [DOI] [PubMed] [Google Scholar]
- 47.Baer-Dubowska W, Majchrzak-Celińska A, Cichocki M. Pharmocoepigenetics: a new approach to predicting individual drug responses and targeting new drugs. Pharmacol Rep. 2011;63:293–304. doi: 10.1016/s1734-1140(11)70498-4. [DOI] [PubMed] [Google Scholar]
- 48.Gomez A, Ingelman-Sundberg M. Pharmacoepigenetics: its role in interindividual differences in drug response. Clin Pharmacol Ther. 2009;85:426–430. doi: 10.1038/clpt.2009.2. [DOI] [PubMed] [Google Scholar]
- 49.Zhang R, Miao Q, Wang C, Zhao R, Li W, Haile CN, Hao W, Zhang XY. Genome-wide DNA methylation analysis in alcohol dependence. Addict Biol. 2013;18:392–403. doi: 10.1111/adb.12037. [DOI] [PubMed] [Google Scholar]
- 50.Sonnenschein N, Marr C, Hütt M. A topological characterization of medium-dependent essential metabolic reactions. Metabolites. 2012;2:632–647. doi: 10.3390/metabo2030632. [DOI] [PMC free article] [PubMed] [Google Scholar]
- 51.Arenas A, Diaz-Guilera A, Perez-Vicente C. Synchronization reveals topological scales in complex networks. Phys Rev Lett. 2006;96:114102. doi: 10.1103/PhysRevLett.96.114102. [DOI] [PubMed] [Google Scholar]
- 52.Marr C, Hütt M. Outer-totalistic cellular automata on graphs. Phys Lett A. 2009;373:546–549. [Google Scholar]
- 53.Bornholdt S. Systems Biology: less is more in modeling large genetic networks. Science. 2005;310:449–451. doi: 10.1126/science.1119959. [DOI] [PubMed] [Google Scholar]
- 54.Turing AM. The chemical basis of morphogenesis. Philos Trans R Soc London B Biol Sci. 1952;237:37–72. [Google Scholar]
- 55.Nakao H, Mikhailov AS. Turing patterns in network-organized activator-inhibitor systems. Nature Publishing Group. Nat Phys. 2010;6:544–550. [Google Scholar]
- 56.Müller-Linow M, Hilgetag CC, Hütt M. Organization of excitable dynamics in hierarchical biological networks. PLoS Comput Biol. 2008;4:e1000190. doi: 10.1371/journal.pcbi.1000190. [DOI] [PMC free article] [PubMed] [Google Scholar]
- 57.Alter O. Discovery of principles of nature from mathematical modeling of DNA microarray data. Proc Natl Acad Sci U S A. 2006;103:16063–16064. doi: 10.1073/pnas.0607650103. [DOI] [PMC free article] [PubMed] [Google Scholar]
- 58.Smith J, Hütt MT. Network dynamics as an interface between modeling and experiment in systems biology. In: Tretter F, Gebicke-Haerter PJ, Mendoza ER, Winterer G, editors. Systems Biology in Psychiatric Research: From High-Throughput Data to Mathematical Modeling. Weinheim: Wiley-VCH; 2010. pp. 234–276. [Google Scholar]