Summary
The infiltration of immune cell subsets in adipose tissue termed ‘adipose tissue leukocytosis’ is a critical event in the development of chronic inflammation and obesity-associated comorbidities. Given that a significant proportion of cells in adipose tissue of obese patients are of hematopoietic lineage, the distinct adipose depots represent an uncharacterized immunological organ that can impact metabolic functions. Here, we describe approaches to characterize and isolate leukocytes from the complex adipose tissue microenvironment to aid mechanistic studies to understand the role of specific pattern recognition receptors (PRRs) such as inflammasomes in adipose-immune crosstalk.
Keywords: B cell, T cell, macrophage, granulocyte, flow cytometry, adipose tissue digestion
1. Introduction
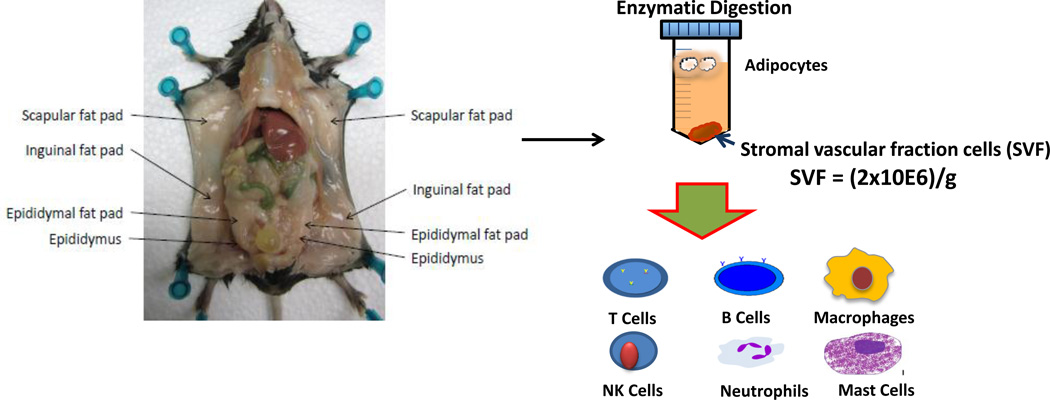
Adipose tissue is a complex and diverse cellular organ that is primarily involved in regulation of energy homeostasis. Adipocytes are the predominant cell types in adipose depots and control metabolism by storing excess calories as lipids together with production of endocrine hormones such as leptin and adiponectin [1]. The capacity of adipose tissue to expand and store energy as lipids represents a critical adaptation to chronic caloric excess. In addition to adipocytes, adipose tissue is composed of stromal-vascular fraction (SVF) cells and cells of the hematopoietic lineage (see Figure 1). It is now established that adipose tissue expansion in obesity is associated with an increase in macrophages, neutrophils, T cells, B cells and mast cells in adipose tissue [2–7] (see Figure 1). Thus ‘adipose leukocytosis’ or increased infiltration of leukocytes into adipose tissue during obesity represents an important link between adaptive adipose tissue remodeling in response to energy excess and the emergence of chronic inflammation-associated insulin resistance.
Figure 1.
Overview of the separation and analysis of leukocytes from adipose tissue. Mouse adipose tissue is collected and weighed prior to subsequent analysis. Adipose tissue is digested to yield a stromal-vascular fraction. The stromal-vascular fraction contains immune cell subsets including T and B cells, macrophages, NK cells, neutrophils, and mast cells, which are increased by obesity.
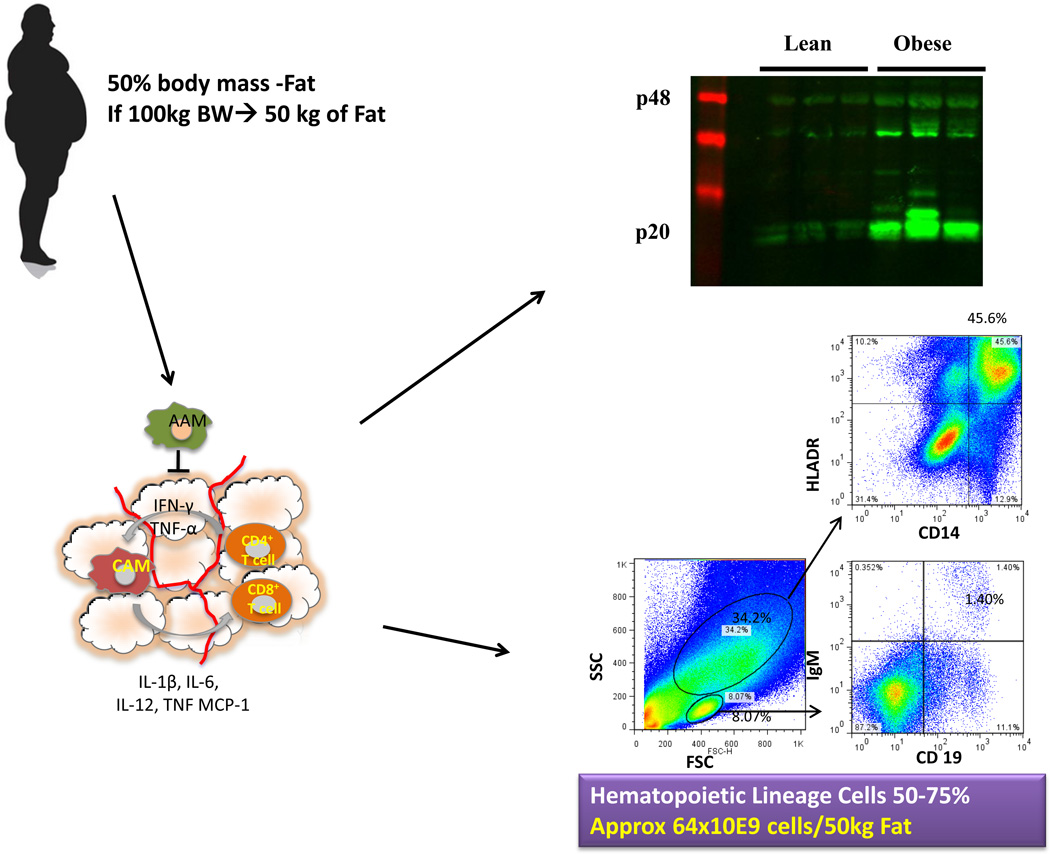
The enzymatic dispersion of adipose tissue and subsequent processing yields adipocytes (floating fraction) and a cell pellet called SVF [2,7,8] (see Figure 1). In obesity, depending on specific sites, the adipose depots can contain ~2 to 5 million SVF cells/gram and roughly 50–65% of these cells can be of hematopoietic lineage [7,9] (see Figure 2). Importantly, in morbid or extreme obesity in humans, the total adipose tissue mass can increase to constitute up to 50% of the total body mass. Thus, the expanded adipose tissue represents a largely uncharacterized immunological organ with distinct leukocytes with potentially unique function to regulate immune-metabolic crosstalk.
Figure 2.
Overview of the analysis of leukocytes from adipose tissue. Human adipose tissue is collected, weighed and digested prior to downstream analysis. FACS plots from human adipose tissue stromal-vascular fraction taken from a female subject (BMI 29.9) showing CD14+HLADR+ macrophages and IGM+CD19+ B cells. Adipose tissue leukocytosis and the accretion of body fat lead to a large increase in the total amount of cells in fat ~64 × 109 cells/50 kg fat. Western blot analysis of caspase-1 activation (p20) in visceral adipose tissue from 9-month WT lean, WT diet-induced obese (DIO) mice.
The control of caspase-1 activation and subsequent production of active IL-1β, IL-18 and other yet to be identified proteins is an integral part of innate immunity. Caspase-1 is activated by multiprotein scaffolding complexes termed “inflammasomes”, which are responsive to both exogenous pathogen associated molecular patterns (PAMPs), and also damage associated molecular patterns (DAMPs)_[10]. Even though IL-1β and IL-18 play key roles in innate immunity, they also cause host tissue damage, especially during chronic inflammation. Because these cytokines have pleiotropic roles to alter the function of lymphocytes and other immune cells, as well as non-immune cells including adipocytes and hepatocytes, there is a need to be able to separate their effects on different cell types in vivo. This may be especially important when analyzing the influence of the inflammasomes on metabolic organs in chronic diseases like obesity and type 2 diabetes [9,11]. Through the use of sequential enzymatic digestions to disperse adipose depots and multicolor flow cytometry, we have shown that specific leukocyte subsets including T cells and macrophages are affected by NLRP3 ablation in the adipose tissue during high-fat feeding [9]. Reduction in adipose tissue inflammation is correlated with lower M1 macrophage numbers and effector T cell population together with increased whole body insulin sensitivity [9]. Other studies have borne out the specific effects of IL-1β and IL-18 on adipocytes and hepatocytes [12,13].
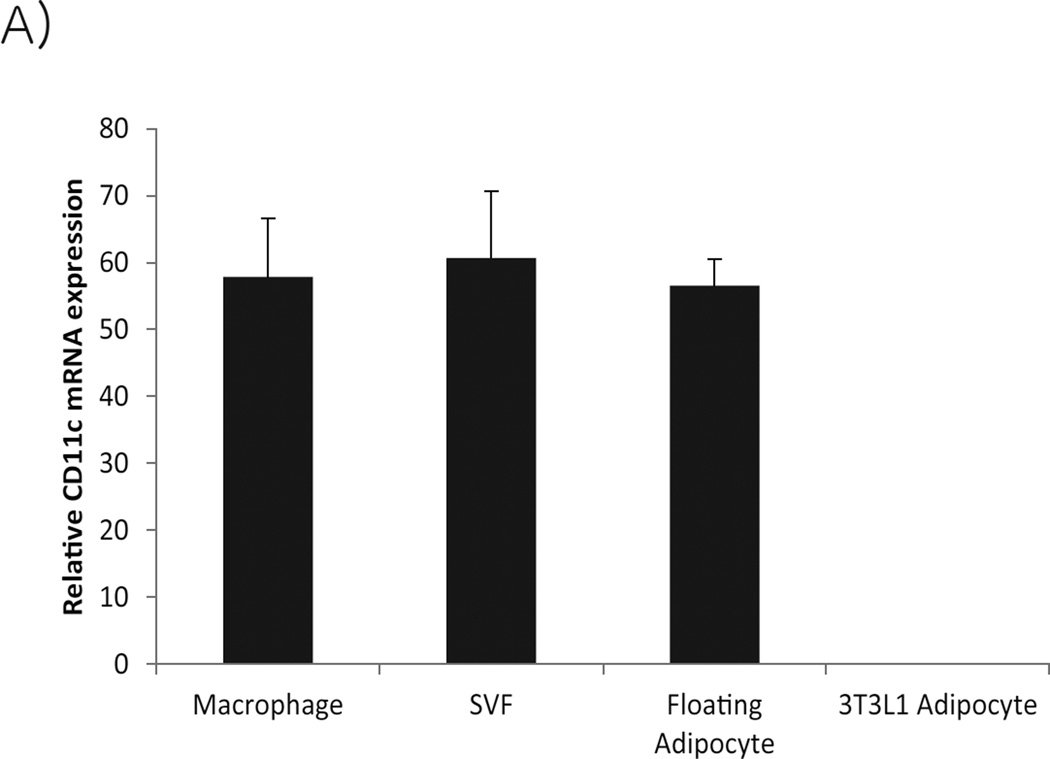
Analysis of adipose tissue immune cell subsets is difficult because of the complex structure of adipose tissue. Care must be taken with interpretation of data generated from both isolated SVF and floating adipocyte fractions. In addition to leukocytes, the SVF also contains mesenchymal and endothelial cells. For leukocyte analysis, immune cell subsets must be liberated from the tissue, without disruption of their cell surface receptors and then subsequently analyzed. The floating adipocyte fraction is not purely adipocytes because macrophages not only become larger, but more buoyant as they engulf lipids. Thus, the floating adipocyte fraction is contaminated with large buoyant macrophages as demonstrated in Figure 3 showing CD11c expression in both the stromal-vascular and floating adipocyte fractions. Detection of myeloid cell expressed cytokines and pattern recognition receptors such as NLRP3 in the adipocyte fraction can thus be confounded by the presence of contaminating lipid engorged adipose tissue macrophages.
Figure 3.
Relative mRNA expression of CD11c in F4/80+ adipose tissue macrophages, stromal vascular and floating adipocyte fractions and 3T3-L1 adipocytes (mean ± SEM).
Herein, we describe methods for collection and digestion of adipose tissue, in order to isolate SVF and adipocyte cell populations that may be relevant to future studies on the mechanisms underlying immune-metabolic interactions in obesity-associated chronic diseases. Subsequent to immune cell isolation, we describe analysis of specific immune cell populations in adipose tissue including the surface staining for specific marker proteins and gating strategies useful for flow cytometric analysis.
2. Materials
2.1 Collection of subcutaneous and visceral adipose tissue depots
Sterile forceps and scissors
Culture medium: RPMI 1640 supplemented with 5% fetal bovine serum (FBS), 1% penicillin/streptomycin
Sterile 24-well plate
70% ethanol
2.2 Digestion of Fat
Sterile scissors
70% ethanol
Kim wipes
Collagenase type I buffer: Add 0.2 g of collagenase type 1 powder to 200 mL of HBSS without Ca2+ & Mg2+, pH 7.1. Filter through a 22 µm filter.
22 µm filter
Ice
6-well plate
Sterile transfer pipettes
3 × 50 mL conical tube
Shaking water bath at 37°C
Laminar flow hood
Centrifuge at 4°C
Ack Lysing buffer
Sterile culture medium (see materials 2.1)
Sterile 100 µm cell strainer
Sterile 40 µm cell strainer
PBS
BSA
Hemocytometer
2.3 FACS staining
5 ml: round bottom tubes
Stain buffer: dPBS pH 7.4, 2% FBS and 0.09% NaN3
FC-Block (purified anti-CD16/CD32)
Vortex
Aluminium Foil
Ice
PBS
Fixative: 1% paraformaldehyde
Fluorescently labeled antibodies (see Table 1 (mouse), Table 2 (human))
Table 1.
Antibodies used for analysis of immune cell subsets in adipose tissue
| FSC/SSC gate |
Cell population |
Cell subpopulation |
Antibody | Mouse Clone |
|---|---|---|---|---|
| Lymphocyte | ||||
| T cell | CD3 | 145-2C11 | ||
| CD4 + T cell | CD4 | RM4-5 | ||
| naïve | CD44-CD62L+ | IM7 ; Mel-14 | ||
| effector memory | CD44+CD62L- | IM7 ; Mel-14 | ||
| CD8+ T cell | CD8 | 53-6.7 | ||
| naïve | CD44-CD62L+ | IM7 ; Mel-14 | ||
| effector memory | CD44+CD62L- | IM7 ; Mel-14 | ||
| B cell | B220 | RA-6B2 | ||
| Mature B cells | IGM,CD19 | 11/41 ; ebio1D3 | ||
| Granulocyte | Gr1 | RB6-8C5 | ||
| Macrophage | ||||
| Macrophage | F4/80 | BM8 | ||
| M1 | CD11c | N418 | ||
| M2 | CD206 | C068C2 | ||
| Granulocyte | Gr1 | RB6-8C5 |
Table 2.
Antibodies used for analysis of immune cell subsets in adipose tissue
| FSC/SSC gate |
Cell population |
Cell subpopulation |
Antibody | Human Clone |
|---|---|---|---|---|
| Lymphocyte | ||||
| T cell | CD3 | UCHT1 | ||
| CD4 + T cell | CD4 | OKT4 | ||
| naïve | CD44-CD45RA+ | IM7 ; HI100 | ||
| effector memory | CD44+CD45RA- | IM7 ; HI100 | ||
| CD8+ T cell | CD8 | SK1 | ||
| naïve | CD44-CD45RA+ | IM7 ; HI100 | ||
| effector memory | CD44+CD45RA- | IM7 ; HI100 | ||
| B cell | B220 | RA-6B2 | ||
| Mature B cells | IGM,CD19 | MHM-88 ;HIB19 | ||
| Granulocyte | CD66b | 80H3 | ||
| Macrophage | ||||
| Macrophage | CD14 | 61D3 | ||
| M1 | CD11c | 3.9 | ||
| M2 | CD206 | 15-2 | ||
| Granulocyte | CD66b | 80H3 |
3. Methods
3.1 Collection of subcutaneous and visceral mouse adipose tissue depots
Place enough sterile media into the wells of a sterile 24-well plate so that when the tissue is collected, it is covered in media (~1mL) (see Note 1).
After the mouse is euthanized, spray the body with 70% ethanol.
Make an incision through the skin and peritoneum from the lower stomach to rib cage. Continue the incision out along the 4 limbs and separate the peritoneum from the skin (see Note 2).
The epididymal fat pad is located adjacent to the epididymis (see Figure 1), and should be removed carefully so that adipose tissue is not contaminated by other tissue. Place tissues into media in the prepared 24-well plate (see Note 3).
The inguinal (subcutaneous) fat pads lie between the peritoneum and the skin (see Figure 1). Remove the fat pad by lifting it up and cutting along the skin. This fat pad is fairly large and continues around to the back close to the spinal column (see Note 4).
Weigh fat pads (see Note 5).
3.2 Digestion of Fat (see Figure 1)
Prepare collagenase type I buffer, and place on ice.
Perform the following steps in a laminar flow hood and on ice. Transfer the fat tissue to a 6-well plate and cover the tissue with collagenase using a sterile transfer pipette (see Notes 6 and 7).
Use two scissors to cut the tissue until it is in small pieces (see Note 8).
Transfer the cut tissue and collagenase to a labeled 50 mL conical tube using a sterile transfer pipette (see Note 9).
Add more collagenase buffer to the tubes until it reaches at least 10 mL and is at a 1:1 ratio of adipose tissue to collagenase (see Note 10).
Place the 50 mL tube on ice until all samples are done.
Spray scissors and forceps with 70% ethanol and wipe with a kimwipe before mincing the next tissue sample. Change sterile transfer pipets between samples.
Once all samples are minced and at the appropriate volume, place them into a rack and incubate the tissue in a shaking water bath at 37°C for 1 h (see Note 11 and 12).
Vortex the tubes every 10 min during incubation, to ensure that the collagenase has access to the tissue (see Note 13).
Centrifuge the tubes at 500 g for 5 min at 4°C.
In the laminar flow hood, remove the supernatant , and resuspend and disperse the pellet in 2 mL of Ack Lysing buffer to remove red blood cells the pellet for 2 min at room temperature.
After 2 min, neutralize the reaction by adding 5 mL culture medium.
Filter the cells and media using a sterile 100 μm cell into a new, labeled 50 mL conical tube. Discard the filter and old tubes when done.
Centrifuge the tubes at 500 g for 5 min at 4°C.
Discard the supernatant.
Wash the cell pellet by adding 5–10 mL of PBS, disperse the cell pellet using a sterile transfer pipet by pipetting up and down several times.
Filter the sample again this time using a 40 μm cell strainer into a new 50 mL conical tube.
Centrifuge the tubes at 500 g for 5 min at 4°C.
Discard the supernatant (see Note 14).
Add 1 mL of PBS with 0.1% BSA or culture medium. disperse the cells using a sterile transfer pipet and place on ice.
Count the stromal-vascular fraction cells using a hemocytometer and continue downstream processing (see Note 15).
3.3 FACS staining
Transfer the desired number (1–2×10⁶) of stromal-vascular cells and splenocyte controls to a labeled 5 mL tube round bottom FACS tubes and centrifuge at 500 g for 5 min at 4°C (see Notes 16 and 17).
Discard the supernatant.
Add 1 mL of Stain Buffer and disperse the cells.
Centrifuge 500 g 5 min at 4°C.
Discard the supernatant.
Add 50 μL of Stain Buffer and 2μL FC-Block to each tube. Disperse the pellet (see Note 18).
Make a master mix that includes all of the antibodies that will be used for the FACS analysis. Table 1 and 2 lists antibodies that can be used to analyze specific immune cell populations. Add 2 μL of antibody per sample to the master mix, typical antibody concentrations from the manufacturer are 0.2 mg/mL, but the concentration can vary from supplier to supplier (see Note 19).
Add 2 μL of each antibody per tube. If using 4 different antibodies, then 8 μL of master mix will be added (see Notes 20 and 21).
Vortex all the tubes.
Cover tubes with foil and incubate for 45 min on ice (see Note 22).
Add 500 μL of PBS to each tube.
Centrifuge tubes at 500 g for 5 min at 4°C.
Discard supernatant.
Resuspend and disrupt the cell pellet in 750 μL of PBS.
Centrifuge tubes at 500 g for 5 min at 4°C.
Discard supernatant.
Wash an additional time by repeating steps 14, 15 and 16.
After discarding the supernatant, resuspend the cells in 500 μL of 1% paraformaldehyde.
Cover the tubes with aluminum foil to protect from light and leave them on ice or in a 4°C refrigerator until they will be analyzed.
Run the FACS analysis (see Note 23).
3.4 FACS gating strategy and analysis
All the FACS data should be analyzed by post collection compensation using appropriate analysis software (FlowJO, Treestar Inc). Resources for FlowJo analysis can be found at http://www.flowjo.com/home/tutorials/.
-
Gating strategy:
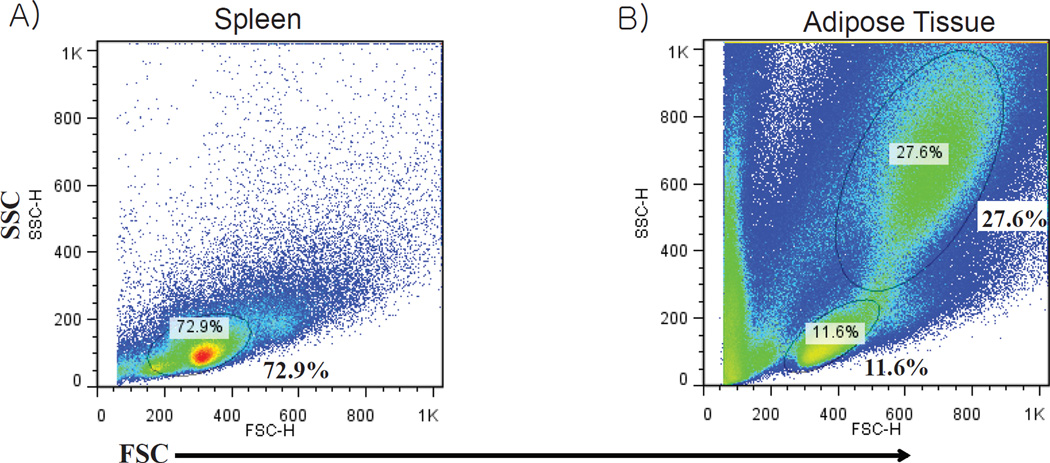
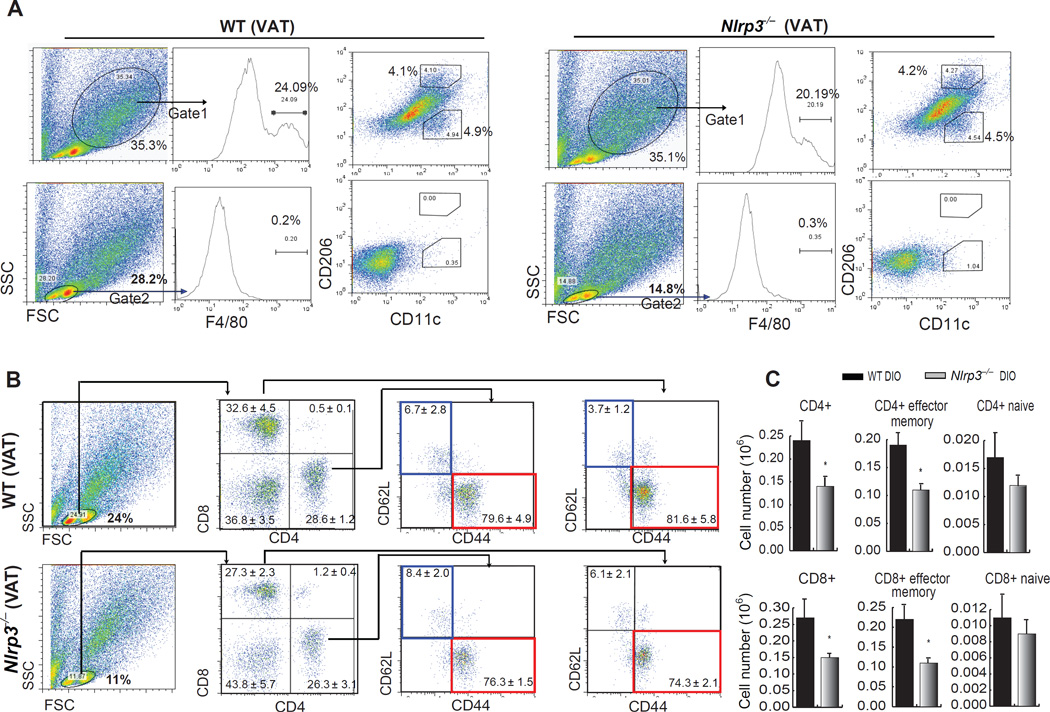
Compared to the spleen, adipose tissue is much more complex, displaying a more varied forward and side scatter with a higher incidence of large dense cells that appear towards the upper right quadrant of the forward and side scatter FACS plot (see Figure 4). Lymphocytes reside in a small population of cells that appear in the lower left quadrant of the forward and side scatter, and the spleen has a much higher frequency of these cells compared with adipose tissue, as would be expected (see Figure 4). Figure 5 displays the gating for adipose tissue lymphocytes and macrophages. B cells and T cells are located within the “lymphocyte gate”, while macrophages are larger and display more variation in size and density, so the gated population is larger for these cells (see Figure 5). Granulocytes consist of neutrophils, eosinophils and basophils, and the size range of these cells varies from just larger than lymphocytes, to cells the size of macrophages. Thus, granulocytes are present in both the “lymphocyte gate” and the “macrophage gate”. For mouse adipose tissue, a representative set of gates can be made for the targeted immune cell populations and applied to all adipose tissue samples.
-
Once the gates have been set and applied to the samples, the samples are ready for statistical analysis. Analyze the within gate cell frequency starting with the FSC×SSC gated population and continuing on through all the gates created. The number of leukocytes in distinct adipose depots can be calculated as shown in the example below (see Note 24).
Example using population percentages typical for mice: Lymphocyte gate 12%, B cell (B220+) frequency 15%, mature B cells (IGM+,CD19+) 90%, 1.5 g adipose tissue Mature B cells/g adipose tissue= (Total cell counts*12%*15%*90%)/1.5 g adipose tissue.
Figure 4.
Comparison of forward scatter and side scatter FACS plots from A) splenocytes and B) stromal vascular fraction cells derived from epididymal fat pad of a 4-month-old obese wild type mouse.
Figure 5.
Gate placement for analysis of macrophages and lymphocytes, and the influence of NLRP3 ablation on T cell subpopulations in visceral adipose tissue (VAT) during DIO. (A) Upper row of FACS plots demonstrates that macrophages reside in a population of large SVF cells (Gate 1), while the lower row demonstrates that they do not reside in the small “lymphoid” gate (Gate 2) in VAT of 9-month WT and Nlrp3−/− DIO mice. Starting with the FSC and SSC (left) populations are sequentially gated for macrophage analysis, first by F4/80 expression and then by CD11c (M1 marker) and CD206 (M2 marker). (A) Sequential analysis of lymphocytes starting with Gate 2 (lymphoid gate), then separating lymphocytes by CD4+ and CD8+ T cells, and then evaluating the naïve (CD62L+CD44−, blue boxes) and effector memory (CD62L−CD44+, red boxes) T cells in both the CD4+ and CD8+ populations. (B) Absolute numbers (in million cells) of naïve and effector CD4+ and CD8+ T cells in adipose tissue of 9 month old WT-DIO and Nlrp3−/− DIO mice. (Figure adapted from Vandanmagsar et al. Nat. Med., 10, 179–188: 2011)
3.5 Digestion and analysis of human adipose tissue
Human subcutaneous and visceral adipose tissue samples obtained from biopsies or from liposuction materials can be used to analyze adipose tissue immune cell subsets (see Note 25).
As with mouse tissue, biopsy samples should be weighed.
Proceed with tissue digestion as described in section 3.2
Proceed with antibody staining protocols for flow cytometric analysis as described in Methods section 3.3.
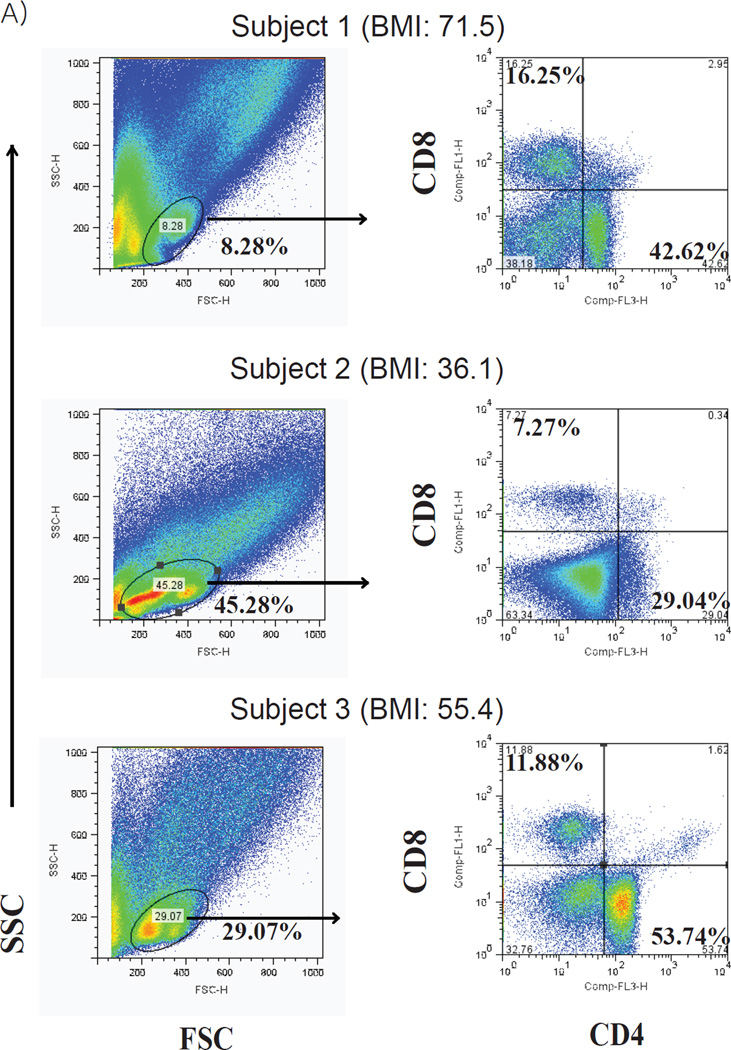
Analyzing human samples in FlowJo follows the same steps as mouse samples. Proceed as outlined in sections 3.4 and 3.5. Although the FSC×SSC plots look different, the general location of the immune cell populations are the same (mouse: see Figure 5, human: see Figure 2 and 6). Between-subject variation is much higher in human adipose tissue immune cell subsets (see Figure 6). Each subject should be analyzed individually, so a representative set of gates should not be used .
It is necessary to combine FACS analysis with measures of caspase-1 activation to fully understand the impact of inflammasome activation on adipose tissue biology (see Note 26).
Figure 6.
Human subjects display variability in adipose tissue T cell populations. FACS analysis of SVF -T cells from omental adipose tissue obtained from obese patients undergoing bariatric surgery. Lymphocyte populations (left) were gated and then analyzed for CD4+ and CD8+ T cells (right). Subjects were all female with a BMI (from top to bottom) of 71.5, 36.1, 55.4, respectively.
4. Notes
4.1 Adipose tissue collection
-
1.
Media and tissue should be kept cold and always be placed on ice.
-
2.
The skin and limbs may be pinned down as in Figure 3 to aid in the dissection.
-
3.
Care should be taken to minimize the amount of time between removal of fat pads and placing them in media. This is important to prevent drying out of the cells and to keep the temperature in the tissue cold.
-
4.
Carefully look over the inguinal fat pad for lymph nodes. These are embedded within the fat pad, but may not be easily visible, offering only slight discoloration. Once spotted, cut adjacent to the lymph node. Then using forceps and downward pressure, grasp the tissue under the lymph node and cut underneath to remove it.
-
5.
Fat pads should be blotted on a paper towel prior to weighing to remove any excess moisture, and ensure an accurate weight measurement. Place fat pads back into media on ice and then proceed to the next steps.
4.2 Digestion of fat
-
6.
Concentration needs to be at 0.1% and at least 10 mL will be needed per depot per mouse.
-
7.
A suspension culture 6-well plate is useful to limit adherence of cells to the plate bottom.
-
8.
To determine how finely the tissue is minced, use forceps to check for larger pieces of tissue, which can then be cut.
-
9.
The transfer pipette tip can be cut off to allow larger pieces of tissue to pass through. If tissue does not easily pass through the pipette opening, further mincing is necessary.
-
10.
The adipose:collagenase ratio can be determined by eye and is easily visible. A ratio lower than 1:1 (collagenase:tissue) will not allow complete digestion of the tissue.
-
11.
For the incubation, a cell culture incubator at 37°C can be used as well. If a cell incubator will be used, wrap the tubes and rack in aluminum foil to ensure even heat distribution. The shaking water bath is the optimal method because the water provides very efficient heat transfer to the samples.
-
12.
Do not digest tissue for more than 1 hour, because there will be an increase in cell death and lower cellular yield. If digestion is incomplete, in future experiments a higher collagenase to tissue ratio can be used, or a higher concentration of collagenase in HBSS can be made.
-
13.
Vortexing is necessary because the fat tends to form a floating mass at the top of the collagenase during the digestion.
-
14.
Floating adipocytes can be collected from the supernatant above the pellet if needed.
-
15.
Isolation of specific cell populations using commercially available kits for untouched immune cell populations designed for lymphoid organs (bone marrow and spleen) do not provide pure populations. Although the kits remove other immune cells, stromal-vascular cells remain. Positive selection using a bead-based system or cell sorting is required.
4.3 FACS Staining
-
16.
For each FACS experiment, control samples used for gating and compensation should be prepared. A tube of unstained splenocytes and splenocytes stained with each antibody alone are used for unstained and single color controls and will be necessary for compensation of the individual channels. It may be useful to run each splenocyte sample as a comparator to the adipose tissue stromal-vascular fraction samples. The larger SVF cells display high autofluorescence (presumably due to presence of lipid and/or particulate matter) and staining requires appropriate isotype IgG controls.
-
17.
Stain between 1 and 2×10⁶ cells for collection of 500,000 to 1×10⁶ events. Using FC-Block and performing washing steps reduces non-specific antibody binding to cells.
-
18.
The number of antibodies used will depend on the number of detectors on the flow cytometer used and the cell populations analyzed.
-
19.
Be sure the pipette tip touches the fluid to ensure that the complete volume of antibody reaches the fluid. Change pipette tips each time.
-
20.
Be sure to add only 2 µL of appropriate antibody to single color controls
-
21.
Keeping the tubes cold keeps the receptor sites at the cell surface and results in better staining.
-
22.
For ease of analysis, order the samples with the unstained control first, followed by the single color controls, which are then followed by the samples that will be analyzed.
-
23.
Useful references for the frequency of adipose tissue immune cell subset include Winer et al. Nature Medicine, Nishimura et al. Nature Medicine, Yang et al. Journal of Immunology, Vandanmagsar et al. Nature Medicine, Lumeng et al Journal of Clinical Investigation [9,14,3,15,16].
-
24.
A caveat of using liposuction material is significant contamination of blood derived leukocytes.
-
25.
Analysis of inflammasome activation: Although FACS analysis is necessary to characterize populations of immune cells in adipose tissue, it must be combined with other analysis to understand how inflammasome activation is affecting the local adipose tissue environment. Western blots of frozen adipose tissue, or isolated macrophages can be used to analyze caspase-1 activation and its products. Caspase-1 is a zymogen, with a pro-form at 45 kD, and after cleavage an active p20 subunit (Fig 2d). IL-1β is also stored in an inactive 31 kD pro-form and cleaved by caspase-1 to an active p17 subunit.
Acknowledgments
The research in Dixit lab is supported in part by NIH grants AG31797, DK090556 and the Pennington Foundation. RWG is supported by NIHT32DK064584-10S1The present work utilized the facilities of the Genomics and CBB Core facilities supported by Pennington Center of Biomedical Research Excellence (NIH 8P20 GM103528) and Nutrition and Obesity Research Center (NIH P30 DK072476).
References
- 1.Greenberg AS, Obin MS. Obesity and the role of adipose tissue in inflammation and metabolism. The American journal of clinical nutrition. 2006;83(2):461S–465S. doi: 10.1093/ajcn/83.2.461S. [DOI] [PubMed] [Google Scholar]
- 2.Weisberg SP, McCann D, Desai M, Rosenbaum M, Leibel RL, Ferrante AW., Jr Obesity is associated with macrophage accumulation in adipose tissue. The Journal of clinical investigation. 2003;112(12):1796–1808. doi: 10.1172/JCI19246. [DOI] [PMC free article] [PubMed] [Google Scholar]
- 3.Winer DA, Winer S, Shen L, Wadia PP, Yantha J, Paltser G, Tsui H, Wu P, Davidson MG, Alonso MN, Leong HX, Glassford A, Caimol M, Kenkel JA, Tedder TF, McLaughlin T, Miklos DB, Dosch HM, Engleman EG. B cells promote insulin resistance through modulation of T cells and production of pathogenic IgG antibodies. Nature medicine. 2011;17(5):610–617. doi: 10.1038/nm.2353. [DOI] [PMC free article] [PubMed] [Google Scholar]
- 4.Rausch ME, Weisberg S, Vardhana P, Tortoriello DV. Obesity in C57BL/6J mice is characterized by adipose tissue hypoxia and cytotoxic T-cell infiltration. Int J Obes (Lond) 2008;32(3):451–463. doi: 10.1038/sj.ijo.0803744. [DOI] [PubMed] [Google Scholar]
- 5.Elgazar-Carmon V, Rudich A, Hadad N, Levy R. Neutrophils transiently infiltrate intra-abdominal fat early in the course of high-fat feeding. Journal of lipid research. 2008;49(9):1894–1903. doi: 10.1194/jlr.M800132-JLR200. [DOI] [PubMed] [Google Scholar]
- 6.Liu J, Divoux A, Sun J, Zhang J, Clement K, Glickman JN, Sukhova GK, Wolters PJ, Du J, Gorgun CZ, Doria A, Libby P, Blumberg RS, Kahn BB, Hotamisligil GS, Shi GP. Genetic deficiency and pharmacological stabilization of mast cells reduce diet-induced obesity and diabetes in mice. Nature medicine. 2009;15(8):940–945. doi: 10.1038/nm.1994. [DOI] [PMC free article] [PubMed] [Google Scholar]
- 7.Strissel KJ, DeFuria J, Shaul ME, Bennett G, Greenberg AS, Obin MS. T-cell recruitment and Th1 polarization in adipose tissue during diet-induced obesity in C57BL/6 mice. Obesity (Silver Spring) 2010;18(10):1918–1925. doi: 10.1038/oby.2010.1. [DOI] [PMC free article] [PubMed] [Google Scholar]
- 8.Lumeng CN, Deyoung SM, Saltiel AR. Macrophages block insulin action in adipocytes by altering expression of signaling and glucose transport proteins. American journal of physiology Endocrinology and metabolism. 2007;292(1):E166–174. doi: 10.1152/ajpendo.00284.2006. [DOI] [PMC free article] [PubMed] [Google Scholar]
- 9.Vandanmagsar B, Youm YH, Ravussin A, Galgani JE, Stadler K, Mynatt RL, Ravussin E, Stephens JM, Dixit VD. The NLRP3 inflammasome instigates obesity-induced inflammation and insulin resistance. Nature medicine. 2011;17(2):179–188. doi: 10.1038/nm.2279. [DOI] [PMC free article] [PubMed] [Google Scholar]
- 10.Petrilli V, Dostert C, Muruve DA, Tschopp J. The inflammasome: a danger sensing complex triggering innate immunity. Current opinion in immunology. 2007;19(6):615–622. doi: 10.1016/j.coi.2007.09.002. [DOI] [PubMed] [Google Scholar]
- 11.Youm Y-H, Kanneganti T-D, Vandanmagsar B, Zhu X, Ravussin A, Adijiang A, Owen John S, Thomas Michael J, Francis J, Parks John S, Dixit Vishwa D. The NLRP3 Inflammasome Promotes Age-Related Thymic Demise and Immunosenescence. Cell Reports. 2012;1(1):56–68. doi: 10.1016/j.celrep.2011.11.005. [DOI] [PMC free article] [PubMed] [Google Scholar]
- 12.Stienstra R, Joosten LA, Koenen T, van Tits B, van Diepen JA, van den Berg SA, Rensen PC, Voshol PJ, Fantuzzi G, Hijmans A, Kersten S, Muller M, van den Berg WB, van Rooijen N, Wabitsch M, Kullberg BJ, van der Meer JW, Kanneganti T, Tack CJ, Netea MG. The inflammasome-mediated caspase-1 activation controls adipocyte differentiation and insulin sensitivity. Cell metabolism. 2010;12(6):593–605. doi: 10.1016/j.cmet.2010.11.011. [DOI] [PMC free article] [PubMed] [Google Scholar]
- 13.Nov O, Kohl A, Lewis EC, Bashan N, Dvir I, Ben-Shlomo S, Fishman S, Wueest S, Konrad D, Rudich A. Interleukin-1beta may mediate insulin resistance in liver-derived cells in response to adipocyte inflammation. Endocrinology. 2010;151(9):4247–4256. doi: 10.1210/en.2010-0340. [DOI] [PubMed] [Google Scholar]
- 14.Yang H, Youm YH, Vandanmagsar B, Ravussin A, Gimble JM, Greenway F, Stephens JM, Mynatt RL, Dixit VD. Obesity increases the production of proinflammatory mediators from adipose tissue T cells and compromises TCR repertoire diversity: implications for systemic inflammation and insulin resistance. J Immunol. 2010;185(3):1836–1845. doi: 10.4049/jimmunol.1000021. [DOI] [PMC free article] [PubMed] [Google Scholar]
- 15.Nishimura S, Manabe I, Nagasaki M, Eto K, Yamashita H, Ohsugi M, Otsu M, Hara K, Ueki K, Sugiura S, Yoshimura K, Kadowaki T, Nagai R. CD8+ effector T cells contribute to macrophage recruitment and adipose tissue inflammation in obesity. Nature medicine. 2009;15(8):914–920. doi: 10.1038/nm.1964. [DOI] [PubMed] [Google Scholar]
- 16.Lumeng CN, Bodzin JL, Saltiel AR. Obesity induces a phenotypic switch in adipose tissue macrophage polarization. The Journal of clinical investigation. 2007;117(1):175–184. doi: 10.1172/JCI29881. [DOI] [PMC free article] [PubMed] [Google Scholar]


