

Abstract
The shape and structure of bones is a topic that has been studied for a long time by morphologists and biologists with the goal of explaining the laws governing their development, aging and pathology. The osteonal architecture of tibial and femoral mid-diaphyses was examined morphometrically with scanning electron microscopy in four healthy young male subjects. In transverse sections of the mid-diaphysis, the total area of the anterior, posterior, lateral and medial cortex sectors was measured and analysed for osteonal parameters including osteon number and density, osteon total and bone area and vascular space area. Osteons were grouped into four classes including cutting heads (A), transversely cut osteons (B), longitudinally cut osteons (C) and sealed osteons (D). The morphometric parameters were compared between the inner (endosteal) and outer (periosteal) half of the cortex. Of 5927 examined osteons, 24.4% cutting heads, 71.1% transversely cut osteons, 2.3% longitudinally cut osteons and 2.2% sealed osteons were found. The interosteonic bone (measured as the area in a lamellar system that has lost contact with its own central canal) corresponded to 51.2% of the endosteal and 52.4% of the periosteal half-cortex. The mean number of class A cutting heads and class B osteons was significantly higher in the periosteal than in the endosteal half-cortex (P < 0.001 and P < 0.05, respectively), whereas there was no significant difference in density. The mean osteon total area, osteon bone area and vascular space area of both classes A and B were significantly higher (P < 0.001 for all three parameters) in the endosteal than in the periosteal half-cortex. The significant differences between the two layers of the cortex suggest that the osteoclast activity is distributed throughout the whole cortical thickness, with more numerous excavations in the external layer, but larger resorption lacunae closer to the marrow canal. A randomly selected population of 109 intact class B osteons was examined at higher magnification (350×) to count osteocyte lacuna and to analyse their relationship with osteon size parameters. The distribution frequency of the mean number of osteocyte lacunae increased with the increment in the sub-classes of osteon bone area, whereas the density did not show significant differences. The number of osteocyte lacunae had a direct correlation with the osteon bone area and the mean osteon wall thickness, as well as the mean number of lamellae. The osteocyte lacunae density showed an inverse relationship. These data suggest a biological regulation of osteoblast activity with a limit to the volume of matrix produced by each cell and proportionality with the number of available cells in the space of the cutting cone (total osteon area). The collected data can be useful as a set of control parameters in healthy human bone for studies on bone aging and metabolic bone diseases.
Keywords: bone morphometry, bone remodelling, cutting cone, osteon
Introduction
How bone remodelling is regulated has been an extensively debated topic concerning several hypotheses referring either to strain-remodelling or biology-related aspects. Early reports (Jee & Arnold, 1954; Arnold et al. 1956; Lee,1964) suggested that the bone apposition rate in the growing cutting cone diminishes as the canal size shrinks, because of the concentric lamellar apposition. These concepts were further worked out and synthetized into a mathematical formula, with osteon refilling as an exponential function of the radius (Manson & Waters, 1965).
Based on the morphological observations of Marotti (1966) and Palumbo et al. (1990), Martin (2000a) presented a theory in which osteocytes send inhibitory signals as refilling of the osteon advances and the ratio between osteocytes and osteoblasts increases. This theory was further developed assuming that within the osteon the lining cells are inclined to activate remodelling unless restrained by inhibitory signals and the mechanically provoked osteocytic signal serves this inhibitory function (Martin, 2000b). A different approach was provided by Polig & Jee (1990), who suggested a reduction in apposition during osteonal basic multicellular units (BMU) refilling due to a reduction in the number of osteoblasts.
Several morphometric studies have been carried out in cortical bone of experimental animals or in humans to test these hypotheses: Metz et al. (2003) provided data revealing an inverse relationship between osteon wall thickness and osteocyte lacunae density. Similar arguments in favour of this relationship were provided by Qiu et al. (2003) but analysing the relationships between number of osteocyte lacunae/bone area and haversian canal area/bone area. Other studies on human proximal femurs (Power et al. 2001, 2002; Britz et al. 2009) supported this point, but the effects of bone disease and/or aging could confound their results because they were carried out in an aged population. Also, the most recent study of Skedros et al. (2011) does not provide clear support for the hypothesized inverse relationship.
Morphometric analysis of cortical bone osteonal architecture presents several biases because of the orientation of the osteons, the remodelling process itself, which produces overlapping of osteons of different ages, and generic artefacts of scanning electron microscope (SEM) processing. A substantial improvement in the definition of the boundaries of osteons in SEM sections can be obtained with the Na3PO4 etching technique (Congiu & Pazzaglia, 2011; Pazzaglia et al. 2012c). Applying this method, the present study was undertaken to provide a set of standard morphometric data for cortical bone in healthy, young male subjects. The analysis was carried out on the whole cortical thickness from the endosteal to the periosteal surface for the purpose of comparisons with physiological aging and pathological conditions such as osteoporosis and other metabolic bone diseases in further studies.
The study was extended to the relationship between osteon size parameters and number and density of osteocyte lacunae. For this purpose a sub-population of intact osteons, longitudinally oriented along the diaphyseal axis, was selected in the same sections and examined under higher magnification.
Materials and methods
Four segments of tibial and femoral mid-diaphyses were obtained for this study from four healthy, young male patients aged 25, 28 30 and 32 respectively, who underwent below the knee (n = 3) or mid-thigh (n = 1) amputations because of severe traumatic limb injuries.
All the patients gave their consent for a segment of the amputated limb to be used for scientific purposes and the study protocol was approved by the Ethics Committee of ‘Spedali Civili di Brescia’ and by the Council of the Department ‘Specialità Chirurgiche, Scienze Radiologiche e Medico-Forensi’ of the University of Brescia.
A segment of the diaphysis from each bone about 3 cm thick was cleaned of soft tissues and fixed in neutral formaldehyde (10%) for a week; the specimens were then transferred into a bath of hydrogen peroxide solution (40%) in water at room temperature for 4 weeks to remove completely all soft tissues without manipulation with sharp blades. Four parallelepipeds were cut from the annular segment of each bone with a diamond-coated, low-speed saw (Remet, Casalecchio di Reno, Bologna, Italy), corresponding, respectively, to anterior, lateral, posterior and medial sectors of the bone (Fig. 1A). From each specimen, three slices 1 mm thick were obtained, each spaced 4 mm apart. These slices were cut in a plane perpendicular to the long axis of the bones, ground to 700 μm thickness and polished with an automated grinder (Remet, Casalecchio di Reno, Bologna, Italy) on abrasive paper (grain 500 and 1000). The surface to be examined was further polished manually on a very fine-grained black slate and submitted to several passages in an ultrasonic bath to remove debris produced by grinding. To enhance the lamellar pattern, the slices were exposed to a 6% Na3PO4 solution (pH = 9.1) for 1 min (Congiu & Pazzaglia, 2011). They were then washed repeatedly in distilled water, ultrasonicated, dehydrated in ascending grades of ethanol and subjected to critical-point drying in CO2. The specimens were secured on stubs with conducting tape, coated with a thin layer of gold in a vacuum sputter Emitech K550 and studied with a Philips XL 30 scanning electron microscope either in the secondary electron image (SEI) or back-scattered electron (BEI) mode.
Figure 1.
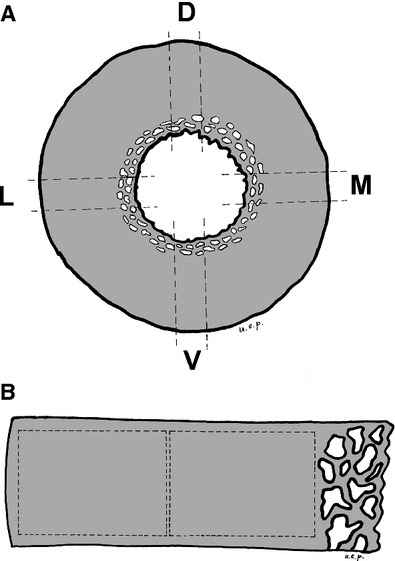
(A) Diagram illustrating the position of the analysed segments of the cortical ring. (B) Diagram illustrating the periosteal and endosteal fields position on the cortical segment.
Morphometry
The scanning electron microscope (SEM) digital images of the transverse slices were acquired in BEI mode with the electron beam perpendicular to the cut bone surface at 20 kV and 10 mm of working distance. The magnification was adjusted at 50× in such a way that the shorter side of the two contiguous, rectangular fields would be aligned externally with the periosteal surface and the inner within the endosteal border. In this way a bone layer of the endosteal border, characterized by large and irregular lacunae, was excluded (Fig. 1B). The area of each field was 3.6 × 2.4 mm and the sum of the areas of the two fields covered about 95% of the whole area of the stripes of diaphysis.
The measurements were carried out with the software cell (Soft Imaging System GmbH, Munster, Germany). All the osteons in the slice from the periosteal to the endosteal surface were evaluated independent of their orientation. The criteria for identification of an osteon were the presence of the central canal (either round/oval-shaped or elongated) and a system of lamellae that appeared concentric to the central canal in osteons cut transversely or parallel in those cut longitudinally or very obliquely. Marginal erosions produced by overlapping of younger osteons were not considered an exclusion criterion, unless the superimposed osteon had destroyed the central canal of the older osteon. A further element helpful for tracing the osteonal perimeters was the mineral density of osteons of different ages, as documented with microradiographs by Jowsey (1966) and also evidenced by SEM in backscattered mode (Fig. 2). The area of interosteonic bone corresponded to that occupied by sequences of lamellae which had lost their relationship with the corresponding vascular canal because of remodelling; this area was calculated as the difference between the total cortex area (Crt.Tot.Ar) and the sum of the osteon total area (Ost.Tot.Ar.) + total area of cutting heads (Ct.Hd.Tot.Ar.).
Figure 2.
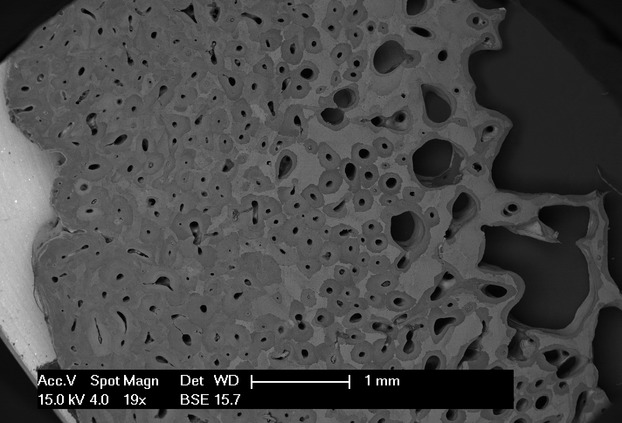
Scanning electron microscopy (backscattered), low-power magnification of a cortical segment from the endosteal to the periosteal surface. The osteonal architecture is evidenced here by the mineral density gradients of the osteons and of the interosteonic lamellar systems.
The osteons and cutting heads observed in the transverse sections were separated into four distinct morphological classes:
class A (transversely sectioned cutting heads), presenting as irregular defects of the bone surface with a scalloped border but no lamellar system within (Fig. 3 A,B);
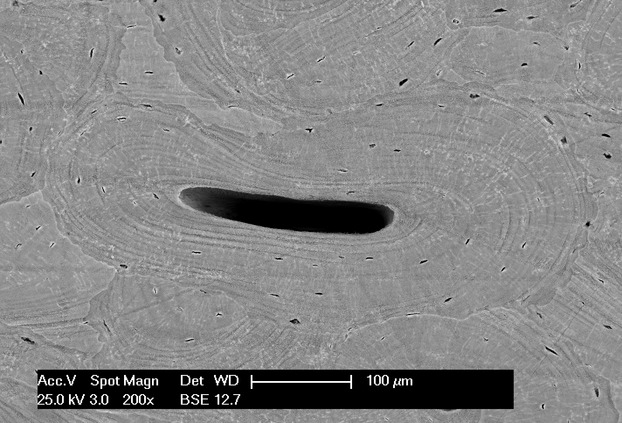
class B (transversely or lightly obliquely sectioned cutting cones), with a wide range of central canal area size and lamellar sets within a reversal line (Fig. 4 A-C);
class C (longitudinally or very obliquely sectioned cutting cones and osteons) with an elongated central canal and two sets of parallel lamellae on each side of the canal delimited by a reversal line (Fig. 5);
class D (sealed osteons, formed by a system of concentric lamellae that filled the central canal) (Fig. 6).
Figure 3.
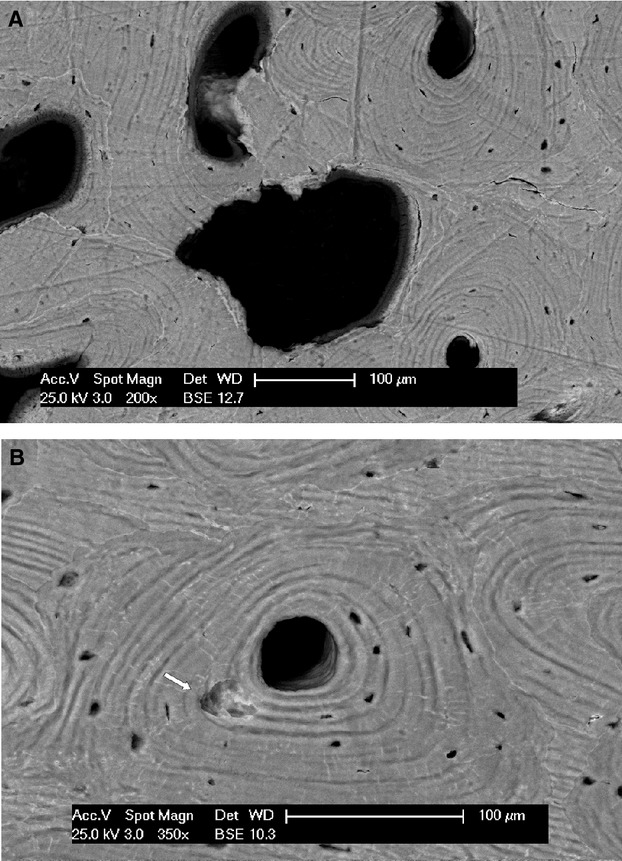
(A) Scanning electron microscopy (backscattered), transversally sectioned cutting head. (B) Scanning electron microscopy (backscattered), starting point of a cutting head (arrow) inside the concentric lamellar system of a class B osteon.
Figure 4.
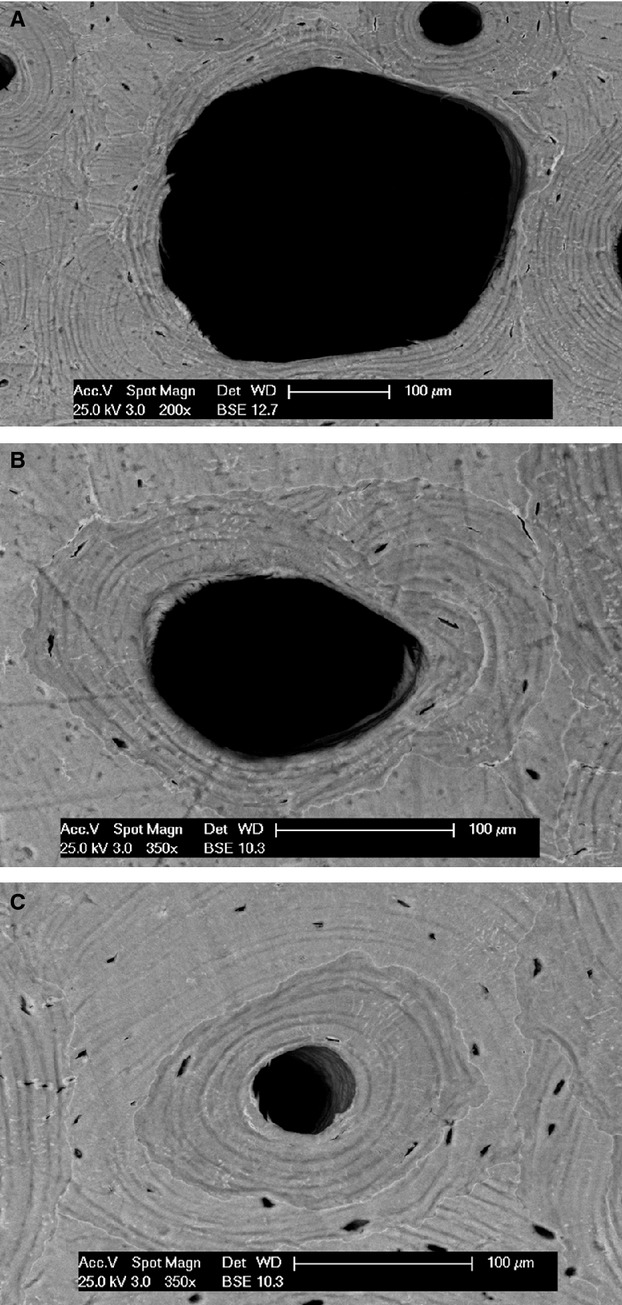
Scanning electron microscopy (backscattered), transversally sectioned osteons with different central canal area. (A-C) Refilling progression.
Figure 5.
Scanning electron microscopy (backscattered) Longitudinally sectioned class C osteon.
Figure 6.
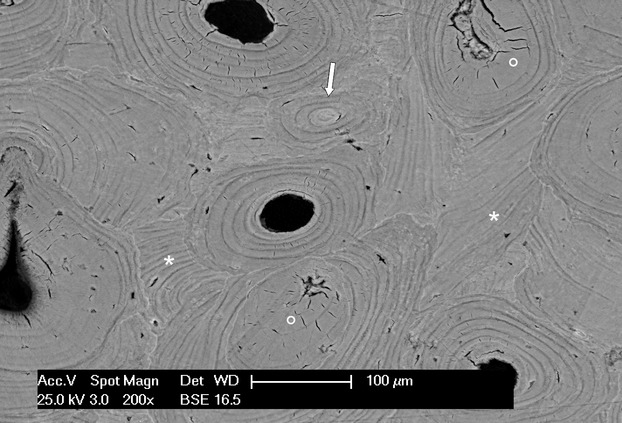
Scanning electron microscopy (backscattered): a sealed osteon corresponding to class D (arrow) and two other osteons evolving toward occlusion of the central canal (circle), interosteonic lamellar systems (asterisk) and class B osteons.
The perimeters of all osteons, central canals and cutting heads were manually traced utilizing the zoom function of the program cell; the perimeters and delimited areas were consequently measured. The following parameters were determined:
cortex total area (Crt.Tot.Ar.);
vascular spaces total area (Vs.Sp.Tot.Ar.), corresponding to the sum of the area of cutting heads (class A) and class B and C osteon central canal area;
osteon total area (Ost.Tot.Ar.), and that pertaining separately to class B and class C osteons;
osteon number (Ost.N.), given by the sum of class B and class C osteons;
cutting head number (Ct.Hd.N.);
sealed osteon number (Sld.Ost.N.).
From these data were calculated:
osteon density for both classes B and C (Ost.N./Crt.Tot.Ar);
cutting head density (Ct.Hd.N/Crt.Tot.Ar.);
sealed osteon density (Sld.Ost.N./Crt.Tot.Ar.);
mean osteonal total area for class B and class C osteons (Mn.Ost.Tot.Ar.);
mean vascular space area for class B and class C osteons (Mn.Vs.Sp.Ar.);
mean osteonal bone area for class B and class C osteons (Mn.Ost.B.Ar. corresponding to Mn.Ost.Tot.Ar. – Mn.Vs.Sp.Ar.);
mean osteon perimeter, only for class B osteons (Mn.Ost.Pm.);
mean central canal perimeter, only for class B osteons (Mn.Ctr.Ca.Pm.);
mean cutting head area (Mn.Ct.Hd.Ar.);
mean sealed osteon area (Mn.Sld.Ost.Ar.).
To analyse the relationship between the geometric parameters of the osteon, the osteocytes (with the assumption that each lacuna corresponded to a cell) and number of lamellae, a population of osteons was randomly selected according to the following criteria:
plane of the section perpendicular or approximately perpendicular to the central canal axis (determined by the ratio between the major and minor central canal diameter < 2 : 1 (Jowsey, 1966)
perimeter un-etched by younger osteons;
central canal perimeter < 400 μm.
This population included 109 osteons and the corresponding images were acquired at higher magnification (350×) in order to count osteocyte lacunae and measure the mean osteon wall thickness (Pazzaglia et al. 2012c). The following parameters were assessed:
osteon total area (Ost.Tot.Ar.);
central canal area (Ctr.Ca.Ar.);
osteon bone area (Ost.B.Ar. = Ost.Tot.Ar. – Ctr.Ca.Ar.);
osteon peripheral circumference (Ost.Per.Cir.);
central canal circumference (Ct.Can.Cir.);
osteon major diameter (Ost.Maj.Diam.);
osteon minor diameter (Ost.Min.Diam.);
osteocyte lacunae number (Ocy.Lc.N.);
osteocyte lacunae density (Ocy.Lc.Den. = Ocy.Lc.N./Ost.B.Ar.);
mean osteon wall thickness (Mn.Ost.W.Thk.), measured as the sum/4 of the thickness intercepted by the major and minor diameters with the osteon peripheral circumference and the central canal circumference.
These osteons were divided into the following sub-classes of osteon total bone area: c1 (2000–20 000 μm2), c2 (2001–30 000 μm2), c3 (30 001–40 000 μm2), c4 (40 001–55 000 μm2), c5 (55 001–85 000 μm2). The limits of each sub-class were chosen so that the number of osteons was approximately the same in each sub-class. The distribution frequency of the mean osteon thickness, the mean number of lamellae, the osteocyte lacunae number and density in each sub-class were evaluated (Pazzaglia et al. 2012c). Within each sub-class of osteon bone area the mean osteon wall thickness was plotted against osteocyte lacunae number and density.
Statistical analysis
The mean value of each parameter in the first population of osteons (evaluated at magnification 50×) was compared between the half endosteal cortex and the corresponding half periosteal cortex with the paired t-test.
Descriptive statistics were used to analyse the distribution of osteon size (Ost.Tot.Ar), cutting head size (Ct.Hd.Ar.), class B and class C osteons.
The value of these parameters for each diaphysis were the mean of three mid-shaft slides carried out at a distance of 4 mm from one to the next. They corresponded to the anterior, posterior, medial and lateral aspect of the cortical ring as illustrated by Fig. 1A. Each of the 48 slices corresponded to an endosteal and periosteal field as illustrated by Fig. 1B.
In the second population of osteons examined at magnification 350× (randomly selected on the whole cortical thickness of the slice) the distribution frequency of osteocyte lacunae number and density for sub-classes or total osteon area were evaluated. Linear regression analysis was used to study the relationship between osteon bone area, mean cortical thickness and number of lamellae, osteocyte lacunae number and density.
The measured parameters were examined independently by two trained observers (A.P. and M.Z.). Interobserver and intraobserver precision in linear or surface measurements and in the count of osteocyte lacunae was expressed as the coefficient of variation (CV) of repeated measurements on a percentage basis. It was tested on a 5% sample of the first population of osteons (= 296). The interobserver precision was 3.2 and 2.9%, respectively, for the two independent measurements in the first population of osteons. The intraobserver precision was 2.1–1.5 and 2.5–1.9%, respectively.
Results
A total of 5927 osteonal structures were found in the midshaft sections including all cutting heads and class B, C and D osteons. Of this total, 1446 (24.4%) were class A cutting heads, 4216 (71.1%) class B osteons, 133 (2.3%) class C osteons and 132 (2.2%) class D osteons. The cutting cones direction of advancement (mainly longitudinal) is the factor conditioning the osteonal architecture of the cortex, which reproduces the vascular network framework (Pazzaglia et al. 2008, 2011b).
The interosteonic bone extension was calculated by the difference between the cortex total area (398.342 mm2) and the sum of the total osteon area (classes B, C, D) and the cutting heads total area (191.904 mm2): the resultant area was 206.437 mm2, corresponding to 51.8% of the total cortex area. The percentage osteonal areas calculated separately in the endosteal and periosteal sectors were 51.2 and the 52.4%, respectively.
The mean number of cutting heads (class A) and class B osteons was significantly higher in the periosteal half of the cortex, whereas the corresponding mean density was not significantly different. Also, the mean number of class C and class D osteons did not differ significantly in the two sectors (Table 1).
Table 1.
Comparison of the mean number and density of osteons classes A, B, C and D between the endosteal and periosteal half cortex
| Cutting heads (class A) |
Osteon (class B) |
Osteon (class C) |
Osteon (class D) |
|||||||||
|---|---|---|---|---|---|---|---|---|---|---|---|---|
| Fields n | Mean number (n) | Mean density (n mm−²) | Fields n | Mean number (n) | Mean density (n mm−²) | Fields n | Mean number (n) | Mean density (n mm−²) | Fields n | Mean number (n) | Mean density (n mm−²) | |
| Endosteal half cortex | 48 | 12.17 ± 4.95 | 0.2 ± 0.06 | 48 | 40.28 ± 11.36 | 0.25 ± 0.06 | 26 | 1.88 ± 0.95 | 0.23 ± 0.03 | 22 | 2.04 ± 1.13 | 0.22 ± 0.01 |
| Periosteal half cortex | 48 | 17.37 ± 6.69 | 0.29 ± 0.31 | 48 | 46.29 ± 11.43 | 0.29 ± 0.31 | 36 | 2.33 ± 1.67 | 0.25 ± 0.07 | 35 | 2.48 ± 1.09 | 0.31 ± 0.36 |
| P < 0.001 | ns | P < 0.001 | ns | P < 0.001 | ns | P < 0.001 | ns | |||||
The mean cutting head area, the mean class B osteon total area, the vascular space area and the osteon bone area were significantly higher in the endosteal half of the cortex. The mean class C osteon total area and osteon bone area were not significantly different between the two sectors. The mean vascular space area was significantly higher in the endosteal half (P < 0.001). The mean bone area of sealed osteons (class D) was not significantly different between the endosteal and periosteal sectors (Table 2). No differences were observed among sections from the anterior, lateral, posterior and medial sectors of the diaphysis.
Table 2.
Comparison of the morphometric parameters mean vascular space area, mean osteon total area, mean cutting heads and osteon bone area (classes A, B, C and D) between the endosteal and the periosteal half cortex
| Cutting heads (class A) |
Osteon (class B) |
Osteon (class C) |
Osteon (class D) |
|||||||||
|---|---|---|---|---|---|---|---|---|---|---|---|---|
| n | Mean Vs Sp Ar (μm²) | n | Mean Ost Tot Ar (μm²) | Mean Vs Sp Ar (μm²) | Mean Ost B Ar (μm²) | n | Mean Ost Tot Ar (μm²) | Mean Vs Sp Ar (μm²) | Mean Ost B Ar (μm²) | n | Mean t B Ar (μm²) | |
| Endosteal half cortex | 560 | 11 268.2 ± 26 068 | 1853 | 43 687.1 ± 38.806 | 6332.2 ± 17842.9 | 39 162.7 ± 83876.9 | 49 | 10 2467.9 ± 69318.7 | 12514.2 ± 11246 | 89 953.6 ± 67725.3 | 45 | 24 459.5 ± 13268.3 |
| Periosteal half cortex | 886 | 36 334.4 ± 7290.5 | 2362 | 36 372.9 ± 32049.61 | 2594.6 ± 7515.1 | 33 778.1 ± 31711.4 | 84 | 89 440.9 ± 98529.4 | 7520.5 ± 6266.1 | 81 920.4 ± 98003.9 | 87 | 22 883.0 ± 17342.9 |
| P < 0.001 | P < 0.001 | P < 0.001 | P < 0.001 | P < 0.001 | P < 0.001 | P < 0.001 | P < 0.001 | |||||
The mean osteon total area, the mean osteon bone area of class B, and the mean area of cutting heads evaluated in the whole cortex had a normal distribution.
In the population of class B intact osteons (examined at 350× magnification) the individual distribution frequencies of the mean osteocyte lacunae number increased with increasing total bone area sub-class, whereas the osteocyte lacunae density did not show significant differences (Fig. 7).
Figure 7.
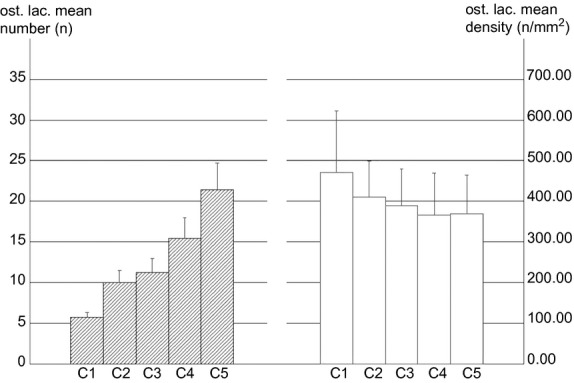
Distribution frequency of the osteocyte lacunae number (hatched histograms) and density (empty histograms) in five sub-classes of intact osteon bone area ordered in ascending scale.
The osteocyte lacunae number had a strong, direct correlation, and the osteocyte lacunae density a weaker inverse relationship with the osteon bone area (Fig. 8 A,B). The mean number of lamellae had a very strong, direct correlation with the mean osteon wall thickness (Fig. 9). The osteocyte lacunae number had a very strong, direct correlation and the osteocyte lacunae density a very weak, inverse relationship with the mean osteon wall thickness. In Figs 8A,B, 9 and 10, all correlations were significant to 0.01; in Fig. 10B they were significant to 0.05.
Figure 8.

Osteocyte lacunae number (A) and osteocyte lacunae density (B) plotted against osteon bone area of intact osteons.
Figure 9.
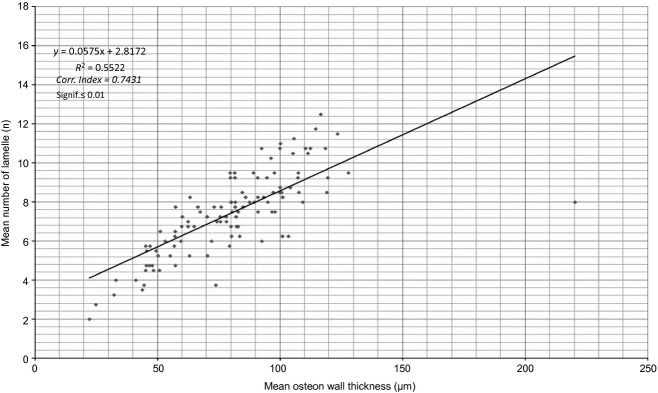
Mean number of lamellae plotted against the mean wall thickness of intact osteons.
Figure 10.

Osteocyte lacunae number (A) and osteocyte lacunae density (B) plotted against the mean wall thickness of intact osteons.
Discussion
The osteonal architecture of the cortex is the product of bone modelling and remodelling through the entire lifespan. New osteons are continuously being opened by the cutting heads on the surface of the older ones and inside the interosteonic, lamellar systems (Smith, 1963; Jowsey, 1966). The diaphyseal perimeters increase because parallel systems of lamellae are apposed by periosteal osteoblasts. This pattern can be observed either in the early development of the tubular bones (Pazzaglia et al. 2011c) or in the course of advancing age. In contrast, endosteal remodelling enlarges the marrow canal. Both these aspects of cortical bone remodelling characterize the diaphyseal morphology at all ages, producing a smooth periosteal surface, lined by systems of parallel lamellae (Fig. 11) and an irregular, jagged endosteal border. The osteonal remodelling extends from the endosteum to the subperiosteal lamellar systems (Fig. 2).
Figure 11.
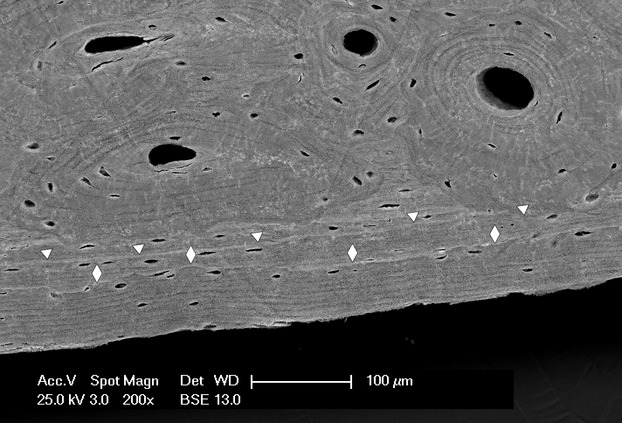
Scanning electron microscopy (backscattered). The parallel periosteal systems at the periphery of the cortex. Apposition occurs in sequential phases which are labelled by cement lines: the older is indicated by triangles, the most recent by diamonds.
There are no morphological boundaries to distinguish the sub-periosteal, central and sub-endosteal layers of the cortex (Pazzaglia et al. 2011b); therefore, a geometric criterion such as distinguishing between the endosteal and periosteal half-cortex was adopted in this study for the sectorial analysis. Morphometric parameters such as cortex total area, number of osteons and cutting heads, osteon total and bone area, vascular space and cutting head area were used to examine the remodelling index and structural organization of the cortex. Since the parameters concerned with linear and surface measurements are conditioned by the osteon orientation (Pazzaglia et al. 2012c), in order to reduce the bias of variations due to projection, classes A (cutting heads) and B (transversely cut osteons) were distinguished from class C (longitudinally cut osteons).
A further aspect which needs to be considered in the analysis of the cortical osteon architecture is time, as the section surface as examined by SEM shows stratification resulting from continuous excavation and refilling of cavities during the lifetime of the bone. The older fraction consisting of the interosteonic lamellar systems has to our knowledge not been previously quantified. It makes up 51.8% of the total cortex area, with no significant differences between the endosteal and the periosteal sectors. This observation documents that in a population of young and healthy male subjects, the lamellar systems of an area equivalent to about half of the total cortex area have a different, transverse connection from that of osteons with a regular vascular axis. The structural organization of the intact osteon suggests that osteocytes encapsulated within the calcified matrix can maintain their metabolic exchanges through the interstitial fluid filtered from the central canal capillary. In the transverse sections of the cortex the osteon looks like a closed system, because there are no connections between the radial canalicula of a secondary osteon and those of the neighbouring systems, with the reversal line acting as a barrier (Pazzaglia et al. 2012b). Therefore when a cutting head resorbs part of an older osteon including the central canal, the residual fragmented, interosteonic system and the related osteocytes may be separated from the vascular supply by the new osteon reversal line. It might therefore be assumed that the osteocytes in the isolated lamellae would die and about 50% of the diaphyseal cortex would be necrotic. However, this is not confirmed by observations of normal cortical bone histology: indeed, in whatever the textbook of bone pathology (Milgram, 1990; Bullough, 1997; Vigorita, 2008), the osteocyte lacunae of the interosteonic lamellae do not show the typical aspect of necrotic bone. These observations pose several, unanswered questions as to the fluid flow dynamics within the lacuno-canalicular system, the mechanisms supporting osteocyte homeostasis and the 3-D structure of the secondary osteons, that deserve further research (Pazzaglia & Congiu, 2012).
The mean number of class A cutting heads can be assumed to represent the actual remodelling index upon sample removal. There were significantly more of them in the periosteal half-cortex (Table 1) but with a smaller mean surface area than those in the endosteal half-cortex (Table 2). It should also be considered that very large endosteal cavities were not evaluated due to the field selection mode on the cortical sections (Fig. 1B). The mean total area, the mean bone area and the mean vascular space area of class B osteons were significantly higher in the endosteal than in the periosteal half-cortex (Table 2). The observed differences provide evidence that in the endosteal sector the class B osteons had a larger total area but were fewer in number than in the periosteal sector. These data suggest that osteoclast activation is distributed throughout the whole cortical thickness but is more efficient near the marrow canal. Neither class C or D osteons showed a particular distribution and their percentages were low. However, the parameters pertaining to class B osteons cannot be correlated to an index of cortical remodelling because they depict several phases in the refilling process for this class of osteons and over an interval of time much broader than that for the cutting heads. Osteon size is determined by the number and activity of the cutting head osteoclasts. At the level of the surface BMUs in trabecular bone, where the osteoclasts do not deepen into the matrix but rather tend to expand the resorption lacuna on the trabecular surface, resorption is known to be regulated by the RANK-ligand system (Parfitt, 1984). It is not known whether it is possible to transfer the same control mechanism to the cutting cone but certainly the particular spatial organization of the vascular loop and the relative position of osteoclasts and osteoblasts within the cone cannot be ignored. These aspects strongly support whether a direct vascular intervention with the resorbing cells is possible. Morphology documents a clear separation of the pool of osteoclasts and that of osteoblasts in the cutting cone, with the first on the front end of advancement of the tunnel and the second in the back, behind the cutting head (Pazzaglia et al. 2011a).
There is scant information concerning the distribution of different-sized osteons inside the cortex of tubular bones. Qiu et al. (2003) in a study on human ribs observed that the osteons varied greatly in size, but very little in the fraction of bone area. Their conclusion concerning these findings was that osteon size was determined by the ‘quantum’ of bone removed by the osteoclasts, but without mentioning the possible related factors. Britz et al. (2009) have observed an inverse relationship between human femoral osteon size (area and diameter) and body weight. They also found that females have significantly smaller osteons than males.
Comparison of human bone histomorphometry with experimental animal models is questionable because there are species-specific differences in what determines osteon size (Horner et al. 1977). However, Havill (2004) documented in Macaca mulatta that sex had a significant effect on osteon area, but scarcely contributed to intracortical remodelling dynamics, whereas age and skeletal maturity influenced osteon density activation frequency and bone formation rate.
Bigley et al. (2006) reported in the equine 3rd metacarpal significant regional differences in the osteon diameter, with the dorsal region having larger osteons than the palmar region. A limit of the quoted studies was that histomorphometry was carried out at high magnification (150–350 μm) and on selected populations of osteon, a necessary condition to evaluate osteonal osteocyte lacunae numbers, but which meant they missed evaluating the cortex total area. When this was not the case (Britz et al. 2009) the bias of osteon orientation was not considered.
The first set of images in the present study was analysed at low magnification (50×). This allowed the whole thickness of the cortex to be scanned, from the periosteum to the endosteum. The differentiation of class B and C osteons was important to reduce the bias of area and perimeter determinations due to the obliquity of the section plane relative to the central canal axis. The number of transversely sectioned osteons (class B) was significantly higher in the periosteal layer, but the mean osteon total area was smaller than in the endosteal layer (Table 2). Therefore there was a good concordance with the distribution and size of class A cutting heads. This is not unexpected because they are expressions of the same process in different phases. In terms of quantity of removed bone matrix (or mean total area for class B osteons), it was confirmed that remodelling is more active sub-endosteally. The class A mean vascular area was significantly higher than the corresponding parameter for class B in both endosteal and periosteal half cortices (Table 2), indicating that in the latter case most the concentric lamellar structure of the osteons was complete.
The second population included only intact osteons (perimeter un-etched by younger osteons) that had almost completed refilling (central canal perimeter < 400 μm). Selection was confined as much as possible to those longitudinally oriented (major and minor central canal diameters < 2 : 1) to reduce the projection bias of area and linear measurements. In this population it was not possible to distinguish their position relative to endosteal or cortical half-cortex because of the higher magnification of the acquired images. Selection was consequently carried out randomly on the total cortical area. In this population, osteon size parameters were correlated with osteocyte number and density (determined by the number of osteocyte lacunae).
The individual frequencies of osteocyte lacunae increased inside the five sub-classes of intact osteons per bone area with increasing size class. The difference between each sub-class was significant (P < 0.001, P < 0.05, P < 0.01 and P < 0.001, respectively), whereas the corresponding osteocyte lacunae density did not show significant differences (Fig. 7). This supports the view of a biological regulation of osteoblast recruitment and activity, with a limit to the volume of bone matrix produced by each cell. The osteocyte domain (Pazzaglia et al. 2012b) can be assessed in osteon transverse sections: its extension equals the radial extension of the processes rising from the bone face of the same osteoblast before its transformation into an osteocyte. Therefore all the osteoblasts recruited from the vascular loop are committed to bone apposition and finally to entrapment without further cell addition in the osteon refilling (Pazzaglia et al. 2012a). In a recent study carried out in diaphyses of equine and canine long bones using functions that describe the probability of finding two canals separated by a given distance and the shortest distance distribution, Shabar et al. (2011) hypothesized that the ordering of canals was such as to minimize the distance of osteocytes from a blood vessel. The mode to achieve this biomechanical set up could be orientation of the matrix collagen fibrils by osteoblast membrane processes (Pazzaglia et al. 2010), which then form the dendritic osteocyte network consequently ordered within the osteon.
We documented in human osteons a direct correlation between osteocyte lacunae number and the osteon bone area or mean osteon wall thickness (Figs 8a and 10a). A direct correlation between the number of lamellae and the mean osteon wall thickness was also observed (Fig. 9), with an inverse relationship between osteocyte lacunae density and osteon bone area or mean osteon wall thickness (Figs 8b and 10b).
The osteocyte density has been correlated with strain, remodelling or metabolism-related aspects of the local biomechanical environment (Robling & Stout, 1999; Martin, 2000a,2000b; Skedros et al. 2005; Power et al. 2012). Another hypothesis was that the haversian bone, made up of alternating non-osteocytic dense lamellae and osteocytic loose lamellae, would show a correlation between osteocyte lacunar size and lamellar thickness, with a size decrease in the lacunae paralleled by loose lamellae reduced thickness (Ardizzoni, 2001).
In mid-diaphyseal cross-sections from sheep ulnae, Metz et al. (2003) observed significant negative correlations between osteon wall thickness and osteocyte lacuna density. In human ribs, calcanei of sheep, deer, elk and horses, and radii and 3rd metacarpals of horses, Skedros et al. (2011) found a significant but weak correlation between osteocyte lacunae number and bone area or osteon wall thickness when considering all osteons in limb bones and variable degrees of significance of the inverse relationship in larger and smaller osteons and in different species.
The direct correlation of the osteocyte lacunae number and the inverse correlation of their density with the bone area of intact class B osteons observed in the present paper could suggest that the volume of matrix apposed by the osteoblasts before they transform into osteocytes is proportional to the number of available cells within the closed space of the cutting cone. However, the idea that all the osteoblasts become osteocytes and no osteoblasts are lost was not confirmed in a 2-D model of osteoblasts–osteocyte kinetics in rabbit osteons (Pazzaglia et al. 2012a). The time taken for refilling, however, has never been measured. The rate of bone formation in osteons has traditionally been measured with fluorescent markers and was presumed to be a continuous process (Manson & Waters, 1965; Lee, 1964; Ilnicki et al. 1966; Polig & Jee, 1990), but there is no evidence that the matrix apposition rate is the same for all osteons or that the active apposition process rate will go on uninterrupted until the osteon refilling has been completed. On the contrary, a study of the morphometry and the osteonal, lamellar patterns in human bone would suggest appositional phases of different length alternating with periods of quiescence (Pazzaglia et al. 2012c). The general problem with the morphometric approach to cortical bone study is, beyond the specific species differences, the variety of technical factors that influence the parameters measured. These include the regional cortical morphology, with primary and secondary osteons in the sub-periosteal layer, the orientation of the secondary osteons, which is not exclusively or precisely longitudinal, and the ongoing remodelling. In the present paper, osteonal orientation was considered with the aim to limit bias due to the obliquity of the section plane (class B and C osteons). To leave out the effects of remodelling, only intact, transversely sectioned osteons were selected in the second population examined. In an earlier paper we documented variations in the lamellar thickness and of the patterns (Pazzaglia et al. 2012c). These observations suggest that the recruitment and activity of a pool of osteoblasts should be considered, rather than the appositional activity of a single cell. The matrix deposition by the osteoblasts is spatially coordinated and synchronous on the surface of the closing cutting cone, but is not necessarily continuous from the reversal line to the final shape of the central canal. Therefore to test a unifying theory of bone remodelling as proposed by Martin (2000a) using a morphometric methodology would require the selection of osteon populations homogeneous not only concerning the orientation of the central canal but also for the phase of refilling. This would presuppose a labelling technique for SEM to be applied in experimental animals, which is not at present available. Therefore, we limit the applicability of the collected data to being a set of control measurements in healthy, human bone which can be compared in future researches on bone aging and metabolic bone diseases.
Acknowledgments
The study was supported by funding from the Department ‘Specialità Medico-Chirurgiche, Scienze Radiologiche e Sanità Pubblica’, of the University of Brescia and by ‘Centro Grandi Strumenti’ of the University of Insubria for scanning electron microscopy imaging production. The authors acknowledge the contribution of the Scientific Committee of ‘Fondazione Mario Boni’ in planning the experiment and drafting the paper. The authors state they have no conflict of interest.
References
- Ardizzoni A. Osteocyte lacunar size-lamellar thickness relationships in human secondary osteons. Bone. 2001;28:215–219. doi: 10.1016/s8756-3282(00)00417-8. [DOI] [PubMed] [Google Scholar]
- Arnold JS, Jee WS, Johnson K. Observations and quantitative radioautographic studies of calcium45 deposited in vivo in forming Haversian systems and old bone of rabbit. Am J Anat. 1956;99:291–313. doi: 10.1002/aja.1000990205. [DOI] [PubMed] [Google Scholar]
- Bigley RF, Griffin LV, Christensen L. Osteon interfacial strength and histomorphometry of equine cortical bone. J Biomech. 2006;39:1629–1640. doi: 10.1016/j.jbiomech.2005.05.006. [DOI] [PubMed] [Google Scholar]
- Britz HM, Thomas CDL, Clement JG. The relation of femoral osteon geometry to age, sex, height and weigth. Bone. 2009;45:77–83. doi: 10.1016/j.bone.2009.03.654. [DOI] [PubMed] [Google Scholar]
- Bullough PG. Bullough and Vigorita's Orthopaedic Pathology. 3rd edn. London-Baltimore: Mosby-Wolfe; 1997. [Google Scholar]
- Congiu T, Pazzaglia UE. The sealed osteons of cortical diaphyseal bone. Early observations revisited with scanning electron microscopy. Anat Rec. 2011;294:193–198. doi: 10.1002/ar.21309. [DOI] [PubMed] [Google Scholar]
- Havill LM. Osteon remodeling dynamics in Macaca mulatta: normal variation with regard to age, sex and skeletal maturity. Calcif Tissue Int. 2004;74:95–102. doi: 10.1007/s00223-003-9038-3. [DOI] [PubMed] [Google Scholar]
- Horner K, Loeffler K, Holzmann M. Comparison of the histologic structure of the compact bone of the long hollow bones of mouse, hamster, rat, guinea pig, rabbit, cat and dog during development. Anat Histol Embryol. 1977;26:289–295. doi: 10.1111/j.1439-0264.1997.tb00138.x. [DOI] [PubMed] [Google Scholar]
- Ilnicki L, Epker BN, Frost HM. The radial rate of osteon closure evaluated by means of in vivo tetracycline labelling in beagle dog rib. J Lab Clin Med. 1966;67:447–454. [PubMed] [Google Scholar]
- Jee WSS, Arnold J. Rate of individual Haversian system formation. Anat Rec. 1954;118:315. [Google Scholar]
- Jowsey J. Studies of Haversian systems in man and some animals. J Anat. 1966;100:857–864. [PMC free article] [PubMed] [Google Scholar]
- Lee WR. Appositional bone formation in canine bone: a quantitative microscopic study using tetracycline markers. J Anat. 1964;98:665–667. [PMC free article] [PubMed] [Google Scholar]
- Manson JD, Waters NE. Observations on the rate of maturation of the cat osteon. J Anat. 1965;99:539–549. [PMC free article] [PubMed] [Google Scholar]
- Marotti G. The structure of bone tissues and the cellular control of their deposition. Ital J Anat Embryol. 1966;101:25–79. [PubMed] [Google Scholar]
- Martin RB. Toward a unifying theory of bone remodeling. Bone. 2000a;26:1–6. doi: 10.1016/s8756-3282(99)00241-0. [DOI] [PubMed] [Google Scholar]
- Martin RB. Does osteocyte formation cause the non linear refilling of osteons? Bone. 2000b;26:71–78. doi: 10.1016/s8756-3282(99)00242-2. [DOI] [PubMed] [Google Scholar]
- Metz LN, Martin RB, Turner AS. Histomorphometric analysis of the effects of osteocyte density on osteonal morphology and remodeling. Bone. 2003;33:753–759. doi: 10.1016/s8756-3282(03)00245-x. [DOI] [PubMed] [Google Scholar]
- Milgram JW. Radiologic and Histologic Pathology of Nontumorous Diseases of Bone and Joints. Northbrook, IL: Northbrook Publishing Company Inc; 1990. [Google Scholar]
- Palumbo C, Palazzini S, Zaffe D. Osteocyte differentiation in the tibia of the newborn rabbit: an ultrastructural study of the formation of cytoplasmic processes. Acta Anat. 1990;137:350–358. doi: 10.1159/000146907. [DOI] [PubMed] [Google Scholar]
- Parfitt AM. The cellular basis of bone remodeling: the quantum concept re-examined in light of recent advances in the cell biology of bone. Calcif Tissue Int. 1984;36:S37–S45. doi: 10.1007/BF02406132. [DOI] [PubMed] [Google Scholar]
- Pazzaglia UE, Bonaspetti G, Ranchetti F. A model of the intracortical vascular system of long bones and its organization: an experimental study in rabbit femur and tibia. J Anat. 2008;213:183–193. doi: 10.1111/j.1469-7580.2008.00932.x. [DOI] [PMC free article] [PubMed] [Google Scholar]
- Pazzaglia UE, Congiu T, Marchese M. The shape modulation of osteoblst-osteocyte transformation and its correlation with the fibrillar organization in secondary osteons. Cell Tissue Res. 2010;340:533–540. doi: 10.1007/s00441-010-0970-z. [DOI] [PubMed] [Google Scholar]
- Pazzaglia UE, Congiu T, Zarattini G. The fibrillar organisation of the osteon and cellular aspects of its development. Anat Sci Int. 2011a;86:128–134. doi: 10.1007/s12565-010-0099-x. [DOI] [PubMed] [Google Scholar]
- Pazzaglia UE, Zarattini G, Giacomini D. Morphometric analysis of the canal system of cortical bone. An experimental study in the rabbit femur carried out with standard histology and micro-CT. Anat Histol Embryol. 2011b;39:17–26. doi: 10.1111/j.1439-0264.2009.00973.x. [DOI] [PubMed] [Google Scholar]
- Pazzaglia UE, Beluffi G, Benetti A. A review of the actual knowledge of the processes governing growth and development of long bones. Fetal Pediatr Pathol. 2011c;30:199–208. doi: 10.3109/15513815.2010.524693. [DOI] [PubMed] [Google Scholar]
- Pazzaglia UE, Congiu T. The cast imaging of the osteon lacunar-canalicular system and the implications with functional models of intracanalicular flow. J Anat. 2012;222:193–202. doi: 10.1111/joa.12004. [DOI] [PMC free article] [PubMed] [Google Scholar]
- Pazzaglia UE, Congiu T, Franzetti E. A model of osteoblast-osteocyte kinetics in the development of secondary osteons in rabbits. J Anat. 2012a;220:372–383. doi: 10.1111/j.1469-7580.2012.01477.x. [DOI] [PMC free article] [PubMed] [Google Scholar]
- Pazzaglia UE, Congiu T, Marchese M. The canalicular system and the osteoblast domain in human secondary osteons. Anat Histol Embryol. 2012b;41:410–418. doi: 10.1111/j.1439-0264.2012.01150.x. [DOI] [PubMed] [Google Scholar]
- Pazzaglia UE, Congiu T, Marchese M. Morphometry and patterns of lamellar bone in human Haversian systems. Anat Rec. 2012c;295:1421–1429. doi: 10.1002/ar.22535. [DOI] [PubMed] [Google Scholar]
- Polig E, Jee WSS. A model of osteon closure in cortical bone. Calcif Tissue Int. 1990;47:261–312. doi: 10.1007/BF02555907. [DOI] [PubMed] [Google Scholar]
- Power J, Noble BS, Loveridge N. Osteocyte lacunar occupancy in the femoral neck cortex: an association with cortical remodelling in hip fracture cases and controls. Calcif Tissue Int. 2001;69:13–19. doi: 10.1007/s00223-001-0013-6. [DOI] [PubMed] [Google Scholar]
- Power J, Loveridge N, Rushton N. Osteocyte density in aging subjects is enhanced in bone adjacent to remodeling haversian systems. Bone. 2002;30:859–865. doi: 10.1016/s8756-3282(02)00731-7. [DOI] [PubMed] [Google Scholar]
- Power J, Doube M, van Bezoolien RL. Osteocyte recruitment declines as the osteon fills in: interacting effects of osteocytic sclerostin and previous hip fractures on the size of cortical canals in the femoral neck. Bone. 2012;50:1107–1114. doi: 10.1016/j.bone.2012.01.016. [DOI] [PubMed] [Google Scholar]
- Qiu S, Fyhrie DP, Paluitkar S. Histomorphometric assessment of Haversian canal and osteocyte lacunae in different size osteons in human rib. Anat Rec. 2003;272A:520–525. doi: 10.1002/ar.a.10058. [DOI] [PubMed] [Google Scholar]
- Robling AG, Stout SD. Morphology of the drifting osteon. Cells Tissue Organs. 1999;164:192–204. doi: 10.1159/000016659. [DOI] [PubMed] [Google Scholar]
- Shabar R, Lukas C, Papo S. Characterization of the spatial arrangement of secondary osteons in the diaphysis of equine and canine long bones. Anat Rec. 2011;294:1093–1102. doi: 10.1002/ar.21405. [DOI] [PubMed] [Google Scholar]
- Skedros JG, Grunander TR, Hamrick HM. Spatial distribution of osteocyte lacunae in equine radii and third metacarpals: consideration for cellular communication, microdamage detection and metabolism. Cells Tissue Organs. 2005;180:215–236. doi: 10.1159/000088938. [DOI] [PubMed] [Google Scholar]
- Skedros JG, Clark GC, Sorenson SM. Analysis of the effect of osteon diameter on the potential relationship of osteocyte lacunae density and osteon wall thickness. Anat Rec. 2011;294:1472–1485. doi: 10.1002/ar.21452. [DOI] [PMC free article] [PubMed] [Google Scholar]
- Smith JW. Age changes in the organic fraction of bone. J Bone Joint Surg. 1963;45B:761–769. [PubMed] [Google Scholar]
- Vigorita VJ. Orthopaedic Pathology. 2nd edn. Philadelphia: Lippincott, Williams & Wilkins; 2008. [Google Scholar]