

Abstract
Multimodal imaging offers the potential to improve diagnosis and enhance the specificity of photothermal cancer therapy. Toward this goal, we have engineered gadolinium-conjugated gold nanoshells and demonstrated that they enhance contrast for magnetic resonance imaging, X-Ray, optical coherence tomography, reflectance confocal microscopy, and two-photon luminescence. Additionally, these particles effectively convert near-infrared light to heat, which can be used to ablate cancer cells. Ultimately, these studies demonstrate the potential of gadolinium-nanoshells for image-guided photothermal ablation.
Keywords: gadolinium, gold-silica nanoshell, magnetic resonance imaging, X-ray imaging, optical coherence tomography, reflectance confocal microscopy, two-photon luminescence, photothermal ablation
1. Introduction
Photothermal therapy in cancer medicine has garnered increasing attention over the past two decades because of the ability to locally ablate disease while leaving surrounding, normal tissue unharmed.[1] This approach is feasible with the addition of exogenous optical absorbers, which by design are normally benign but strongly absorb specific wavelengths of light and subsequently dissipate this energy as heat. Near-infrared (NIR) light in the range of 650 – 900 nm is ideally suited for this purpose because the major tissue chromophores are minimally absorptive within this spectral region, allowing deep and harmless penetration.[2,3] If tissue temperatures on the order of ~50 – 55 °C are achieved,[4] irreversible membrane rupturing occurs to elicit cell death.[5] Furthermore, this heating effect is only realized where light and the optical absorbers are locally combined, thus affording more site-specific therapy than standard chemotherapeutic regimens, for instance, which kill both healthy and diseased cells.
To ensure that the entirety of the tumor tissue is irradiated with NIR light, diagnostic imaging technologies can be employed to elucidate the extent of disease spread. Because many of these technologies provide unique perspectives and associated advantages, combining platforms in multimodal diagnostic approaches facilitates more holistic characterization of disease compared to using any one imaging mode alone.[6–8]For example, anatomic imaging platforms like magnetic resonance (MR) and computed tomography (CT) can be used to initially identify suspicious lesions, while optical modalities can subsequently hone in at the molecular level to enable accurate diagnosis. Then if deemed necessary, photothermal therapy with optical absorption agents can be applied to locally ablate disease at identified sites of interest.
To facilitate and streamline each of these steps in multimodal image-guided photothermal therapy, multifunctional nanoparticle platforms can be employed. With the administration of a single, appropriately designed nanoparticle agent, imaging contrast enhancement and improved sensitivity can be achieved across modalities along with subsequent absorption of NIR light for thermal destruction of tumor tissue. Herein, we describe gadolinium-conjugated gold-silica nanoshells that function as probes in MRI, X-ray, and optical imaging as well as absorptive agents in photothermal therapy. These particles contain a specific gold-silica shell-core geometry[9] that exhibits surface plasmon resonance (SPR) and maximum light extinction within the NIR region. Additionally, the gold surface layer affords biocompatibility,[10–12] facile surface conjugation chemistry via sulfur-gold linkages, and attenuation of X-ray radiation because of its associated high atomic number and electron density.[13]
Previously, light scattering by gold nanoshells was exploited as contrast in a variety of optical imaging applications, including dark field microscopy in vitro,[14] reflectance confocal microscopy (RCM) ex vivo,[15] and optical coherence tomography (OCT) both in vitro[16,17]and in vivo.[18] Light absorption has also been harnessed for two-photon luminescent (TPL) imaging contrast[19] and photothermal ablation of cancer,[20] each performed in vitro and in vivo. After particle conjugation to gadolinium, we demonstrate their broad functionality as contrast agents across MRI, X-ray, and three optical imaging methods: OCT, RCM and TPL. We also show significantly improved MRI contrast enhancement efficacy when gadolinium chelates are conjugated to gold nanoshells. Finally, we confirm that these particles are efficient photothermal converters and can be employed to ablate cancer cells in vitro.
2. Results and Discussion
Gold-silica nanoshells were synthesized according to a four-step procedure as previously described by Oldenburg et al.[9] After forming a ~16 nm gold shell over ~120 nm silica core nanoparticles, nanoshells displayed an average diameter of 152 ± 10 nm, imaged by transmission electron microscopy (TEM, Figure 1A and B). Measurements were acquired and tabulated within NIH ImageJ software (n = 215). Additionally, characterization with UV-Vis spectroscopy demonstrated nanoshell plasmon resonance and maximum extinction at approximately 800 nm, which is within the biologically relevant NIR water window (Figure 1C).
Figure 1.
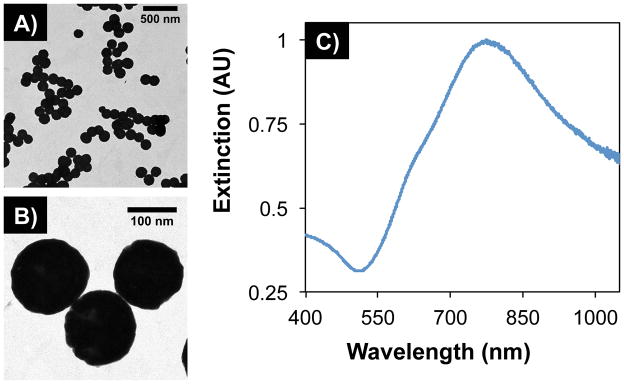
TEM images of gold-silica nanoshells at (A) low and (B) high magnification. Particles displayed an average diameter of 152 ± 10 nm (n = 215, polydispersity = 6.70%). (C) UV-Vis spectroscopy showed maximum extinction within the near-infrared water window, where light has deep penetration into tissue.
Gadolinium conjugation to gold nanoshells was performed by first employing a heterobifunctional poly(ethylene glycol) (PEG)linker with a succinimidyl proprionate (SPA) end-group for reacting with an aminated Gd(III) chelator and an orthopyridyl disulfide (OPSS) for eventual adsorption to gold (Scheme 1). Tetraazacyclododecane tetraacetic acid (DOTA) was chosen as the chelator because of the high stability of Gd(DOTA) relative to other cyclic complexes[21] and the availability of established metalation procedures.[22,23] Once synthesis of OPSS-PEG-DOTA was confirmed with gel permeation chromatography (GPC, Supporting Information Figure S1), a metalation reaction with gadolinium chloride (GdCl3) was conducted to form OPSS-PEG-Gd(DOTA). Additional characterization on OPSS-PEG-DOTA and OPSS-PEG-Gd(DOTA) was perfomed with proton nuclear magnetic resonance (NMR) spectroscopy (Supporting Information, Figure S2). The polymer chains with chelated Gd(III) ions were then incubated with gold-silica nanoshells, during which time the chains self-assembled onto the gold surface via sulfur-gold interactions. Remaining gold surface area was backfilled with PEG-thiol (PEG-SH) to further passivate particle surfaces and enhance stability in suspension. Following particle conjugation, hydrodynamic diameters were observed to increase by ~40% and zeta potential values by ~30% (Supporting Information Table S1).
Scheme 1.

Scheme for OPSS-PEG-Gd(DOTA) synthesis and eventual conjugation to nanoshell surfaces. (1) OPSS-PEG-SPA (MW = 2 kDa) was conjugated to an aminated derivative of DOTA, a strong chelator of Gd(III)ions, via an amide bond. (2) Following acid-mediated removal of tert-Butyl esters, (3) OPSS-PEG-DOTA was mixed with GdCl3 at basic pH to facilitate chelation. (4) OPSS-PEG-Gd(DOTA) chains were then adsorbed onto gold-silica nanoshell surfaces via gold-sulfur interactions, and (5) PEG-SH (MW = 5 kDa) was used to backfill remaining gold surface area and promote further stabilization. Abbreviations: OPSS, orthopyridyl disulfide; PEG, poly(ethylene glycol); SPA, succinimidyl proprionate; DOTA, tetraazacyclododecane tetraacetic acid; DMF, N,N-dimethylformamide; DIPEA, N,N-diisopropylethylamine; TFA, trifluoroacetic acid; DCM, dichloromethane; GdCl3, gadolinium chloride; PEG-SH, poly(ethylene glycol)-thiol.
The degree of gadolinium conjugation was quantitatively evaluated via elemental analysis with inductively coupled plasma mass spectrometry (ICP-MS). After acid mediated digestion of the particles, ICP-MS showed an average of 3.5 ± 0.1× 10⁴Gd(III) ions/nanoshell (n = 3). While this analysis was performed on the batch of gadolinium-nanoshells (Gd-NS) used throughout the work presented herein, the chemical conjugation methods were found to be reproducible. Across 12 particle-conjugate batches, the average Gd content was 3.9 ± 0.5 × 10⁴ ions/nanoshell, translating to a variability of ~13%. Additionally, nanoshell samples were pelleted by centrifugation, and analysis on the supernatant with ICP-MS revealed that ~99.9% of the total Gd content in the Gd-NS samples was in fact conjugated.
Gadolinium complexes are known to shorten the longitudinal relaxation time (T1) of water protons because of the metal ion’s high magnetic moment and symmetric electronic ground state[21]. T1 relaxation times for Gd-NS at various concentrations in water were acquired with a 1.41 T benchtop relaxometer at 37 °C and compared to those of OPSS-PEG-Gd(DOTA) at equivalent gadolinium concentrations and nanoshells conjugated only to PEG-SH (PEG-NS) at equivalent nanoshell concentrations (n = 6, Figure 2). At the highest nanoshell concentrations tested, for instance, Gd-NS exhibited a T1 relaxation time of 462 ± 2 ms as compared to 3,269 ± 4 ms for PEG-NS and 3,842 ± 2 ms for water alone, indicating that the contribution of the nanoshells themselves to relaxation remains low (Figure 2B). This observation is in agreement with previous studies that have shown only nominal relaxation enhancements with gold and silicon nanomaterials without gadolinium content.[24,25] Therefore, the gadolinium present on the surfaces of Gd-NS is principally responsible for the observed decreases in relaxation times. Additionally, when comparing OPSS-PEG-Gd(DOTA) and Gd-NS at their highest tested gadolinium concentrations, the PEG linker showed a longer T1 relaxation time of 1,677 ± 1 ms versus 462 ± 2 ms for Gd-NS (Figure 2A). This trend was consistent across all gadolinium concentrations tested. Furthermore, the ability of any material to act as an MRI contrast agent is defined in terms of relaxivity, where r1 relaxivity is defined as the change in T1 relaxation rates of water protons normalized to gadolinium content. The calculated r1 values of 7 mM−1s−1 for OPSS-PEG-Gd(DOTA) and 37 mM−1s−1 for Gd-NS (per Gd) clearly demonstrate the enhanced relaxivity of the gadolinium complexes once conjugated to gold nanoshell surfaces (Figure 2C and 2D).
Figure 2.

Benchtop relaxometry (1.41 T, 37 °C) showed gadolinium-nanoshells (Gd-NS) decreased T1 relaxation times compared to controls and exhibited high r1 relaxivity. Gd-NS showed lower T1 relaxation times as compared to (A) OPSS-PEG-Gd(DOTA) (PEG-Gd) at equivalent gadolinium concentrations, (B) PEG-nanoshells (PEG-NS) at equivalent nanoshell concentrations, and (A and B) water as a control. All groups are significantly different from one another in (A) and (B) by ANOVA and post-hoc Tukey HSD (p < 0.05, n = 6). Error bars indicate standard deviation. (C) Decreases in T1 relaxation times for Gd-NS translated to a high r1relaxivity value (37 mM−1 s−1), ~9 times greater than that of clinical Gd(DOTA) agents (~4 mM−1 s−1), and (D) ~5 times greater than that of PEG-Gd (7 mM−1 s−1). *p < 0.05 by Student’s t-test, n = 5. Error bars represent standard deviation.
This observed enhancement in relaxivity from OPSS-PEG-Gd(DOTA) to Gd-NS is likely a result of the restricted molecular tumbling and therefore increased τR rotational correlation times of the Gd-chelates after conjugation to nanoshell surfaces. Solomon, Bloembergen, and Morgan have previously described that increases in τR rotational correlation times result in increased r1 relaxtivities.[21,26] In fact, the r1 value for Gd-NS is ~9 times higher than that of current, clinical Gd-based agents (~4 mM−1s−1 per Gd).[21,26] Per particle r1 relaxivity for Gd-NS is 1.31 × 10⁶ mM−1s−1 because of the high density of Gd(III) ions on each nanoshell surface. Other studies have also demonstrated relaxivity enhancements with gadolinium complexes tethered to nanomaterial platforms. For example, Song et al. conjugated Gd-chelates to 30 nm gold nanoparticles via thiol-terminated DNA and achieved an r1 relaxivity of 20 mM−1s−1 per Gd at 1.41 T and 37 °C.[27] Similarly, Morrigi and colleagues enshrouded ~5 nm gold nanoparticles in a rigid layer of directly thiolated Gd-chelates and observed an r1 value of 50 mM−1s−1 per Gd at 1.41 T and 25 °C.[25]
An evaluation of Gd-NS cytotoxicity was performed using the MTS assay, an established method for determining the effect of nanoparticles on cell metabolic activity and hence viability.[28] In live cells, mitochondrial dehydrogenase enzymes convert the MTS reagent (3-(4,5-dimethylthiazol-2-yl)-5-(3-carboxymethoxyphenyl)-2-(4-sulfophenyl)-2H-tetrazolium) to a formazan product detectable via absorbance measurements. Both hepatocellular carcinoma HepG2 cells and human dermal fibroblasts (HDF’s) were employed, both common cell types for characterizing nanoparticle toxicity.[28] Nanoparticle concentrations spanning 0 to 15,000 particles/cell were tested, a range which includes previously reported and anticipated exposure levels of 1 – 100 particles/cell for nano-sized systems in vivo.[29,30] Both Gd-NS and PEG-NS were incubated with HepG2 and HDF cells for 24 and 48 h, at which times the MTS assay was performed. Across all particle concentrations tested for both timepoints, no statistically significant decrease in cell viability was observed, demonstrating suitable biocompatibility of the nanoshell conjugates (Figure 3).
Figure 3.

Gadolinium-nanoshells (Gd-NS) demonstrated no toxicity in vitro with (top row) HepG2 cells and (bottom row) human dermal fibroblasts (HDF’s) at (left column) 24 h and (right column) 48 h up to 15,000 particles/cell, as determined by an MTS cytotoxicity assay. Cell viability levels were statistically equivalent among the tested concentrations of Gd-NS and PEG-nanoshells (PEG-NS) by ANOVA. Error bars represent standard deviation (n = 3).
Next, Gd-NS were encapsulated in 1% agarose at a concentration of 4.2 × 10¹¹ particles/ml and exhibited strong positive contrast compared to agarose-only control phantoms across five diagnostic imaging modalities: T1-weighted magnetic resonance imaging (MRI, Philips Ingenia 3 T with an inversion recovery pulse sequence), X-Ray (Kubtec XPERT80), optical coherence tomography (OCT, Nirus Imalux 1310), reflectance confocal microscopy (RCM, VivaScope 2500), and two-photon luminescence (TPL, Zeiss Laser Scanning Microscope 510) (Figure 4). With MR and X-ray imaging, the entirety of the phantom could be imaged at the macroscale within a single acquisition. Furthermore with optical modalities such as OCT and RCM, imaging across tens to hundreds of microns was feasible. Finally TPL facilitated even higher resolution imaging where individual particles could be resolved at high (63X) magnification. By comparison, phantoms loaded with PEG-NS demonstrated no contrast under MR as expected, considering the relatively small reductions in T1 times for PEG-NS observed during relaxometry characterization. However, PEG-NS exhibited signal intensity levels similar to that of Gd-NS across all other modalities because of near identical spectral properties between the two particle types.
Figure 4.

Gadolinium-nanoshells (Gd-NS) dispersed within agarose phantoms exhibited positive contrast across five imaging modalities: T1-weighted magnetic resonance imaging (MRI), X-Ray, optical coherence tomography (OCT), reflectance confocal microscopy (RCM), and two-photon luminescence (TPL). Phantoms with PEG-conjugated nanoshells (PEG-NS) offered no contrast under MR, similar to the 1% agarose control phantom, but comparable levels of contrast to Gd-NS with the four other modalities. Red circles in T1-MRI column added post image acquisition to outline phantoms. Axes below indicate the plane across which phantom images were acquired within each column.
In addition to their utility as diagnostic contrast agents, Gd-NS are efficient absorbers of NIR light, whereupon this energy is converted to heat that can be employed to locally ablate cancer tissue. To evaluate the potential for Gd-NS to be used in photothermal cancer therapy, a photothermal conversion study was performed. Particles were suspended in water (n = 3) at three optical densities (OD800 = 1, 2, and 4 corresponding to 0.25, 0.5, and 1.0 × 10¹⁰ particles/ml) and then irradiated at 808 nm for 3 min at three laser power settings (1.25, 2.5 and 5 W). Both PEG-NS and water were also irradiated for comparison. Temperature readings acquired with a thermocouple indicated that Gd-NS and PEG-NS suspensions heated to higher temperatures with increasing particle concentrations and higher laser powers (Figure 5). No statistical difference was found in the maximum temperatures recorded for Gd-NS and PEG-NS at any given particle concentration and laser power combination, indicating that the presence of the gadolinium on the exterior of the nanoshell does not inhibit photothermal conversion. In contrast, water controls without nanoshells exhibited minimal heating above room temperature across all laser powers tested.
Figure 5.
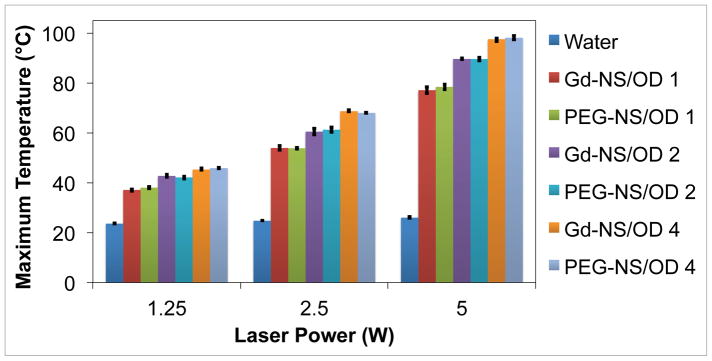
Gadolinium-nanoshells (Gd-NS) converted NIR light to heat as effectively as PEG-nanoshells (PEG-NS). Maximum temperature values after a 3 min irradiation period at 808 nm are displayed for nanoshells in water at three different concentrations (OD800 = 1, 2, and 4, corresponding to 0.25, 0.5, and 1 × 10¹⁰ particles/ml respectively). Laser power was also varied at 1.25, 2.5, and 5 W. Water alone was used as a control and shows minimal heating above room temperature (~22 °C) at all powers tested. All particle concentration/laser power combinations are significantly different from others and water control, p < 0.05 by ANOVA and post hoc Tukey HSD, n = 3. Error bars indicate standard deviation.
The ability of Gd-NS to convert NIR light to heat also enabled ablation of cancer cells (Figure 6). The particles were incubated with B16-F10 melanoma cells in vitro at a ratio of 7,500 particles per cell for 2 h. Media alone, without particles in suspension, was also incubated with the melanoma cells for comparison. Cells were irradiated at 808 nm at 35 W/cm2 for 3 min and later stained with calcein AM and ethidium homodimer-1 to indicate areas of live and dead cells respectively by fluorescence microscopy. For cells incubated with Gd-NS before NIR laser exposure, viability staining depicted an area of dead cells corresponding to the irradiation zone. By comparison, irradiated cells without nanoshells remained viable, indicating that NIR light by itself is benign. Sufficient heating to kills cells was only achieved where the NIR light and particles were combined locally, a finding in accordance with photothermal conversion studies and previously published work on the gold-silica nanoshell platform.[1] Finally, non-irradiated cells exposed to Gd-NS or media alone remained viable in either case, indicating that the particles alone were harmless to the cells.
Figure 6.

(A) Gadolinium-nanoshells (Gd-NS) effectively ablated B16-F10 melanoma cells after particle incubation and NIR exposure (808 nm, 35 W/cm2, 3 min). Fluorescent viability staining was performed with calcein AM, which shows live cells in green, and ethidium homodimer-1, which depicts dead cells in red. The red area of cell death indicates the irradiation zone. (B) Cells irradiated under the same conditions with no prior particle incubation remained viable. Non-irradiated cells incubated (C) with and (D) without particles also remained viable. Scale bar = 300 μm.
Additionally, Gd-NS demonstrated effective contrast enhancement in an animal model with MRI, X-ray, and optical methods. After an intratumoral injection of Gd-NS (50 μl at 6.3 × 10¹² NS/ml) in a subcutaneous B16-F10 melanoma tumor in a mouse, higher signal intensity was observed in tumor tissue with particles under both T1-MRI and X-ray (Figure 7). As with the agarose phantoms, the entire tumor was imageable in the context of the mouse anatomy with each of these modalities. Tumor tissue was then harvested and imaged ex vivo with OCT, RCM, and TPL imaging modes. In the case of OCT, the highest signal intensities overall were observed within a few hundred microns of the tumor surfaces (Figure 8). Within the first 250 μm, tumor tissue with nanoshells demonstrated 31.5% higher intensity than that of tumor tissue without particles (Figure 8C). Both RCM and TPL enabled further microscopic imaging, which exhibited readily apparent contrast enhancement in tumor tissue with Gd-NS compared to the control tissue without nanoshells (Figure 9). Furthermore, as similarly seen in the agarose phantoms, individual particles could be resolved with TPL imaging at high magnification.
Figure 7.

Subcutaneous B16-F10 melanoma tumors in mice showed positive contrast enhancement with T1-MRI and X-ray after an intratumoral injection of gadolinium-nanoshells (Gd-NS, 50 μl at 6.3 × 10¹² particles/ml). (A and B) Contrast was confined to the tumor volume compared to (C and D) tumor tissue without nanoshells. Red circles denote tumors along the right flank.
Figure 8.

Optical coherence tomography (OCT) showed increased contrast along the imaged B16-F10 tumor surface ex vivo (A) with gadolinium-nanoshells (Gd-NS) as compared to (B) tissue without nanoshells. (C) The overall average intensity within the first 250 μm is significantly higher than that of tissue without particles. *p<0.05 by Student’s t test, n = 1530 pixels. Error bars represent standard deviation.
Figure 9.

With reflective confocal microscopy (RCM) and two-photon luminescence (TPL), gadolinium-nanoshells (Gd-NS) offered (A and B) readily apparent contrast enhancement in B16-F10 melanoma tumor tissue ex vivo compared to (C and D) tissue without nanoshells. (B, inset) High magnification imaging with TPL enabled resolution of individual particles.
3. Conclusions
In summary, we have successfully tethered gadolinium to near-infrared resonant gold-silica nanoshells, imparting high r1 relaxivity. These nanoshell conjugates subsequently afford contrast enhancement across a range of diagnostic modalities, with resolutions spanning anatomic to sub-cellular length scales, thus facilitating application for image-guided photothermal therapy. MRI and X-ray based modalities with gadolinium-nanoshell enhancement could be used to initially identify suspicious lesions within tissue. Afterwards, optical imaging with low-power NIR light could then be performed within appropriate fields of view to obtain molecular information regarding disease state. Such optical modes include OCT, RCM, and TPL, which all exhibit increased signal intensities with the addition of gadolinium-nanoshells. Finally, if therapy is deemed necessary, higher-powered NIR light can then be applied site-specifically to locally ablate disease, leaving surrounding normal tissue unharmed.
While the methods herein were applied to a superficial melanoma tumor model for initial proof-of-concept, these techniques could also be employed for more deep-seated tumors. With unlimited penetration depths through tissue, MRI and X-ray based modes have routinely been used for visualizing embedded anatomies. However, imageable depths for the optical methods described here are confined to the order of several hundred microns to millimeters. At the same time, recent developments in microendoscopy and fiber bundle design are enabling access and administration of light to deep tissue.[31]
Beyond their current broad utility, gadolinium-nanoshells offer a platform technology with potential for additional functionality and complexity. For instance, with the incorporation of targeting ligands, such as peptides, proteins, or nucleic acid based aptamers, gadolinium-nanoshells could home to desired receptors or molecular markers on diseased cells. These methods may provide more information regarding molecular phenotypes, which can be useful in characterizing disease and predicting invasiveness.[32,33]
4. Experimental Section
Gold-Silica Nanoshell Synthesis
All glassware used in nanoparticle synthesis was cleaned with aqua regia (75% 12 N hydrochloric acid and 25% 16 N nitric acid by volume) followed by thorough rinsing with ultrapure water. Gold-silica shell-core nanoshells were synthesized via a seed-mediated growth process as described previously by Oldenburg et al.[9] Silica nanoparticles ~120 nm in diameter (Precision Colloid) were coated with positively charged amine groups using 3-aminopropyl triethoxy silane (APTES, Gelest). Negatively charged colloidal gold ~3 – 5 nm in size and synthesized according to methods by Duff et al.[34]was then adsorbed onto the aminated silica particles. These small gold particles served as nucleation sites for the formation of the thin gold shell over the silica core in the final reduction reaction with chloroauric acid (HAuCl4, Alfa Aesar, 99.999%) and formaldehyde (HCHO, 37%). The gold-silica nanoshell product demonstrated peak extinction at ~800 nm by UV-Vis spectroscopy (Cary 50 Bio) and an average diameter of 152 ± 10 nm by transmission electron microscopy (TEM, JEOL 1230, Figure 1). Nanoshells were stored in 1.8 mM K2CO3 at 4 °C until the conjugation reactions below were performed. Both the Beer-Lambert law and Mie theory were employed to determine nanoshell concentration as described elsewhere.[35–38]
OPSS-PEG-DOTA Synthesis
Chelated gadolinium ions were tethered to nanoshell surfaces with an orthopyridyl disulfide-poly(ethylene glycol)-succinimidyl propionate linker (OPSS-PEG-SPA, Nektar Therapeutics, MW = 2000 Da). The PEG linker was first conjugated to an aminated gadolinium chelator, tetraazacyclododecane tetraacetic acid (DOTA) (2-aminoethyl-mono-amide-DOTA-tris(t-Bu ester), Macrocyclics). To perform this reaction, the DOTA derivative (1.5 mmol) was added to anyhydrous N,N-dimethylformamide (DMF, Sigma Aldrich, 99.8%, 6 ml) followed by N,N-diisopropylethylamine (DIPEA, Sigma Aldrich, 99.5%, 3 mmol) in an amber glass vial, and the mixture was vortexed for 1 min to ensure complete dissolution. Next, OPSS-PEG-SPA (0.15 mmol) was added to achieve a 10:1 DOTA:PEG molar ratio. The vial was quickly purged with ultra high purity nitrogen gas, capped, vortexed for an additional 1 min, and then rocked overnight at room temperature. The next day, the sample was diluted 1:4 with ice-cold ultrapure water and then transferred to a regenerated cellulose dialysis membrane (Spectrum Laboratories, MWCO = 2000 Da). The sample was dialyzed against ultrapure water followed by lyophilization. To deprotect the – COOH groups on the DOTA derivative, the lyophilized product was added to an amber glass vial followed by dichloromethane (DCM, EMD Millipore OmniSolv®, 4.18 ml) and trifluoroacetic acid (TFA, J.T. Baker, 2.61 ml). The vial was then purged with ultra high purity nitrogen, capped, and left to rock overnight at room temperature. The next day, the solvent was removed by rotary evaporation (Büchi Rotavapor R-200, 40 °C, 200 mbar) over approximately 10 min. The residual solid was washed three times with ethyl ether (EMD, OmniSolv®, 100 ml) prechilled to 4 °C while decanting the ethyl ether after each wash. After air drying the solid at room temperature for 4 h, the product was dissolved in ultrapure water, dialyzed against ultrapure water (2000 MWCO regenerated cellulose, Spectrum Laboratories), lyophilized, and then stored at −20 °C until further use. Over 90% of the PEG linker was found to be conjugated to the gadolinium chelator as determined by gel permeation chromatography (GPC, Agilent Technologies, PLgel 5 μm 500 Å column with PL ELS 1000 detector, Figure S1).
Gadolinium Chelation to form OPSS-PEG-Gd(DOTA)
A gadolinium chelation reaction with methods adapted from Ratzinger et al.[22] and Sosabowski and Mather[23] was performed. First, a single solution at 200 mM gadolinium(III) chloride hexahydrate (GdCl3 • 6H2O, Sigma Aldrich, 99%) and 600 mM citric acid was made with ultrapure H2O and adjusted to pH 8 with sodium hydroxide (NaOH). The gadolinium-citric acid solution (10 ml) was added to OPSS-PEG-DOTA (70 mg) in a glass vial to achieve a Gd:DOTA molar ratio of approximately 70:1. The vial was rocked for 48 h at 37 °C to facilitate metalation. Excess gadolinium was removed by dialysis against 100 mM sodium citrate followed by ultrapure water. The retentate was recovered, lyophilized, and stored at −20 °C until further use. Successful chelation was confirmed by inductively coupled plasma optical emission spectrometry (ICP-OES, Perkin Elmer Optima 4300 DV), after dissolving the solid OPSS-PEG-Gd(DOTA) in pure aqua regia overnight. Samples were then diluted with 1% aqua regia. With the analyte wavelength set to 342 nm for gadolinium and yttrium as the chemical reference at 371 nm, gadolinium content was calculated to be ~0.082 g Gd/g OPSS-PEG-Gd(DOTA). Further characterization of OPSS-PEG-Gd(DOTA) and OPSS-PEG-DOTA in deteurium oxide (D2O) was performed with proton nuclear magnetic resonance spectroscopy (NMR, Varian, 400 MHz); these results are outlined in the Supporting Information (Figure S2).
OPSS-PEG-Gd(DOTA) Conjugation to Nanoshells
To tether chelated gadolinium to gold-silica nanoshells, the particles were first suspended in ultrapure water (180 ml) at a concentration of ~4.0 × 10⁹ particles/ml. OPSS-PEG-Gd(DOTA) (2 ml) at a concentration of 600 μg/ml in ultrapure water was added to the nanoshell suspension, which was then mixed for 1 h at 4 °C. Remaining gold surface area on the particles was then backfilled with poly(ethylene glycol)-thiol (PEG-SH, Laysan Bio, MW = 5000 Da) by addition of 10 μM PEG-SH (20 ml) in ultrapure water and further mixing of the nanoshell suspension overnight at 4 °C. Gold-silica nanoshells conjugated to PEG-SH only (without any addition of OPSS-PEG-Gd(DOTA)) were also prepared as a control for relaxometry characterization and imaging experiments to follow. Three rounds of centrifugation were performed to concentrate the particles and remove unreacted molecules. Nanoshell conjugates were stored at 4 °C until further use. To quantify the degree of gadolinium conjugation, elemental analysis was performed with inductively coupled plasma mass spectrometry (ICP-MS, Perkin Elmer ELAN 9000). After overnight digestion with pure aqua regia and dilution with 1% aqua regia, gadolinium-nanoshells (Gd-NS) were calculated to have an average of 3.5 × 10⁴ Gd ions per nanoshell (n = 3). Additionally, unconjugated gadolinium was found to constitute approximately 0.1% of the total gadolinium content by ICP-MS analysis on the supernatant collected after the final round of centrifugation, indicating that the purification procedure was successful.
Dynamic Light Scattering and Zeta Potential Characterization
Following nanoshell conjugation, characterization of hydrodynamic diameter and zeta potential was performed with a Malvern Zen 3600 Zetasizer. Gadolinium-nanoshells were dispersed in ultrapure water and measurements were acquired in triplicate. Both PEG-nanoshells and unconjugated nanoshells were analyzed for comparison. Table 1 in Supporting Information displays these results.
Relaxometry Characterization
T1 relaxation times of Gd-NS were acquired with a benchtop relaxometer (Bruker Minispec mq60, 1.41 T, 37 °C) and compared to that of PEG-nanoshells (PEG-NS), OPSS-PEG-Gd(DOTA), and ultrapure water as controls. Measurements (n = 6) were taken with Gd-NS in water at five concentrations (8.6, 4.3, 2.2, 1.1, and 0.5 × 10¹¹ nanoshells/ml) corresponding to gadolinium concentrations of 50, 25, 13, 6, and 3 μM. PEG-NS and OPSS-PEG-Gd(DOTA) in water at equivalent nanoshell and gadolinium concentrations, respectively, were also analyzed. All samples (200 μl at room temperature) were thermostated to the magnet temperature by inserting them into the instrument and waiting 2 min before data acquisition.
Evaluation of Cytotoxicity
Cytotoxicity of the gadolinium-nanoshells was evaluated using the 3-(4,5-dimethylthiazol-2-yl)-5-(3-carboxymethoxyphenyl)-2-(4-sulfophenyl)-2H-tetrazolium (MTS) assay. HepG2 hepatocellular carcinoma cells (ATCC) and human dermal fibroblasts (HDF, Lonza) were cultured in DMEM medium supplemented with 10% fetal bovine serum (FBS), 100 U/L penicillin, and 100 mg/L streptomycin and maintained at 37 °C in a 5% CO2 incubator. HepG2 cells were seeded into tissue culture-treated, 96-well plates at 9,000 cells/well. For HDF cells, a lower seeding density of 4,500 cells/well was used because the fibroblasts are larger in size than HepG2 cells. Cells were then allowed to adhere overnight. The next day, the culture medium was removed, and 130 μl fresh medium was added with Gd-NS in suspension to achieve particle-to-cell ratios of 3750, 7500, and 15000. PEG-nanoshells as well as cell only samples without any particles were included for comparison. All conditions were tested in triplicate. After incubating cells with the particles for 24 h and 48 h, 26 μl MTS reagent (Promega) was added to all wells. Following a 1 h incubation period at 37 °C and 5% CO2, media samples were transferred to microcentrifuge tubes and then centrifuged at 735 g for 5 min to completely pellet any nanoparticles in suspension. 100 μl of supernatant was then transferred to a new 96-well plate, and the optical density at 490 nm was measured with a plate reader. Cell viability was then determined with the average OD490 value for each treatment as a percent of the average OD490 for the cell only control condition.
Agarose Phantom Synthesis
Gd-NS (100 μl) in water at 8.6 × 10¹¹ particles/ml were combined with 2% agarose (Sigma Aldrich, 100 μl) in preheated, ultrapure water to ensure complete dissolution of the agarose. Samples were quickly mixed in a small glass vial by gentle vortexing and then chilled at 4 °C to solidify. Agarose phantoms containing PEG-NS were prepared similarly in addition to 1% agarose phantoms without nanoshells as controls.
In Vitro Phantom Imaging
Agarose phantoms were imaged with five imaging modalities: T1-weight magnetic resonance imaging (MRI), X-ray, optical coherence tomography (OCT), reflectance confocal microscopy (RCM), and two-photon luminescence (TPL). MRI was performed with a 3 T clinical scanner (Philips Ingenia) with an inversion recovery pulse sequence (TR = 3000 ms, TE = 15 ms, IR = 875 ms). X-ray imaging was conducted using a Kubtec XPERT80 radiography system with the radiation source set to 27 kV and 850 μA. For OCT imaging, a Niris Imalux system was used with a laser operating at a wavelength of 1310 nm and power of 3 mW. A fiber optic probe connected to the laser source was placed in contact with the tissue phantom for imaging. For RCM, a Lucid-Tech VivaScope 2500 configured with an 840 nm laser at 0.375 mW and a 20X objective was used. Agarose phantoms were placed on glass slides with water between the phantom and glass slide and ultrasound gel between the slide and objective as index matchers. Images were acquired at 32 μm depths. For TPL, a Zeiss Laser Scannning Microscope (LSM) 510 META with a femtosecond-pulsed Ti:sapphire laser (Chameleon) was used. With an output power of ~1 mW, the laser was set to 810 nm to excite nanoshells at their plasmon resonant wavelength while the META detector was configured to collect two-photon luminescence from 450 to 650 nm. Images of phantoms on coverglass were acquired with a 20X objective and 63X immersion oil objective at 20 and 5 μm depths, respectively.
Photothermal Conversion
Both Gd-NS and PEG-NS at three concentrations (10, 5, and 2.5 × 10⁹ particles/ml) in water were irradiated within disposable cuvettes with an FAP-1 diode laser (Coherent) at 808 nm, which coincided with the plasmon resonant wavelength of the nanoshells. Maximum temperature values of the nanoshell suspensions (n = 3) were acquired with a thermocouple (Omegaette HH5500 Temperature Recorder) after three minutes of irradiation at three laser power settings (1.25, 2.5, and 5 W). Water without nanoshells was also used as a control.
In Vitro Photothermal Ablation
B16-F10 melanoma cells (ATCC) were cultured in DMEM medium supplemented with 10% fetal bovine serum (FBS), 100 U/L penicillin, and 100 mg/L streptomycin and maintained at 37 °C in a 5% CO2 incubator. 300,000 B16-F10 melanoma cells per well were seeded into 4-well chamber glass slides and allowed to adhere overnight. After aspiration of the cell culture medium the next day, 500 μl of Gd-NS in DMEM (4.5 × 10⁹ particles/ml) was added to the cells for a ratio of 7,500 particles per seeded cell. DMEM without particles was used as a control. The melanoma cells were then incubated at 37 °C in 5% CO2 for 2 h, during which time the nanoshells settled onto cell surfaces. Following removal of the medium, 200 μl 1X phosphate buffered saline (PBS) was gently added to the cells. Next, cells were irradiated at 808 nm and 35 W/cm2 for 3 min, using the same laser system employed in the photothermal conversion study. Non-irradiated cells incubated with or without Gd-NS were also included for comparison. The PBS was then replaced with DMEM medium, and the cells were incubated at 37 °C in 5% CO2 for 4 h to allow ample time for completion of cell death in response to therapeutic heating. Viability staining was then performed according to manufacturer’s instructions, using calcein AM and ethidium homodimer-1 (Invitrogen). Samples were then imaged under fluorescence microscopy with an inverted Zeiss Axiovert 135 microscope (calcein excitation/emission: 480/535 nm; ethidium homodimer-1 excitation/emission: 560/645 nm).
Animal Tumor Model
B16-F10 cells (1 × 10⁶ in 200 μl PBS) were injected subcutaneously into the right flank of 12-wk old male Nude mice (Nu/Nu, Charles River). Mice were kept on a 12h light-dark cycle with food and water ad libitum. All animal experiments were approved by the Institutional Animal Care & Use Committee (IACUC) of The Methodist Hospital Research Institute and performed in accordance with the institutional guidelines on the ethical use of animals.
Animal Imaging with MRI and X-Ray
Animal imaging experiments were performed 10 – 15 days after B16-F10 cell implantation, once tumors had reached ~1 cm in diameter. In one mouse, nanoshell suspension (50 μl at 6.3 × 10¹² Gd-NS/ml) was injected intratumorally, and the animal was sacrificed immediately post injection. T1-weighted MR images were acquired with a 3 T clinical scanner (Philips Ingenia) using a spin echo sequence (TR = 500 – 700 ms, TE = 23 ms, slice thickness = 500 μm). As a control, a tumored mouse without injected nanoshells was imaged as well at the same settings. For X-ray imaging, animals were imaged as with the agarose tissue phantoms described above, using the Kubtec XPERT-80 radiography system.
Tumor Tissue Optical Imaging Ex Vivo
For optical imaging experiments, the B16-F10 melanoma tumors were resected from the flanks of the mice. The tumors were then sectioned in half along the midline, using a scalpel, and imaging was conducted within the tumor interior. For OCT imaging, a Niris Imalux system similar to the setup described above was employed. Here, a 1310 ± 15 nm laser at 3 mW was used and configured with a fiber optic probe, which was kept ~1 mm above the tumor surface during imaging. After image acquisition, intensity profile analysis with NIH ImageJ software was performed to determine differences in signal intensities between tumor tissue with and without nanoparticles. For each group, a total of 30 profiles with pixel intensity values across 250 μm beneath the tumor surface were acquired. The mean intensity was then calculated by normalizing and averaging all pixel intensity values (n = 1530) within the profiles. For RCM and TPL imaging of the tumor tissue, the same imaging setups and associated parameters were used as with the agarose tissue phantoms described above.
Supplementary Material
Acknowledgments
Funding for this research was provided by the National Institutes of Health Texas Center for Cancer Nanomedicine Excellence (NIH TCCNE). A.J. Coughlin was supported by a National Science Foundation Graduate Research Fellowship (NSF GRF, award number 0940902) and a National Defense Science and Engineering Graduate (NDSEG) Fellowship awarded through the Air Force Office of Scientific Research (AFOSR). The authors would like to acknowledge Dr. Fang Wei of Rice University for helpful discussions on chemical conjugation strategies as well as Dr. Melissa McHale of Rice University for assistance with manuscript editing. Mr. Meng Zhong of The Methodist Hospital Research Institute assisted with B16-F10 cell culture and MR imaging of animals. Drs. Elizabeth Davis and Elizabeth Salisbury of Baylor College of Medicine provided use of the X-Ray Kubtec XPERT80 system. Dr. Rebekah Drezek of Rice University enabled use of the RCM VivaScope 2500 as well as the OCT Nirus Imalux 1310 used during the phantom imaging experiments in vitro. Dr. Kirill Larin and Narendran Sudheendran of the University of Houston permitted and assisted with the use of the OCT Nirus Imalux 1310 for tumor tissue imaging ex vivo. The authors also acknowledge Dr. John Slater of Rice University for assistance with TPL imaging and Dr. Ryan Schweller of Duke University for assistance with proton NMR characterization.
Footnotes
Supporting Information is available on the WWW under http://www.small-journal.com or from the author.
Contributor Information
Dr. Andrew J. Coughlin, Department of Bioengineering, Rice University, 6100 Main Street, MS-142, Houston, TX 77005, USA
Dr. Jeyarama S. Ananta, Department of Translational Imaging, The Methodist Hospital Research Institute, 6565 Fannin Street, Houston, TX 77030, USA
Nanfu Deng, Department of Bioengineering, Rice University, 6100 Main Street, MS-142, Houston, TX 77005, USA.
Prof. Irina V. Larina, Department of Molecular Physiology and Biophysics, Baylor College of Medicine, One Baylor Plaza, Houston, Texas 77030, USA
Dr. Paolo Decuzzi, Department of Translational Imaging, The Methodist Hospital Research Institute, 6565 Fannin Street, Houston, TX 77030, USA
Prof. Jennifer L. West, Email: jennifer.l.west@duke.edu, Department of Biomedical Engineering Duke University, Room 136 Hudson Hall, Box 90281, Durham, NC 27708, USA
References
- 1.Hirsch LR, Stafford RJ, Bankson JA, Sershen SR, Rivera B, Price RE, Hazle JD, Halas NJ, West JL. Proc Natl Acad Sci USA. 2003;100:13549–13554. doi: 10.1073/pnas.2232479100. [DOI] [PMC free article] [PubMed] [Google Scholar]
- 2.Weissleder R. Nat Biotechnol. 2001;19:316–317. doi: 10.1038/86684. [DOI] [PubMed] [Google Scholar]
- 3.Weissleder R, Ntziachristos V. Nat Med. 2003;9:123–128. doi: 10.1038/nm0103-123. [DOI] [PubMed] [Google Scholar]
- 4.Lu W, Melancon MP, Xiong C, Huang Q, Elliott A, Song S, Zhang R, Flores LG, Gelovani JG, Wang LV, Ku G, Stafford RJ, Li C. Cancer Res. 2011;71:6116–6121. doi: 10.1158/0008-5472.CAN-10-4557. [DOI] [PMC free article] [PubMed] [Google Scholar]
- 5.Day ES, Bickford LR, Slater JH, Riggall NS, Drezek RA, West JL. Int J Nanomed. 2010;5:445–454. doi: 10.2147/ijn.s10881. [DOI] [PMC free article] [PubMed] [Google Scholar]
- 6.Weissleder R, Pittet MJ. Nature. 2008;452:580–589. doi: 10.1038/nature06917. [DOI] [PMC free article] [PubMed] [Google Scholar]
- 7.Cherry SR. Semin Nucl Med. 2009;39:348–353. doi: 10.1053/j.semnuclmed.2009.03.001. [DOI] [PMC free article] [PubMed] [Google Scholar]
- 8.Louie AY. Chem Rev. 2010;110:3146–3195. doi: 10.1021/cr9003538. [DOI] [PMC free article] [PubMed] [Google Scholar]
- 9.Oldenburg SJ, Averitt RD, Westcott SL, Halas NJ. Chem Phys Lett. 1998;288:243–247. [Google Scholar]
- 10.Connor EE, Mwamuka J, Gole A, Murphy CJ, Wyatt MD. Small. 2005;1:325–327. doi: 10.1002/smll.200400093. [DOI] [PubMed] [Google Scholar]
- 11.Shukla R, Bansal V, Chaudhary M, Basu A, Bhonde RR, Sastry M. Langmuir. 2005;21:10644–10654. doi: 10.1021/la0513712. [DOI] [PubMed] [Google Scholar]
- 12.Gad SC, Sharp KL, Montgomery C, Payne JD, Goodrich GP. Int J Toxicol. 2012;31:584–594. doi: 10.1177/1091581812465969. [DOI] [PubMed] [Google Scholar]
- 13.Popovtzer R, Agrawal A, Kotov NA, Popovtzer A, Balter J, Carey TE, Kopelman R. Nano Lett. 2008;8:4593–4596. doi: 10.1021/nl8029114. [DOI] [PMC free article] [PubMed] [Google Scholar]
- 14.Loo C, Lowery A, Halas N, West J, Drezek R. Nano Lett. 2005;5:709–711. doi: 10.1021/nl050127s. [DOI] [PubMed] [Google Scholar]
- 15.Bickford LR, Agollah G, Drezek R, Yu TK. Breast Cancer Res Treat. 2010;120:547–555. doi: 10.1007/s10549-009-0408-z. [DOI] [PubMed] [Google Scholar]
- 16.Agrawal A, Huang S, Wei Haw Lin A, Lee M-H, Barton JK, Drezek RA, Pfefer TJ. J Biomed Opt. 2006;11:041121. doi: 10.1117/1.2339071. [DOI] [PubMed] [Google Scholar]
- 17.Loo C, Lin A, Hirsch L, Lee MH, Barton J, Halas N, West J, Drezek R. Technol Cancer Res Treat. 2004;3:33–40. doi: 10.1177/153303460400300104. [DOI] [PubMed] [Google Scholar]
- 18.Gobin AM, Lee MH, Halas NJ, James WD, Drezek RA, West JL. Nano Lett. 2007;7:1929–1934. doi: 10.1021/nl070610y. [DOI] [PubMed] [Google Scholar]
- 19.Park J, Estrada A, Schwartz JA, Diagaradjane P, Krishnan S, Dunn AK, Tunnell JW. Lasers Surg Med. 2010;42:630–639. doi: 10.1002/lsm.20935. [DOI] [PMC free article] [PubMed] [Google Scholar]
- 20.O’Neal DP, Hirsch LR, Halas NJ, Payne JD, West JL. Cancer Lett. 2004;209:171–176. doi: 10.1016/j.canlet.2004.02.004. [DOI] [PubMed] [Google Scholar]
- 21.Hermann P, Kotek J, Kubícek V, Lukes I. Dalton Trans. 2008;23:3027–3047. doi: 10.1039/b719704g. [DOI] [PubMed] [Google Scholar]
- 22.Ratzinger G, Agrawal P, Körner W, Lonkai J, Sanders HMHF, Terreno E, Wirth M, Strijkers GJ, Nicolay K, Gabor F. Biomaterials. 2010;31:8716–8723. doi: 10.1016/j.biomaterials.2010.07.095. [DOI] [PubMed] [Google Scholar]
- 23.Sosabowski JK, Mather SJ. Nat Protoc. 2006;1:972–976. doi: 10.1038/nprot.2006.175. [DOI] [PubMed] [Google Scholar]
- 24.Ananta JS, Godin B, Sethi R, Moriggi L, Liu X, Serda RE, Krishnamurthy R, Muthupillai R, Bolskar RD, Helm L, Ferrari M, Wilson LJ, Decuzzi P. Nat Nanotechnol. 2010;5:815–821. doi: 10.1038/nnano.2010.203. [DOI] [PMC free article] [PubMed] [Google Scholar]
- 25.Moriggi L, Cannizzo C, Dumas E, Mayer CR, Ulianov A, Helm L. J Am Chem Soc. 2009;131:10828–10829. doi: 10.1021/ja904094t. [DOI] [PubMed] [Google Scholar]
- 26.Merbach AE, Tóth É, editors. The Chemistry of Contrast Agents in Medical Magnetic Resonance Imaging. 1. Wiley; Hoboken, NJ: 2001. [Google Scholar]
- 27.Song Y, Xu X, MacRenaris KW, Zhang XQ, Mirkin CA, Meade TJ. Angew Chem Int Ed Engl. 2009;48:9143–9147. doi: 10.1002/anie.200904666. [DOI] [PMC free article] [PubMed] [Google Scholar]
- 28.Lewinski N, Colvin V, Drezek R. Small. 2008;4:26–49. doi: 10.1002/smll.200700595. [DOI] [PubMed] [Google Scholar]
- 29.Boisselier E, Astruc D. Chem Soc Rev. 2009;38:1759–1782. doi: 10.1039/b806051g. [DOI] [PubMed] [Google Scholar]
- 30.Thakor AS, Paulmurugan R, Kempen P, Zavaleta C, Sinclair R, Massoud TF, Gambhir SS. Small. 2011;7:126–136. doi: 10.1002/smll.201001466. [DOI] [PMC free article] [PubMed] [Google Scholar]
- 31.Barretto RPJ, Ko TH, Jung JC, Wang TJ, Capps G, Waters AC, Ziv Y, Attardo A, Recht L, Schnitzer MJ. Nat Med. 2011;17:223–228. doi: 10.1038/nm.2292. [DOI] [PMC free article] [PubMed] [Google Scholar]
- 32.Lu Z, Jiang G, Blume-Jensen P, Hunter T. Mol Cell Biol. 2001;21:4016–4031. doi: 10.1128/MCB.21.12.4016-4031.2001. [DOI] [PMC free article] [PubMed] [Google Scholar]
- 33.Steeg PS. Nat Med. 2006;12:895–904. doi: 10.1038/nm1469. [DOI] [PubMed] [Google Scholar]
- 34.Duff DG, Baiker A, Edwards PP. Langmuir. 1993;9:2301–2309. [Google Scholar]
- 35.Brinson BE, Lassiter JB, Levin CS, Bardhan R, Mirin N, Halas NJ. Langmuir. 2008;24:14166–14171. doi: 10.1021/la802049p. [DOI] [PMC free article] [PubMed] [Google Scholar]
- 36.Erickson TA, Tunnell JW. Gold Nanoshells in Biomedical Applications. In: Kumar C, editor. Nanotechnologies for the Life Sciences. Vol. 3. Wiley-VCH; Weinheim, Germany: 2010. [Google Scholar]
- 37.Averitt RD, Sarkar D, Halas NJ. Phys Rev Lett. 1997;78:4217–4220. [Google Scholar]
- 38.Kreibig U, Vollmer M. Optical Properties of Metal Clusters. Vol. 25. Springer; Berlin, Germany: 1995. [Google Scholar]
Associated Data
This section collects any data citations, data availability statements, or supplementary materials included in this article.