

Abstract
To separate neural signals from noise, brain responses measured in neuroimaging are routinely averaged across space and time. However, such procedures may obscure some properties of neural activity. Recently, multi-voxel pattern analysis methods have demonstrated that patterns of activity across voxels contain valuable information that is concealed by spatial averaging. Here we show that temporal patterns of neural activity contain information that can discriminate different stimuli, even within brain regions that show no net activation to that stimulus class. Furthermore, we find that in many brain regions, responses to natural stimuli are highly context dependent. In such cases, prototypical event-related responses do not even exist for individual stimuli, so that averaging responses to the same stimulus within different contexts may worsen the effective signal-to-noise. As a result, analysis of the temporal structures of single events can reveal aspects of neural dynamics which cannot be detected using standard event-related averaging methods.
Keywords: event-related averaging, inter-subject correlation, signal reliability, natural stimuli
1. Introduction
In the climactic scene of the movie Casablanca, Humphrey Bogart tells Ingrid Bergman “Here's looking at you, kid” and the camera rests for a second on his stony face. The movie viewer's neural responses at this moment can be decomposed into two components: firstly, a generic component that is always observed for any face in the “face” category; secondly, a component that is specific to seeing this particular face at this particular point in the narrative. The generic component and the specific component of the neural response each make up a measurable proportion of our neural activity, and each are worthy of neuroscientific study. However, event-related averaging methods – the standard lens through which cognitive neuroscientists examine their data (Huettel et al., 2009) – do not treat these components equally. Event-related averaging methods are designed to detect the generic (“face” category) component of the response, while treating the exemplar- and context-specific component as noise. However, our mental life is substantially tied to the unique combination of context and features of the present moment. Thus, if we wish to understand the brain activity that occurs in real life, event-related averaging methods may need to be complemented by methods that capture the unique response to each event (Debener et al., 2005; Duann et al., 2002; Goldman et al., 2009; Hasson et al., 2010; McKeown et al., 2003).
But how much is truly lost when event-related averaging is used in real-life stimuli? To answer this question, we consider the case of real-life spoken sentences. Generative language enables us to construct an unlimited number of sentences, each conveying a unique message. We find that some regions produce generic responses that are very similar across all sentences and contexts; however, other regions produce robust response whose temporal profile is specific to each sentence and the context in which it is presented. Thus, we demonstrate that the neural response to each sentence of real-life spoken language is unique, in the sense that each sentence may evoke reliable but nevertheless idiosyncratic response pattern. Moreover, we provide a simple demonstration of how employing event-related averaging can obscure such reliable idiosyncratic information which makes up a substantial proportion of the responses to real life stimuli.
A complete story S can be represented as a sequence of sentences S1,S2,…SK. To test whether a particular brain region is “activated” by these sentences, within the context of event-related analysis, it is common to make two assumptions: (i) with each stimulus Si we can associate a prototypical neural response Ni(t) that is generated in the same way each time Si is presented within a randomized or counterbalanced ordering, and (ii) all stimuli within class S have a shared neural response profile, Ni(t) ≈ N(t), so that variation in the responses across stimuli can be treated as noise, ξ(t). Thus, the response Ri(t) to stimulus Si can be written as Ri(t) = N(t) + ξ(t), where the noise term includes both instrumental noise as well as variability in responses across exemplars of the stimulus class. Under these assumptions, an estimated neural response, N(t), to the stimulus class S can be recovered by averaging all of the empirical event-related responses, Ri(t):
This simple framework is versatile, facilitates experimental control, and has provided the basis of many foundational discoveries in cognitive neuroscience (Bentin et al., 1996; Grill-Spector et al., 1998; Kanwisher et al., 1997; Sergent et al., 1992). In the case of spoken language, however, the two assumptions of the event-related averaging procedure, described above, are violated.
First, the differences in observed responses, Ri(t), may actually result from the fact that the underlying neural activity, Ni(t) varies in meaningful ways across the different sentences, Si, so that Ni(t) ≠ N(t). In such cases, the variability in the response patterns across sentences contains valuable information that should not be treated as noise, ξ(t). Second, when we measure the responses to each sentence, Si within the context of a real life spoken language, then the event-related response evoked by each Si can vary in interesting ways as a function of stimulus history. Thus, the response Ri(t) to each sentence, Si, may differ if that sentence is presented in an alternate context.
In extreme cases, the event-related averaging procedure may completely average out meaningful variability across sentences, producing a flat average response pattern, even though each sentence evokes a reliable and robust response within the local neural circuits. Here we demonstrate such an effect by comparing the reliability of responses to individual sentences across subjects against the reliability of the average response across all sentences. In the present study we only examine the heterogeneity of neural responses across real-life spoken sentences, and it is not certain whether our critique of the trigger averaging method is as applicable to event-related designs which use simpler stimuli. However, we note that even simple checkerboard stimuli elicit region-specific temporal response profiles (Gonzalez-Castillo et al., 2012) and large neuronal response variability across trials (Debener et al., 2005; Duann et al., 2002).
2. Materials and Methods
Data from eleven subjects (20–36 years) that participated in a previously published study (Lerner et al., 2011) was reanalyzed in the current study. Due to problems in the acquisition we discarded the data from one subject. A complete description of the methods is described in the initial publication. Here we provide a concise description of the aspects of the data most relevant for these new analyses. There is no overlap between the goal of the present study, which focused on event-related averaging, and the prior study, which characterized processing timescales of different brain regions.
Eleven participants listened to a 7 min real-life story (“Pie-man,” told by Jim O'Grady) that was originally recorded at a live storytelling performance (“The Moth” storytelling event, New York City). The same set of subjects also listened to a scrambled version of the story. The story audio was segmented manually by identifying the end points of each sentence, and then the order of the sentences was randomly permuted. The story contained 69 sentences; here we focused our analysis on all sentences of length 6s or greater (27 sentences, 6–14s, mean length 8.8s). To remove transient global increases or decreases in response amplitude at the beginning and end of each scan, we cropped the first 13.5sec and the last 12sec of the BOLD response before starting the analysis. Thus, in the last analysis (Figure 3), we could only examine 23 sentences that were not cropped out in both the intact-context and scrambled-context conditions.
Figure 3.

Reliability of sentence-evoked responses across sentences
The inter-context reliability of the sentence-evoked response (average response across participants) is plotted for each of the processing timescales. The dots represent the reliability of each sentence (23 sentences) and the squares indicate the mean sentence reliability of each processing timescale. The short processing timescale regions (red, yellow), exhibited a significantly positive average correlation (red: t(22)=6, yellow: t(22)=3.55;p<0.05, corrected). A direct comparison between groups revealed a significant difference only between the short time-scale (red bar) and long time-scales (green and blue bars)
2.1 MRI acquisition
Subjects were scanned in a 3T head-only MRI scanner (Allegra; Siemens). A custom radio-frequency coil was used for the structural scans (NM-011 transmit head coil; Nova Medical). For fMRI scans, 300 volumes were acquired using a T2*-weighted echo planar imaging (EPI) pulse sequence [repetition time (TR), 1500 ms; echo time (TE), 30 ms; flip angle, 75°], each volume comprising 25 slices of 3 mm thickness with 1 mm gap (in-plane resolution, 3 × 3 mm2).
2.2 Parcellation based on timescales
In the original study (Lerner et al., 2011) we presented the story scrambled at 3 distinct timescales (word level, sentence level and paragraph level) and also in a temporally reversed order. These experiments revealed a gradual increase, from early sensory areas to high order areas, in the timescale of processing within each area. In early auditory cortices (A1+, red in Figure 1A), brain responses were driven mainly by the momentary incoming input and were similarly reliable across all scrambling conditions. Areas adjacent to A1+ along the superior temporal gyrus exhibited intermediate processing timescales. In these areas, information at the `word' (yellow) or 'sentence' (green) timescales or longer was necessary to evoke reliable activity across subjects. At the apex of the hierarchy we found parietal and frontal areas, which responded reliably only when intact paragraphs were presented in a meaningful sequence (blue).
Figure 1.

Event-related averaging can obscure reliable responses to individual stimuli
A) Cortical areas that responded reliably (across subjects) to a recording of a story, presented on an inflated brain. The colors represent different processing timescales, as determined using a separate study in which the temporal structure of the intact story was disrupted at different scales (adapted from(Lerner et al., 2011)). Short timescale (red and yellow), intermediate timescales (green), long timescale (blue). Borders of two ROIs (A1+ and precuneus) are marked in white. B) Concatenation of the mean z-scored time courses of 27 individual sentences, each longer than 6s. The vertical dotted lines mark the boundaries of individual (non-continuous) sentences within the story. Results from A1 (top panel) are presented in red and results from the precuneus (bottom panel) are presented in blue. Each time course represents the average response time course across independent group of subjects (group 1 n=5, group 2 n=6) who listened to the story. The small insets depict the average event-related response to these sentences (after z-scoring the signal within individuals) within each region. The response is plotted relative to the first time point (sentence onset) which was subtracted from each all other time points in a sentence. C) Event-related average response across all sentences in each of the processing timescales. For each timescale we averaged the time courses across all voxels and then performed the event-related averaging. In regions with short processing timescales (red), the response was significantly greater than zero. Note that the temporal patterns of neural activity to different stimulus exemplars may contain information, even within brain regions that show no net activation to that class of stimuli.
In the current study we used the timescales preferences to parcellate our voxels into 4 distinct groups, ranging from low level areas (short timescale) to high order areas (long timescale). This parcellation helped us to assess whether the trigger-averaging procedure yields different outcomes in early auditory areas, intermediate “linguistic” areas (where the processing timescale coincides with that of single words or sentences) and high order areas (where the timescale of processing is that of paragraphs, or longer). The parcellation was performed based on the responses to the four scrambling conditions (“backwards”, “word-scramble”, “sentence-scramble” and “paragraph-scramble”), while excluding the intact story condition. Therefore, the parcellation was determined using independent data sets, and does not bias the trigger averaging analyses performed here on the intact story.
2.3 Regions of Interest (ROIs)
ROI analysis was performed using two ROIs (Figure 1A): a sensory region (A1+) and a higher-order region (precuneus). ROIs were defined using data from a different auditory story (for details see (Lerner et al., 2011). These independent ROIs were used to analyze the responses from the sentences-scrambled condition (Figure 3), and also provided an independent method to assess the responses in the intact story (Figure 1B)
2.4 Data Preprocessing
All fMRI data were analyzed using the BrainVoyager QX software package (Brain Innovation) along with in-house software written in MATLAB (MathWorks, 2009). Preprocessing of functional scans consisted of 3D motion correction, slice time correction, high-pass filtering and Gaussian spatial smoothing (6 mm full-width at half-maximum). Anatomical and functional data were registered to Talairach space (Talairach and Tournoux, 1988) by affine transformation.
2.5 Sentence-evoked responses
The sentence-evoked trigger average response was calculated for individual voxels and for selected ROIs. For each ROI the time course of each voxel was first z-scored and then averaged across all voxels within the ROI. The BOLD response was then segmented at the onset of each sentence (after correcting for the hemodynamic delay using a fixed delay of 3sec). Before segmentation, each time course was interpolated to millisecond-resolution to resolve small ambiguities (less than 750 milliseconds) that may emerge when the onset of a sentence falls between two TRs (TR=1500msec). Finally, the responses were averaged across all sentences to obtain a trigger-averaged response.
2.6 Reliability Measures
Two measures were used to assess the reliability of the brain responses to the presented sentences. First, we measured the reliability of the responses to the individual sentences within the intact (unscrambled) story. The sentence-specific reliability was measured by concatenating the responses to the 27 analyzed sentences and correlating the concatenated time-course across subjects (Figures 1–2). For each subject, we compared the response to the concatenated sentences against the mean of the concatenated responses in all other subjects and then averaged these correlation values across subjects (inter-subject correlation analysis, (Hasson et al., 2009). These analyses were performed on a voxel-byvoxel basis (Figures 2–3) and within two selected ROIs (Figure 1B).
Figure 2.
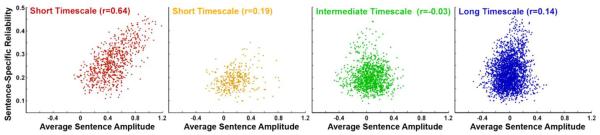
Effect of event-related averaging on signal reliability
Reliability of concatenated single sentence time-courses is plotted against the amplitude of the mean response to a sentence in voxels of different processing timescales. Each dot represents the value within a single voxel, with different panels for each processing timescale. In early auditory areas, the mean response amplitude is strongly correlated with the reliability of responses to individual sentences, while higher order cortical regions exhibit a much weaker correlation. Although the correlation reached significance at all processing timescales aside from the intermediate timescale (red voxels, t(722) = 22.23, p<0.001; yellow voxels, t(337) = 15.19, p<0.001; green voxels, t(1174) = 6.8, p=0.2 NS; blue voxels, t(2577) = 10.08, p<0.001), in a direct comparison the correlation in the shortest processing timescale regions (red) proved significantly stronger than all other regions (red-yellow, 8.43, p<0.05; red-green, 16.72, p<0.05; red-blue, 14.46, p<0.05, corrected).
Second, we measured the reliability of the responses to the same sentence across different contexts (i.e. when the original order of the sentences is preserved or randomly presented). Inter-context reliability was measured, for each individual sentence, by correlating the average response time-courses in the intact-context and scrambled-context conditions.
In a standard GLM analysis, experimenters usually assume prototypical response profile for each event type. The inter-SC analysis method differs from conventional fMRI data analysis methods in that it circumvents the need to specify a model for the neuronal processes for any given event. Instead, the ISC method uses the subject's brain responses to each particular event (for example, a particular sentence and context) as a model to predict brain responses to the same sentence within other subjects.
2.7 Response Amplitude Calculation
To characterize the amplitude of the “mean sentence-evoked response”, the average sentence-evoked response in each voxel was fitted with an impulse response model convolved with a standard hemodynamic response function (Boynton et al., 1996). The mean coefficient of the predictor (beta values averaged across subjects) served as an estimate of the response amplitude.
2.8 Statistical Analyses
To assess the statistical significance of the inter-subject correlations of the concatenated sentences (Section 2.6, first paragraph) we employed a non-parametric surrogate data procedure. Statistical significance of each observed correlation was assessed by comparing against a null distribution generated by phase-randomization of the empirical BOLD time series (Lerner et al., 2011). Family-wise error was controlled using the Benjamini–Hochberg–Yekutieli false-discovery rate (FDR) procedure (Benjamini and Hochberg, 1995).
A t-test was used to test whether the mean response amplitude, after trigger averaging, was significantly different than zero in each ROI. T-tests were also used to test whether the average inter context reliability within each processing timescale was significantly different from zero. A one-way ANOVA was used to test for a different in the mean response amplitude between ROIs. All t-tests were corrected for multiple comparisons using Holm-Bonferroni. Prior to running analysis of variance (ANOVA) or t-tests on correlation coefficients, a Fisher z-transformation was applied. The Fisher-transformation was also applied before testing the significance of differences in correlation coefficients across regions with different timescales (Figure 2).
3. Results
To demonstrate the limitations of the event-related averaging procedure for generative spoken language, we considered the case in which the stimulus class, S, is the set of sentences spoken in a real-life narrated story. Each sentence in the spoken narrative was treated as a discrete event, with an associated time-course at every voxel. We analyzed the same set of events in two different ways. First, we concatenated the time-courses in each region-of-interest (ROI) or voxel and computed the reliability (i.e. correlation) of the concatenated time course across subjects using inter-subject correlation (ISC) analysis (Hasson et al., 2009). In this reliability measurement there is no averaging of the time-course across different sentences. In a second kind of analysis, we characterized the mean sentence-evoked response amplitude by trigger-averaging, for each subject, the responses across all sentences in each ROI.
Because the effects of event-related averaging may differ across brain regions, we performed our analyses separately in early sensory areas (i.e. early auditory areas, red and yellow in Figure 1A), in high order areas (blue in Figure 1A) and in a set of intermediate areas along the cortical hierarchy (green in Figure 1A). We first present data from two ROIs in sensory (A1+) and higher-order (precuneus) areas (Figure 1). These ROIs were identified based on an independent data set (see Materials and Methods), as regions which exhibited short (A1+) and long (precuneus) processing timescales (Lerner et al., 2011). Subsequently, we perform the same analyses on all reliable voxels (Figures, 1C and 2). Figure 1B presents the concatenated response to each of the 27 individual sentences, where the response was calculated separately within two independent groups of subjects. The matching time-courses demonstrate that individual sentence-evoked responses were reliable and consistent across the two groups of subjects in both ROIs (r=0.71 in A1+, r=0.68 in the precuneus).
Next we used event-related averaging to characterize the mean sentence-evoked response in the A1+ and precuneus ROIs (insets in Figure 1B). While the event-related averaging analysis revealed a clear increase in the mean signal amplitude in early auditory areas, the same analysis resulted in a flat mean response in the precuneus. Thus, despite the reliable response to each of the separate sentences in both A1+ and precuneus (Figure 1B, main timecourse), only A1+ shows reliable trigger-averaged response while the precuneus does not (Figure 1B, insets).
Performing the same trigger averaging analysis across all voxels within the four levels of the processing hierarchy revealed that the amplitude of the responses to the mean (trigger-averaged) sentence decreased as we moved from sensory regions toward higher-order brain regions (Figure 1C). Similar results were obtained when we trigger-averaged the responses based on the endpoint of each sentence. We quantified these observations by performing a one-way ANOVA on response amplitudes with processing timescale as the independent variable. Processing timescale had a significant effect on response amplitude (F(3,10)=22.24; p<0.001), driven largely by the early auditory regions (red) which exhibited a significantly greater response amplitude (p<0.05,) compared to all other regions. This region was also the only one to show a response significantly above zero (t(10)=6.52; p<0.05).
We next quantified the loss of information due to event-related averaging by comparing the response reliability of the concatenated sentences (no averaging across sentences) against the response amplitude of the mean sentence. The analysis was performed separately for each voxel within each of the color-labeled levels of the processing timescales (Figure 2).
Within early auditory areas (red) we observed that the event-related averaging and the response reliability of the concatenated sentences produced similar results: there was a strong positive relationship (r=0.64) between the amplitude of the mean response across all sentences and the reliability of individual sentences (Figure 2, red). However, this strong relationship between the two analysis methods broke down as we moved up the hierarchy toward higher order cortical areas. A weaker relationship between amplitude and reliability was observed in areas at an intermediate stage along the processing hierarchy (green) and in high-order association cortex (blue), indicating that reliable information was being lost in the event- averaging procedure. Moreover, while the reliability of sentence-specific time courses remained high for all voxels across all areas (see y-axis in Figure 2), the amplitude of the mean response across sentences gradually decreased, ultimately centering on zero amplitude for areas with longer timescales (see x-axis in Figure 2).
The event-related responses may vary not only across exemplars (Figures 1–2) but also for the same exemplar as a function of the temporal context (Figure 3). Thus, contextual effects can further hinder the effectiveness of event-related averaging procedures, even if the event-averaging is applied only across repetitions of an identical sentence, Si. To quantify the effect of context on the neural response to each sentence, we examined the reliability of each sentence within a subject across different contexts (inter-context reliability, see section 2.6), and this analysis was again performed at each level of the processing hierarchy.
In early auditory regions (red, yellow in Figure 3) we observed a strong inter-context reliability for individual sentences (e.g. in A1+ 20 out of 23 sentences show reliability greater of 0.25, with a mean reliability of 0.6; t(22)=6; *p<0.05). In contrast, in the longest timescale regions (green, blue in Figure 3) we observed a high variability in the reliability of responses for single sentences across contexts (e.g. in the Precuneus only 10 out of 23 sentences show reliability greater of 0.25 with a mean reliability of 0.02, t(22)=0.6;p=NS). An ANOVA test revealed a significant effect of processing timescale on the inter-context reliability (ANOVA F(3,22)=6.13, p<0.001), and significantly stronger correlations for the shortest processing timescale (red) relative to regions of intermediate and long processing timescales (t(22)=3.3 and t(22)=2.91, respectively; p<0.05, corrected).
4. Discussion
Taken together, our results indicate that averaging responses across sentences actually conceals aspects of neural responses that are reliable and specific to individual sentences and to their temporal context. In some brain regions (e.g. near A1+), event-related averaging across stimuli is a good indicator of whether a region is responding to the stimuli, but in other regions (e.g. the precuneus) the average response across stimuli can be effectively flat even though the responses to each sentence may be reliable and stimulus-selective (Figure 1C). Thus, a flat mean response does not necessarily indicate an absence of processing for a class of stimuli, and in some cases, the temporal structure of responses to individual stimuli will be more diagnostic.
Event-related averaging is a ubiquitously useful tool in cognitive neuroscience. It is most powerful when dealing with brief presentation of short and isolated events, where one can assume a canonical response profile for a given class of stimuli. It can also be useful for natural stimuli; see the red curve in Figure 1C as well as (Bartels and Zeki, 2004; Ben-Yakov and Dudai, 2011; Hasson et al., 2008). Here we have shown that a canonical response profile will not always be shared across members, Si, of a class, especially in high-order brain regions, and even in brain regions that respond reliably to each member of the class.
Inter-subject correlation can detect unique event-specific neural responses not only because it does not average across exemplars, but also because it takes account of the temporal response profile of each event. In this sense, the correlation method is analogous to methods that account for the detailed spatial profile of BOLD responses across nearby voxels. Averaging responses across nearby voxels increases the signal to noise ratio, yet also removes information that lies in the spatial variability between voxels. Multi-voxel pattern analysis makes use of the spatial patterns in the neural response to achieve increased sensitivity in the detection of cognitive states (Haxby et al., 2001; Haynes and Rees, 2005; Kamitani and Tong, 2005; Norman et al., 2006). Similarly, methods that make use of temporal variability, such as the inter-subject correlation (Hasson et al., 2009; Hasson et al., 2004), time segment classification using MVPA (Haxby et al., 2011), or ICA (Duann et al., 2002; McKeown et al., 2003) enable detection of signals that would be lost when considering only the time-averaged response amplitude.
In the current setting, one way of reducing the cost of event-related averaging might have been to average across only subsets of the sentences which have similar duration, meaning, or grammatical features. However, this approach faces a number of obstacles. Firstly, the set of features along which to divide the stimuli is generally unknown a priori. Second, the range of potential features to which the brain may be sensitive is vast, and some brain areas may respond to abstract features that are not synchronized with stimulus onset or offset. Third, we have shown that in some cases it is not even possible to define the canonical response profile for one individual sentence because the response to that individual exemplar can depend dramatically on its context. Overcoming the obstacles mentioned above is not required when using methods such as inter-subject correlation or independent-component analysis (ICA).
We note that the inter-subject correlation method can only detect responses that are shared across individuals. In some cases, there may be subject-specific response, for example, due to differences in knowledge or experience. In these cases, it may be preferable to compute intra-subject correlations by comparing the BOLD timecourse from different repetitions within the same subject.
We demonstrated the heterogeneity and context-sensitivity of neural responses by studying responses to one specific class of stimuli, i.e. sentences that make up an auditory narrative. This demonstration will very likely generalize to any natural stimulus in which the constituent elements maintain a meaningful relationship to one another. Further experiments must determine whether other stimulus classes (e.g. faces, objects, melodies) and cognitive processes (e.g. memory consolidation and reasoning) are subject to the same limitations. Finally, we note that the points made here are not limited to fMRI experiments, but apply equally to other neural signals, including EEG waveforms and power spectral timecourses.
It is important to note that we do not claim inter-subject correlation or ICA should replace event-related averaging. No method is without flaws. In this study we simply demonstrate that there are specific components of neural processing which may be invisible to event-related averaging, but which can be detected robustly by examining temporal response profiles of individual events.
Acknowledgments
We thank Michael Arcaro, Nicholas Turk-Browne, David Poeppel and Ralf Schmaelzle for their helpful comments on the manuscript. UH and CJH were supported by the National Institute of Mental Health award R01MH094480 and the R21-DA024423.
References
- Bartels A, Zeki S. Functional brain mapping during free viewing of natural scenes. Hum Brain Mapp. 2004;21:75–85. doi: 10.1002/hbm.10153. [DOI] [PMC free article] [PubMed] [Google Scholar]
- Ben-Yakov A, Dudai Y. Constructing realistic engrams: poststimulus activity of hippocampus and dorsal striatum predicts subsequent episodic memory. J Neurosci. 2011;31:9032–9042. doi: 10.1523/JNEUROSCI.0702-11.2011. [DOI] [PMC free article] [PubMed] [Google Scholar]
- Benjamini Y, Hochberg Y. Controlling the False Discovery Rate - a Practical and Powerful Approach to Multiple Testing. Journal of the Royal Statistical Society Series B-Methodological. 1995;57:289–300. [Google Scholar]
- Bentin S, Allison T, Puce A, Perez E, McCarthy G. Electrophysiological Studies of Face Perception in Humans. J Cogn Neurosci. 1996;8:551–565. doi: 10.1162/jocn.1996.8.6.551. [DOI] [PMC free article] [PubMed] [Google Scholar]
- Boynton G, Engel S, Glover G, Heeger D. Linear systems analysis of functional magnetic resonance imaging in human V1. J Neurosci. 1996;16:4207–4221. doi: 10.1523/JNEUROSCI.16-13-04207.1996. [DOI] [PMC free article] [PubMed] [Google Scholar]
- Debener S, Ullsperger M, Siegel M, Fiehler K, von Cramon DY, Engel AK. Trial-by-trial coupling of concurrent electroencephalogram and functional magnetic resonance imaging identifies the dynamics of performance monitoring. J Neurosci. 2005;25:11730–11737. doi: 10.1523/JNEUROSCI.3286-05.2005. [DOI] [PMC free article] [PubMed] [Google Scholar]
- Duann JR, Jung TP, Kuo WJ, Yeh TC, Makeig S, Hsieh JC, Sejnowski TJ. Single-trial variability in event-related BOLD signals. Neuroimage. 2002;15:823–835. doi: 10.1006/nimg.2001.1049. [DOI] [PubMed] [Google Scholar]
- Goldman RI, Wei CY, Philiastides MG, Gerson AD, Friedman D, Brown TR, Sajda P. Single-trial discrimination for integrating simultaneous EEG and fMRI: identifying cortical areas contributing to trial-to-trial variability in the auditory oddball task. Neuroimage. 2009;47:136–147. doi: 10.1016/j.neuroimage.2009.03.062. [DOI] [PMC free article] [PubMed] [Google Scholar]
- Gonzalez-Castillo J, Saad ZS, Handwerker DA, Inati SJ, Brenowitz N, Bandettini PA. Whole-brain, time-locked activation with simple tasks revealed using massive averaging and model-free analysis. Proc Natl Acad Sci U S A. 2012;109:5487–5492. doi: 10.1073/pnas.1121049109. [DOI] [PMC free article] [PubMed] [Google Scholar]
- Grill-Spector K, Kushnir T, Hendler T, Edelman S, Itzchak Y, Malach R. A sequence of object-processing stages revealed by fMRI in the human occipital lobe. Hum Brain Mapp. 1998;6:316–328. doi: 10.1002/(SICI)1097-0193(1998)6:4<316::AID-HBM9>3.0.CO;2-6. [DOI] [PMC free article] [PubMed] [Google Scholar]
- Hasson U, Furman O, Clark D, Dudai Y, Davachi L. Enhanced intersubject correlations during movie viewing correlate with successful episodic encoding. Neuron. 2008;57:452–462. doi: 10.1016/j.neuron.2007.12.009. [DOI] [PMC free article] [PubMed] [Google Scholar]
- Hasson U, Malach R, Heeger D. Reliability of cortical activity during natural stimulation. Trends Cogn Sci. 2009 doi: 10.1016/j.tics.2009.10.011. [DOI] [PMC free article] [PubMed] [Google Scholar]
- Hasson U, Malach R, Heeger DJ. Reliability of cortical activity during natural stimulation. Trends Cogn Sci. 2010;14:40–48. doi: 10.1016/j.tics.2009.10.011. [DOI] [PMC free article] [PubMed] [Google Scholar]
- Hasson U, Nir Y, Levy I, Fuhrmann G, Malach R. Intersubject synchronization of cortical activity during natural vision. Science. 2004;303:1634–1640. doi: 10.1126/science.1089506. [DOI] [PubMed] [Google Scholar]
- Haxby JV, Gobbini MI, Furey ML, Ishai A, Schouten JL, Pietrini P. Distributed and overlapping representations of faces and objects in ventral temporal cortex. Science. 2001;293:2425–2430. doi: 10.1126/science.1063736. [DOI] [PubMed] [Google Scholar]
- Haxby JV, Guntupalli JS, Connolly AC, Halchenko YO, Conroy BR, Gobbini MI, Hanke M, Ramadge PJ. A common, high-dimensional model of the representational space in human ventral temporal cortex. Neuron. 2011;72:404–416. doi: 10.1016/j.neuron.2011.08.026. [DOI] [PMC free article] [PubMed] [Google Scholar]
- Haynes JD, Rees G. Predicting the orientation of invisible stimuli from activity in human primary visual cortex. Nat Neurosci. 2005;8:686–691. doi: 10.1038/nn1445. [DOI] [PubMed] [Google Scholar]
- Huettel SA, Song AW, McCarthy G. Functional magnetic resonance imaging. 2nd ed Sinauer Associates; Sunderland, Mass: 2009. [Google Scholar]
- Kamitani Y, Tong F. Decoding the visual and subjective contents of the human brain. Nat Neurosci. 2005;8:679–685. doi: 10.1038/nn1444. [DOI] [PMC free article] [PubMed] [Google Scholar]
- Kanwisher N, McDermott J, Chun MM. The fusiform face area: a module in human extrastriate cortex specialized for face perception. J Neurosci. 1997;17:4302–4311. doi: 10.1523/JNEUROSCI.17-11-04302.1997. [DOI] [PMC free article] [PubMed] [Google Scholar]
- Lerner Y, Honey CJ, Silbert LJ, Hasson U. Topographic mapping of a hierarchy of temporal receptive windows using a narrated story. J Neurosci. 2011;31:2906–2915. doi: 10.1523/JNEUROSCI.3684-10.2011. [DOI] [PMC free article] [PubMed] [Google Scholar]
- McKeown MK, Hansen LK, Sejnowski T. Independent component analysis of functional MRI: what is signal and what is noise? Current Opinion in Neurobiology. 2003;13:620–629. doi: 10.1016/j.conb.2003.09.012. [DOI] [PMC free article] [PubMed] [Google Scholar]
- Norman KA, Polyn SM, Detre GJ, Haxby JV. Beyond mind-reading: multi-voxel pattern analysis of fMRI data. Trends Cogn Sci. 2006;10:424–430. doi: 10.1016/j.tics.2006.07.005. [DOI] [PubMed] [Google Scholar]
- Sergent J, Ohta S, MacDonald B. Functional neuroanatomy of face and object processing. A positron emission tomography study. Brain. 1992;115(Pt 1):15–36. doi: 10.1093/brain/115.1.15. [DOI] [PubMed] [Google Scholar]
- Talairach J, Tournoux P. Co-Planar Stereotaxic Atlas of the Human Brain. Thieme Medical Publishers; New York: 1988. [Google Scholar]