

Abstract
ACE inhibitor drugs decrease mortality by up to one-fifth in cardiovascular patients. Surprisingly, there are reports dating back to 1979 suggesting the existence of endogenous ACE inhibitors. Here we investigated the clinical significance of this potential endogenous ACE inhibition.
ACE concentration and activity was measured in patient's serum samples (n = 151). ACE concentration was found to be in a wide range (47–288 ng/mL). ACE activity decreased with the increasing concentration of the serum albumin (HSA): ACE activity was 56±1 U/L in the presence of 2.4±0.3 mg/mL HSA, compared to 39±1 U/L in the presence of 12±1 mg/mL HSA (values are mean±SEM). Effects of the differences in ACE concentration were suppressed in human sera: patients with ACE DD genotype exhibited a 64% higher serum ACE concentration (range, 74–288 ng/mL, median, 155.2 ng/mL, n = 52) compared to patients with II genotype (range, 47–194 ng/mL, median, 94.5 ng/mL, n = 28) while the difference in ACE activities was only 32% (range, 27.3–59.8 U/L, median, 43.11 U/L, and range 15.6–55.4 U/L, median, 32.74 U/L, respectively) in the presence of 12±1 mg/mL HSA. No correlations were found between serum ACE concentration (or genotype) and cardiovascular diseases, in accordance with the proposed suppressed physiological ACE activities by HSA (concentration in the sera of these patients: 48.5±0.5 mg/mL) or other endogenous inhibitors.
Main implications are that (1) physiological ACE activity can be stabilized at a low level by endogenous ACE inhibitors, such as HSA; (2) angiotensin II elimination may have a significant role in angiotensin II related pathologies.
Introduction
The renin-angiotensin-aldosterone system (RAAS) is an important regulator of blood pressure and salt-water homeostasis. Angiotensin converting enzyme is a member of RAAS [1], which catalyses the cleavage of angiotensin I to angiotensin II, and takes part in the metabolism of other peptides like bradykinin [2].
ACE is a prime target in the treatment of common diseases, hereby ACE inhibitors represent one of the most commonly used drugs. This is supported by the fact, that there were 162.8 million ACE inhibitor prescriptions in 2009 in the United States of America [3], which will probably increase during the next years. Their effectiveness is proven by several large clinical trials: ACE inhibitors reduce the risk of cardiovascular death, nonfatal myocardial infarction or cardiac arrest in stable coronary heart disease [4], improve the prognosis [5] and reduce the 5-week mortality after myocardial infarction [6], reduce heart failure mortality [7], inhibit left ventricular remodeling [8], delay the manifestation of hypertension [9], and reduce the left ventricular mass index in left ventricular hypertrophy [10], the incidence of microalbuminuria and the risk of diabetic nephropathy in type 2 diabetes [11] and the likelihood of newly diagnosed diabetes mellitus [12]. The latest therapeutic guidelines have already incorporated all these evidences [13]–[18], and ACE inhibitors are kept on record as a promising component of polypills in primary prevention of large mortality diseases [19].
Motivated by the obvious effectiveness of ACE inhibitors, efforts have been made to associate ACE expression with cardiovascular pathologies to introduce personalized therapies. The clinical efficacy of ACE inhibitors appears to be genetically determined, as ACE inhibitors are less effective in African-American patients than in Caucasian patients [20]. Genetic studies have revealed that the expression of ACE is controlled by an insertion/deletion (I/D) polymorphism in the ACE gene, which results in an ACE expression that is approximately 50% higher in individuals with genotype DD than in those with genotype II [21]. Although some later reports downgraded the level of contribution of ACE genotype to ACE expression (about 20% [22], [23] or only 8% [24]), ACE genotype has been studied extensively as a major cardiovascular risk factor.
Recently, we have confirmed that the human serum albumin (HSA) is an endogenous ACE inhibitor [25]. HSA antagonized serum ACE activity with an IC50 value of 5.7±0.7 mg/mL [25], while physiological HSA concentrations were in the 35–52 mg/mL range in our studies. These data suggested that ACE is significantly inhibited by HSA, in vivo.
The goal of our study was to validate endogenous ACE inhibition in clinical studies. Recently we have found that endogenous ACE inhibitors [26] such as human serum albumin (HSA) [25] stabilize angiotensin converting enzyme (ACE) activity at a very low level [25], [26] independently of ACE expression levels. In accordance, ACE expression and ACE genotype had no effect on cardiovascular disease parameters in clinical studies reported here.
Methods
Ethical approval
All of the studies were approved by the Regional and Institutional Ethics Committee, Medical and Health Science Center, University of Debrecen, (UDMHSC REC/IEC number: 2894-2008) and by the Medical Research Council of Hungary. All of the patients involved gave their written informed consent.
Patient's blood sample collection, serum and DNA isolation
Blood samples were collected from volunteers by using a standard aseptic technique. Native blood was incubated for 60 minutes at room temperature; serum fractions (separated by centrifugation at 1,500 g for 15 min) were stored at −20°C until further experiments. Genomic DNA was prepared from anticoagulated venous blood by using a DNA separation kit (Qiagen).
ACE activity measurement
ACE activity was measured as originally described by Beneteau et al. [27] and modified by us [26]. In brief, ACE activity was determined with an artificial substrate (FAPGG, (N-[3-(2-furyl)acryloyl]-L-phenylalanylglycylglycine; Sigma-Aldrich) in a reaction mixture containing 25 mM HEPES (N-2-hydroxyethylpiperazine-N-2-ethanesulfonic acid), 0.5 mM FAPGG, 300 mM NaCl, and the desired dilution of serum, at pH 8.2. Measurements were performed in 96-well plates (Greiner-Bio One) at 37°C. Changes in optical density (340 nm) were measured at 5-min intervals for at least 90 min with a plate reader (NovoStar plate reader; BMG Labtech). Optical density values were plotted as a function of reaction time and fitted by linear regression. The fit and the data were accepted when r2 was >0.90. ACE activity was calculated via the equation:
where S is the rate of observed decrease in optical density (1/min), k is the change in optical density upon the complete cleavage of 1 µmol of FAPGG, and D is the dilution of the serum. ACE activity is given in units where 1 U is equivalent to the cleavage of 1 µmol of FAPGG in 1 min. In some experiments, the reaction mixture also contained human serum albumin (HSA; Human BioPlazma Manufacturing and Trading).
Measurement of human serum albumin concentration
Human serum albumin concentration was measured with bromocresol green (BCG, Dialab) diagnostic reagent according to the manufacturer's instructions. Briefly, 10 µl serum sample was added to 1 mL bromocresol green reagent (260 µM bromocresol green in 30 mM citrate buffer, pH 4.2), and the mixture was incubated for 10 minutes at room temperature. The absorbance of the mixture was measured at 546 nm against reagent blank in a spectrophotometer (U-2900, Hitachi), using disposable cuvettes. HSA concentration was calculated via the equation:
where A is the absorbance of mixture at 546 nm, Cstandard is the HSA concentration of a diagnostic standard (Albumin standard, Dialab).
Determination of ACE I/D polymorphism
The insertion/deletion genotype (I/D) of ACE was determined by PCR amplification of alleles I and D on the basis of the standard protocol described by Rigat et al. [28]. The amplification products were separated on 5% polyacrylamide gels, and were visualized by ethidium-bromide staining. The presence of allele I or D resulted in a 490-bp or a 190-bp PCR product, respectively (Fig. 1). Insertion specific polymerase chain reaction was performed to avoid mistyping ID and DD genotypes using a protocol described by Lindpaintner et al. [29]. In this case the presence of allele I resulted in a 335-bp amplicon visualized on 3% agarose gel (Fig. 1).
Figure 1. Determination of ACE genotype.

ACE genotype was determined by PCR based assays. First, PCR was performed according to the method described by Rigat et al. (indicated). Amplified DNA with a size of 490 bp represented the I allele, while D allele resulted in a 190-bp band. The results were then verified by the method described by Lindpaintner et al. (indicated). Allele I resulted in a 335-bp amplicon in this case.
Measurement of serum ACE concentration
Serum ACE concentration was measured by a commercial human ACE ELISA development kit (R&D Systems) according to the manufacturer's instructions, with minor modifications. Briefly, enzyme-linked immunosorbent plates (Greiner Bio-One) were coated with 80 ng/well capture antibody, and the remaining binding sites were then blocked with reagent diluent (10 mg/mL bovine serum albumin (Sigma-Aldrich) in Dulbecco's phosphate-buffered saline solution (PBS, Gibco)). Diluted sera (in reagent diluent, 12.5–200-fold dilution) were added to the wells, and the antibody-antigen complexes were labeled with a biotinylated detection antibody (20 ng/well). 200-fold-diluted streptavidin-conjugated horseradish-peroxidase (kit component) was added to the wells. Finally, the amounts of complexes were detected with a substrate solution containing 0.3 mg/mL tetramethylbenzidine, 0.1 µM H2O2 and 50 mM acetic acid. The reaction was terminated after 20 min by the addition of 0.5 M HCl, and the optical density was measured at 450 nm. To determine the optimal conditions to measure ACE concentration in human sera with II, ID and DD genotypes a series dilutions were tested (12.5–200-fold, Fig. 2). The 100-fold dilution was found to be optimal: the values were in the linear phase (in contrast with dilutions below 50-fold dilutions) and were sufficiently high to measure. The ACE concentrations in the samples were measured at least three times to achieve a standard deviation of at most 15%.
Figure 2. Determination of ACE concentration.

Three patients were selected to represent all genotypes (II, ID and DD, indicated). Sera were diluted 12.5, 25, 50, 100 and 200-fold (indicated) to determine optimal conditions. ACE amount was determined in an ELISA assay. A set samples with known ACE concentrations (Standard, A) were also used. Values (optical density) were plotted as the function of the known ACE concentration and a calibration curve was defined (nonlinear fit, solid line, A). Concentrations of the serum samples were then calculated based on their position on the calibration curve. Each serum sample was determined two times. Average of the quadruple measurements is shown (three samples measured twice, resulting in 6, sometimes overlapping individual data point for each dilution, A). It was apparent from the individual measurements that dilutions at 200-fold have very low values, while the saturation of the binding sites resulted in a high scatter at dilutions below 50-fold (A). Although averaged values showed a tendency for under-estimating ACE concentrations at low dilutions, in the case of high expression levels (B), ACE concentration determination was remarkably accurate. Bars represent mean ± SD. No statistical differences were found by nonparametric ANOVA.
Calculation of ACE activity in the undiluted human sera
ACE activity in the undiluted sera was calculated according to the equation:
Where Ki is the inhibitory constant of HSA on ACE activity determined previously (83 µM) [25], [Active ACE], concentration of the active form of ACE; [Inactive ACE], concentration of the inhibited form of ACE; [HSA], concentration of human serum albumin, determined by colorimetric assay.
Taking into account that
where [Total ACE] is determined by ELISA,
[Active ACE] can be calculated based on measured values as:
Activity of [Active ACE] was related to the measured ACE activity in the same patients at 20-fold dilution, where ACE activity was considered to be uninhibited by HSA [25], to estimate the ACE activity in the undiluted human sera.
Statistical analysis
Statistical analysis was performed with Graphpad Prism 5.0 (GraphPad Software) by one-way ANOVA, one-way ANOVA with Dunnett's multiple comparison test and by the t-test. Differences were considered to be significant when p<0.05.
Results
Plotting ACE activity as a function of the serum ACE concentration yielded a linear relationship in the individual patients (Fig. 3A), and in patient groups with different levels of endogenous ACE expression (Fig. 3B). However, a 5-fold increase in serum ACE concentration was only accompanied by a 2.3-fold increase in serum ACE activity based on the linear fit of the individual values (Fig. 3A). Similarly, the increase in serum ACE concentration from 62±11 ng/mL to 252±32 ng/mL (4.1-fold increase in expression, Fig. 3B) was accompanied by a limited (2.1-fold) increase in ACE activity (from 27±7 U/L to 56±2 U/L, Fig. 3B).
Figure 3. Incomplete correlation between serum ACE concentration and activity.
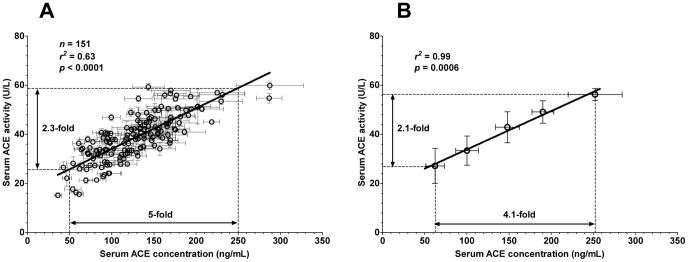
Serum ACE concentration and specific ACE activity was determined in hypertensive patients (n = 151 patients). Serum ACE concentration was determined by an ELISA method using 100-fold diluted serum samples. Human recombinant ACE was used to construct calibration curves for each individual plate. Serum ACE expression was calculated based on these calibration curves. ACE activity was assessed at a 4-fold dilution by measuring the decomposition of the artificial substrate FAPGG. Serum ACE activity is shown as a function of the serum ACE concentration in the figures. Panel A shows the individual data, while patients were grouped according to their serum ACE concentration in panel B. Both graphs were fitted by a linear regression to reveal correlations between the values, and the parameters of the fits are shown. The magnitude of the differences in ACE concentration and ACE activity values are also shown. Symbols represent the mean (measurements were done at least 3-times), bars are SEM.
Patients who were homozygous for the allele D (deletion) of the ACE gene displayed higher ACE concentrations in their sera than those who were homozygous for the allele I (Insertion, II = 47–194 ng/mL, median: 94.5 ng/mL, n = 28; ID = 36–202 ng/mL, median: 114.3 ng/mL, n = 71; DD = 74–288 ng/mL, median: 155.2 ng/mL, n = 52; Fig. 4A). The activity of ACE was also elevated in the DD homozygote patients (II = 15.6–55.4 U/L, median: 32.74 U/L, n = 28; ID = 15.2–59.3 U/L, median: 35.48 U/L, n = 71; DD = 27.3–59.8 U/L, median: 43.11, n = 52; Fig. 4B). Nonetheless, these data indicate that a 64% increase in serum ACE concentration results in only a 32% increase in ACE activity in patients with the DD genotype versus those with the II genotype.
Figure 4. ACE genotype determines serum ACE concentration and activity.

Serum ACE concentration, activity and genotype was determined as mentioned earlier (Figs. 3, 1). ACE concentration (A) and activity (B) in patients with different ACE genotypes (insertion, II, n = 28; deletion, DD, n = 52 and heterozygotes, ID, n = 71) are shown. The boxes indicate the interquartile range with median; whiskers are the minimum and the maximum values. Significant differences (1 way ANOVA, Bonferroni post-hoc test) are labelled by asterisks (NS, not significant).
These data suggest that the ACE activity is modulated by additional factors besides the ACE concentration in the human serum [26]. Previous results suggested that serum albumin is an endogenous ACE inhibitor [25], [30], which has a concentration dependent effect on serum ACE activity. An effort was made to investigate the relationship between serum ACE activity and serum albumin concentration in human sera under in vitro conditions. Apparent specific ACE activity was higher when serum albumin concentration was low due to the dilution of the sera (Fig. 5). In particular, apparent specific ACE activity decreased from 56.13±1.17 to 38.55±0.78 U/L when HSA concentration increased from 2.42±0.02 mg/mL to 12.12±0.12 mg/mL. The stability constant (IC50 value) of the human serum ACE-HSA interaction was 5.7±0.7 mg/mL in a previous study in our laboratory [25], suggesting that the ACE activity is 8.47±0.18 U/L (calculated values) in the presence of the measured 48.46±0.46 mg/mL HSA concentrations in human serum samples used for the analysis (Fig. 5).
Figure 5. Serum ACE activity correlates with serum albumin concentration.

Serum ACE activities (n = 151 patients) were determined at different dilutions (20-fold and 4-fold dilutions). The determined ACE activity values were plotted as a function of the actual serum albumin concentrations in the individual samples (A). Serum ACE activity values for undiluted sera were estimated based on the measured activity values at 20-fold dilution and the reported ACE-HSA inhibitory constant (IC50 = 5.7 mg/mL). These calculated ACE activity values were plotted as a function of the measured human serum albumin concentration in the individual serum samples (labelled as undiluted sera). Values are also given as the mean and SD of the individual determinations (B). There was a significant difference (unpaired t-test) between the values measured at 20-fold and 4-fold dilutions (indicated).
It was tested whether this endogenous suppression of serum ACE by HSA is sufficient to compensate for different expression levels in hypertensive patients where therapeutic ACE inhibition is particularly effective. Patients without prescribed ACE inhibitory drugs were recruited (n = 151 patients, Table 1). Serum ACE concentration did not correlated with morphometric parameters such as age, body mass, height or body mass index (Fig. 6). Serum ACE concentration did not show correlation with lipid parameters, such as total cholesterol and triglyceride concentration (Fig. 7). Cardiovascular parameters (ejection fraction, heart rate, systolic and diastolic blood pressure) were again independent of serum ACE concentration (Fig. 8), based on the inaccurate fit (represented by the low r2 values). Parameters of the renal function (serum urea, creatinine, uric acid and glomerular filtration rate) again showed a significant scatter (see low r2 values) and suggested no correlation with serum ACE concentration (Fig. 9). Correlation of these values was also tested with the genotype of the patients, which significantly affected ACE expression (Fig. 4A). No correlation was found between clinical parameters and ACE genotype (Fig. 10), similarly to the individual ACE expression levels (Fig. 6–9).
Table 1. Clinical parameters and the genotype of the patients involved in the study.
| II | ID | DD | All patients | ||
| Number of patients | 28 | 71 | 52 | 151 | |
| Gender (female/male) | 12/16 | 33/38 | 36/16 | 81/70 | |
| Age | 58±11 | 58±14 | 52±13 | 56±13 | |
| Body mass Index (kg/m2) | 28.9±5.6 | 29.2±5.9 | 29.0±5.0 | 29.0±6.0 | |
| Smoker | 4 (14%) | 15 (21%) | 7 (13%) | 32 (21%) | |
| Diabetes mellitus | IDDM | 2 (7%) | 3 (4%) | 3 (6%) | 8 (5%) |
| NIDDM | 6 (21%) | 13 (19%) | 8 (15%) | 27 (18%) | |
| Dyslipidemia | 19 (68%) | 48 (68%) | 32 (62%) | 99 (66%) | |
| Total cholesterol (mmol/L) | 4.96±1.34 | 5.21±1.38 | 5.28±1.39 | 5.19±1.36 | |
| Ejection fraction (%) | 57±6 | 56±8 | 59±7 | 57±7 | |
| Heart rate (1/min) | 71±10 | 75±12 | 75±13 | 74±12 | |
| Systolic blood pressure (mmHg) | 130±21 | 128±16 | 128±16 | 129±17 | |
| Dyastolic blood pressure (mmHg) | 81±12 | 80±9 | 78±10 | 80±10 | |
| Urea (mmol/L) | 7.3±2.3 | 5.6±2.7 | 5.4±1.9 | 5.8±2.3 | |
| Creatinine (µmol/L) | 85±29 | 82±52 | 71±17 | 77±38 | |
| Glomerular filtration rate (mL/min/1.73 m2) | 75±21 | 87±25 | 85±12 | 84±20 | |
| Uric acid (µmol/L) | 356±126 | 313±101 | 313±72 | 319±94 | |
| ACE amount (median (min, max), U/L) | 95 (47, 194) | 114 (36, 202) | 155 (74, 288) | 127 (36, 288) | |
| ACE activity (median (min, max), ng/mL) | 33 (16, 55) | 35 (15, 59) | 43 (27, 60) | 38 (15, 60) | |
| Used antihypertensive drugs: | |||||
| Diuretics | 15 (54%) | 23 (32%) | 16 (31%) | 54 (36%) | |
| Clopamide | 0 | 1 (1%) | 0 | 1 (0.5%) | |
| Hydrochlorothiazide | 10 (36%) | 13 (19%) | 13 (25%) | 36 (24%) | |
| Indapamide | 0 | 3 (4%) | 0 | 3 (2%) | |
| Spironolactone | 3 (11%) | 3 (4%) | 3 (6%) | 9 (6%) | |
| Amiloride | 2 (7%) | 3 (4%) | 0 | 5 (3%) | |
| β-Blockers | 21 (75%) | 51 (72%) | 32 (62%) | 104 (68%) | |
| Betaxolol | 0 | 1 (1%) | 0 | 1 (0.5%) | |
| Bisoprolol | 11 (40%) | 24 (34%) | 19 (37%) | 54 (36%) | |
| Carvedilol | 2 (7%) | 5 (7%) | 2 (4%) | 9 (6%) | |
| Metoprolol | 2 (7%) | 5 (7%) | 2 (4%) | 9 (6%) | |
| Nebivolol | 6 (21%) | 16 (23%) | 9 (17%) | 31 (21%) | |
| α1-Antagonists | 3 (11%) | 4 (6%) | 2 (4%) | 9 (6%) | |
| Doxasosin | 2 (7%) | 3 (4%) | 0 | 5 (3%) | |
| Prasosin | 1 (4%) | 1 (1%) | 2 (4%) | 4 (3%) | |
| ACE-Inhibitor | 0 | 0 | 0 | 0 | |
| Angiotensin receptor blockers | 17 (61%) | 31 (44%) | 22 (42%) | 70 (46%) | |
| Irbesartan | 6 (21%) | 13 (19%) | 11 (21%) | 30 (20%) | |
| Losartan | 7 (25%) | 15 (21%) | 5 (10%) | 27 (18%) | |
| Telmisartan | 1 (4%) | 2 (3%) | 4 (8%) | 7 (5%) | |
| Valsartan | 3 (11%) | 1 (1%) | 2 (4%) | 6 (4%) | |
| Renin-Inhibitor | 0 | 0 | 0 | 0 | |
| Ca-channel blockers | 11 (39%) | 20 (28%) | 13 (25%) | 44 (29%) | |
| Amlodipine | 11 (39%) | 19 (27%) | 11 (21%) | 41 (27%) | |
| Dilthiazem | 0 | 1 (1%) | 1 (2%) | 2 (1%) | |
| Verapamil | 0 | 0 | 1 (2%) | 1 (0.5%) | |
| Imidazoline-I agonisms | 2 (7%) | 1 (1%) | 2 (4%) | 5 (3%) | |
| Rilmenidin | 2 (7%) | 1 (1%) | 2 (4%) | 5 (3%) | |
| Statin therapy | 13 (46%) | 36 (51%) | 23 (44%) | 72 (48%) | |
Figure 6. There is no relationship between morphometric parameters and serum ACE concentration.

Age, body mass, height and body mass index of the patients involved in the studies (n = 151) are plotted as the function of the measured serum ACE concentration. Points were fitted by a linear regression to reveal the potential correlation between the plotted parameters. Parameters of the fitting are shown in each graph. The normal range for BMI is 18.5–25 kg/m2.
Figure 7. There is no relationship between serum lipid levels and serum ACE concentration.
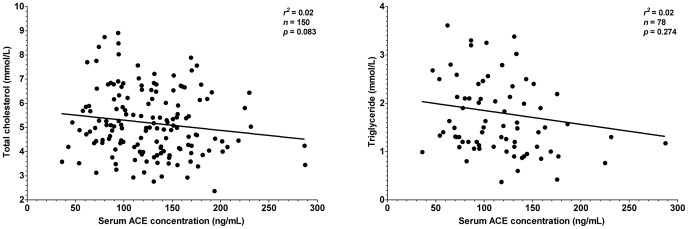
Total cholesterol and triglyceride levels are plotted as a function of the serum ACE concentration (n = 151 patients). Points were fitted by a linear regression to reveal the potential correlation between the plotted parameters. Parameters of the fitting are shown in each graph. Normal rage for total cholesterol is lower than 5.2 mmol/L for triglyceride is lower than 1.7 mmol/L.
Figure 8. There is no relationship between cardiovascular parameters and serum ACE concentration.

Cardiovascular parameters (ejection fraction, heart rate, systolic and diastolic blood pressure) were plotted as a function of the serum ACE concentration (n = 151 patients). Points were fitted by a linear regression to reveal the potential correlation between the plotted parameters. Parameters of the fitting are shown in each graph. Ejection fraction is normally above 50%, heart rate is in the range of 60–100/min, systolic and diastolic blood pressure is in the range of 90–140 and 60–90 mmHg.
Figure 9. There is no relationship between parameters of renal function and serum ACE concentration.

Renal function was assessed by the means of urea, creatinine and uric acid concentrations in the sera and by the glomerular filtration rate (GFR) values. Values were plotted as a function of the serum ACE concentration (n = 151 patients). Points were fitted by a linear regression to reveal the potential correlation between the plotted parameters. Parameters of the fitting are shown in each graph. Normal ranges for the values are: urea, 3.6–7.2 mmol/L, creatinine, 44–97 µmol/L (female) and 62–106 µmol/L (male), GFR, above 90 mL/min/1.73 m2, uric acid, 140–340 µmol/L (female) and 220–420 µmol/L (male).
Figure 10. Correlation of patient's parameters with ACE I/D genotype.

Various parameters (age, body mass, height, body mass index, total cholesterol, triglyceride, ejection fraction, heart rate, systolic and diastolic blood pressure, urea, creatinine, glomerular filtration rate and uric acid) were correlated to the genotype of the patients (insertion, II, n = 28; deletion, DD, n = 52 and heterozygotes, ID, n = 71). The boxes indicate the interquartile range with median; whiskers are the minimum and the maximum values. Significant differences (1 way ANOVA, Bonferroni post-hoc test) are labelled by asterisks.
Discussion
Angiotensin converting enzyme (ACE) is one of the most frequently targeted enzymes in the everyday medical practice. ACE inhibitors are the fifth most described drugs and represent a cornerstone in the treatment in cardiovascular diseases (hypertension, heart failure) [13]–[18]. Surprisingly, we have confirmed recently [25], that serum albumin is an endogenous ACE inhibitor [31], which can inhibit ACE in a concentration dependent fashion (IC50 value is 5.7±0.7 mg/mL on human serum ACE in our studies [25]) similarly to the prescribed ACE inhibitory drugs.
We hypothesized here that endogenous ACE inhibitors [26], [32]–[45], such as human serum albumin [25] can provide an endogenous protection against dysregulation of ACE. Our recent data suggest that serum ACE activity is suppressed by endogenous ACE inhibitors [26], such as serum albumin [25], providing a protection against higher ACE expression levels in human serum [25].
Determination of ACE concentration was done by a kit manufactured by R&D Systems here. Since we did not find relevant publications using this kit to determine serum ACE, we have performed a detailed analysis of its reproducibility and made an effort to optimize the conditions. It appeared that the determinations are remarkably reproducible in a wide range of serum dilutions (12.5–200-fold). Nonetheless, 100-fold dilution appeared to be optimal (measurable values using limited volumes of serum samples). Values determined by this kit appeared to be somewhat lower than that published before (400–584 ng/mL) [23], [46], [47]. The reason of the differences can be related to the purity and quality of the standards used to quantitate concentrations. Irrespectively to the differences in the values determined by different methods, it appeared that our method results in an accurate determination of the differences in ACE concentration. These concentrations correlated by the genotype of the individuals (about 64% higher ACE concentration in patients with DD genotype compared to patients with II genotype).
ACE insertion-deletion (I/D) polymorphism was identified more than 20 years ago [21], and it was postulated that this polymorphism is responsible for 20–50% of the interpersonal variability in circulating ACE expression levels. In accordance, we found a wide range in serum ACE expression in human sera (from 47 to 288 ng/mL) and patients with DD genotype had 64% higher ACE expression than patients with II genotype. It was proposed that the differences in ACE expression related to ACE I/D polymorphism may play a role in the occurrence of myocardial infarction, coronary artery disease, coronary artery calcification, heart failure and hypertension. No such correlation was found here, in accordance with a meta-analysis of more than 30,000 individuals which concluded that ACE genotype is without effects on blood pressure, and is not associated with an increased risk of myocardial infarction, ischemic heart disease or ischemic cerebrovascular disease [48].
In the present study, we directly tested the relationship between ACE expression and activity in sera obtained from hypertensive patients. It was found that hypertensive patients with DD genotype had 64% higher serum ACE concentrations than in those with II genotype, while the difference in ACE activities was only 32%. This suggested that the effects of higher ACE expression are buffered. These findings are in accordance with the observation that local angiotensin I to angiotensin II conversion and the angiotensin II/I ratio are independent of the I/D genotype in the human forearm [49].
This apparent lack of correlation between cardiovascular parameters and ACE expression (genotype) is particularly interesting in light of the clinical effectiveness of ACE inhibitors for the same cardiovascular diseases, as evidenced by several large-scale trials, and as accepted by the published guidelines [4]–[18]. Several recent reviews evaluating the potential role of an increased ACE expression in cardiovascular disease concluded that not the expression (and genotype), but the actual ACE activity is important [50].
Important to note, that it is rather complicated to accurately determine serum ACE activity. In particular, earlier reports suggested that dilution of the serum has a significant effect on the apparent ACE activity values [32]. To eliminate this effect a high dilution factor was suggested during the determinations [51]. In a recent work we have identified the serum albumin as an endogenous ACE inhibitor, with an IC50 value (5.7±0.7 mg/mL) [25]. It was found that the apparent serum ACE activity is higher and the effect of dilution is missing when serum albumin is removed from the human sera [25], [26].
The major novelty of the present work is to show that endogenous inhibitors [26], such as HSA [25] suppress ACE activity in a clinical setup. Serum ACE activity did not correlate perfectly with the ACE concentration. A 4.1-fold increase in ACE concentration resulted in a 2.1-fold increase in ACE activity in the patient's sera, suggesting that serum ACE activity is regulated. Additional factors than the concentration of the enzyme contribute to the ACE activity. Moreover, this factor suppressed the effects of the different ACE expression levels on ACE activity, suggesting the existence of an endogenous ACE activity stabilizing mechanism.
This effect may be clinically significant when the circulating ACE level is elevated in consequence of genetic factors (such as the ACE I/D polymorphism) or diseases. A point mutation in the stalk region of the ACE gene resulted in a 5-fold elevated circulating ACE concentration [52]. This mutation affected at least eight families, but there were no ACE-related clinical abnormalities or hypertension. An other mutation that was accompanied by a 13-fold elevation of the serum ACE concentration was also without increased occurrence of cardiovascular disease [53]. Some other mutations of the ACE gene are known to be coupled with a mildly elevated ACE concentration, but again without an enhanced incidence of cardiovascular diseases [54]–[57]. All of these observations suggest that substantial differences in ACE concentrations are well tolerated in vivo. This tolerance can be explained by the observation that ACE activity is stabilized at a low level by endogenous factors [25], [26].
Unfortunately it was not possible to directly determine ACE activity in the undiluted human sera. ACE activities were measured at a 4-fold dilution because serum absorbed light significantly at 340 nm, where exogenous substrate conversion is detected. Nonetheless, ACE activity was estimated in undiluted human serum by measuring the serum albumin and ACE concentrations, ACE activity at 20-fold dilution and using the previously determined inhibitory constant for HSA on human serum ACE (IC50 = 5.7±0.7 mg/mL) [25]. According to these measured values and the calculations ACE activity is suppressed to 8.5±2.2 U/L by the physiological concentration of HSA in the undiluted human serum samples. Moreover, this ACE activity is only the maximal value (representing the isolated effect of HSA). Other proposed endogenous ACE inhibitory molecules may further suppress ACE activity, in vivo [26].
The measured concentrations of ACE (about 127 ng/mL) and serum albumin (about 48 mg/mL) in human serum samples suggest that differences in ACE concentration may be buffered by endogenous inhibitors [26], in particular by HSA [25]. Serum albumin is present at concentration of 10-fold higher than the IC50 value for HSA to inhibit ACE suggesting that the majority of ACE is in its HSA bound (inhibited) form. Free HSA concentration is negligibly affected by ACE binding, several orders of magnitude differences in ACE activity can be theoretically “buffered” by binding to HSA.
It needs to be mentioned that HSA is only one of the proposed endogenous ACE inhibitors. Existence of endogenous ACE (called kininase II at this time) inhibitors were proposed as early as 1979. Besides to Klauser et al., who reported first that serum albumin inhibits the ACE [30] Ryan et al. reported the existence of small (<10 kDa) molecular weight components of human sera [39]. Later studies identified substrate analogues (angiotensin I [45] and substance P [44]) able to inhibit ACE. Lieberman et al. reported an ACE inhibitor with an apparent molecular mass of >50 kDa [32], Ikemoto et al. reported an inhibitor with an apparent molecular mass of >10 kDa [38]. Both low and high molecular weight ACE inhibitors were shown in the rat lung [33] or in the human sera [58]. Peptides of the tryptic lysate of human plasma [35], [36], human serum albumin [59], bovine alphaS2-casein [43] and some types of honey were also found to inhibit ACE [41].
Taken together, it appears that HSA (and/or its fragments) has an effect on ACE activity, in vivo. On the other hand HSA is probably not the sole endogenous inhibitor of ACE, according to these reports, making it hard to estimate its contribution. We proposed a hypothesis, which was based on the effect and concentration response of HSA [25], which in itself appeared to be sufficient to explain the findings. This hypothesis was indirectly tested in this manuscript and other endogenous ACE inhibitors may also have contributed to the features described here.
The observed suppression of serum ACE activity provides basis for intriguing consequences. One of them is that physiological angiotensin II concentrations may be determined by angiotensin II elimination. In this case activation of RAAS, which is a cornerstone of cardiovascular diseases (such as hypertension and heart failure) may occur by the decreasing efficiency of angiotensin II elimination as has been shown in an accompanying clinical paper [60]. As a matter of fact, one of the best-characterized enzymes involved in angiotensin II elimination is ACE2 [61], activation of which is known to protect against hypertension, myocardial fibrosis, remodeling [62] and renal impairment [63].
Another implication is that the levels of these endogenous inhibitors (including HSA) may affect the function of the RAAS through modulating ACE activity. Our data suggest that ACE is well suppressed as long as the HSA concentration is at least ∼30 mg/mL. Indeed, postoperative infusion of HSA frequently evokes hypotension in patients receiving ACE inhibitor therapy [64].
In summary, our data suggest that human serum ACE activity is suppressed at a low level (buffered) by endogenous inhibitors [26], such as serum albumin [25] and probably other low molecular weight inhibitors. This suppression of serum ACE activity suggests that angiotensin II synthesis may be limited, in which case angiotensin II elimination may have a significant physiological role [60]. Moreover, clinical data provided here suggest that this suppression of physiological ACE activity may contribute to the tolerance of different ACE expression levels, such as determined by ACE I/D polymorphism.
Funding Statement
The study was supported by the Hungarian Academy of Sciences OTKA (K84300 to AT) and by the Hungarian Ministry of Health (ETT 377/2009 to AT); the work is supported by the TAMOP 4.2.1./B-09/1/KONV-2010-0007 TAMOP-4.2.2.A-11/1/KONV 2012-0045, REG-EA-09-1-2009-0013 projects (to AT, IE and ZP); MSD Magyarorsag Kft, Pfier Magyararsag Kft also supported some of the research. The project is implemented through the New Hungary Development Plan, co-financed by the European Social Fund; and by the National Innovation Office of Hungary (Baross Gabor Project, EletMent). Finally, AT was supported by the Bolyai Janos Research Scholarship of the Hungarian Academy of Sciences. The funders had no role in study design, data collection and analysis, decision to publish, or preparation of the manuscript.
References
- 1. Pfeffer MA, Braunwald E, Moyé LA, Basta L, Brown EJ, et al. (1992) Effect of captopril on mortality and morbidity in patients with left ventricular dysfunction after myocardial infarction. Results of the survival and ventricular enlargement trial. The SAVE Investigators. N Engl J Med 327: 669–677. [DOI] [PubMed] [Google Scholar]
- 2. Corvol P, Michaud A, Soubrier F, Williams TA (1995) Recent advances in knowledge of the structure and function of the angiotensin I converting enzyme. J Hypertens Suppl 13: S3–10. [DOI] [PubMed] [Google Scholar]
- 3. Bian B, Kelton CML, Guo JJ, Wigle PR (2010) ACE Inhibitor and ARB utilization and expenditures in the Medicaid fee-for-service program from 1991 to 2008. J Manag Care Pharm 16: 671–679. [DOI] [PMC free article] [PubMed] [Google Scholar]
- 4. Fox KM (2003) Efficacy of perindopril in reduction of cardiovascular events among patients with stable coronary artery disease: randomised, double-blind, placebo-controlled, multicentre trial (the EUROPA study). Lancet 362: 782–788. [DOI] [PubMed] [Google Scholar]
- 5. Gruppo Italiano per lo Studio della Sopravvivenza nell'Infarto Miocardic (1996) Six-month effects of early treatment with lisinopril and transdermal glyceryl trinitrate singly and together withdrawn six weeks after acute myocardial infarction: the GISSI-3 trial. J Am Coll Cardiol 27: 337–344. [PubMed] [Google Scholar]
- 6. Group I-4 C (1995) ISIS-4: a randomised factorial trial assessing early oral captopril, oral mononitrate, and intravenous magnesium sulphate in 58,050 patients with suspected acute myocardial infarction. ISIS-4 (Fourth International Study of Infarct Survival) Collaborative. Lancet 345: 669–685. [PubMed] [Google Scholar]
- 7. Cohn JN, Johnson G, Ziesche S, Cobb F, Francis G, et al. (1991) A comparison of enalapril with hydralazine-isosorbide dinitrate in the treatment of chronic congestive heart failure. N Engl J Med 325: 303–310. [DOI] [PubMed] [Google Scholar]
- 8. Greenberg B, Quinones MA, Koilpillai C, Limacher M, Shindler D, et al. (1995) Effects of long-term enalapril therapy on cardiac structure and function in patients with left ventricular dysfunction. Results of the SOLVD echocardiography substudy. Circulation 91: 2573–2581. [DOI] [PubMed] [Google Scholar]
- 9. Lüders S, Schrader J, Berger J, Unger T, Zidek W, et al. (2008) The PHARAO study: prevention of hypertension with the angiotensin-converting enzyme inhibitor ramipril in patients with high-normal blood pressure: a prospective, randomized, controlled prevention trial of the German Hypertension League. J Hypertens 26: 1487–1496. [DOI] [PubMed] [Google Scholar]
- 10. Cuspidi C, Muiesan ML, Valagussa L, Salvetti M, Di Biagio C, et al. (2002) Comparative effects of candesartan and enalapril on left ventricular hypertrophy in patients with essential hypertension: the candesartan assessment in the treatment of cardiac hypertrophy (CATCH) study. J Hypertens 20: 2293–2300. [DOI] [PubMed] [Google Scholar]
- 11. Ruggenenti P, Fassi A, Ilieva AP, Bruno S, Iliev IP, et al. (2004) Preventing microalbuminuria in type 2 diabetes. N Engl J Med 351: 1941–1951. [DOI] [PubMed] [Google Scholar]
- 12. Hoogwerf BJ, Young JB (2000) The HOPE study. Ramipril lowered cardiovascular risk, but vitamin E did not. Cleve Clin J Med 67: 287–293. [DOI] [PubMed] [Google Scholar]
- 13. Taylor J (2012) Joint societies CVD Prevention Guidelines launched in May 2012. Eur Heart J 33: 1539. [DOI] [PubMed] [Google Scholar]
- 14. McMurray JJV, Adamopoulos S, Anker SD, Auricchio A, Böhm M, et al. (2012) ESC Guidelines for the diagnosis and treatment of acute and chronic heart failure 2012: The Task Force for the Diagnosis and Treatment of Acute and Chronic Heart Failure 2012 of the European Society of Cardiology. Developed in collaboration with the Heart. Eur Heart J 33: 1787–1847. [DOI] [PubMed] [Google Scholar]
- 15. Hamm CW, Bassand J-P, Agewall S, Bax J, Boersma E, et al. (2011) ESC Guidelines for the management of acute coronary syndromes in patients presenting without persistent ST-segment elevation: The Task Force for the management of acute coronary syndromes (ACS) in patients presenting without persistent ST-segment elevatio. Eur Heart J 32: 2999–3054. [DOI] [PubMed] [Google Scholar]
- 16. Tendera M, Aboyans V, Bartelink M-L, Baumgartner I, Clément D, et al. (2011) ESC Guidelines on the diagnosis and treatment of peripheral artery diseases: Document covering atherosclerotic disease of extracranial carotid and vertebral, mesenteric, renal, upper and lower extremity arteries: the Task Force on the Diagnosis and Treatm. Eur Heart J 32: 2851–2906. [DOI] [PubMed] [Google Scholar]
- 17. Wijns W, Kolh P, Danchin N, Di Mario C, Falk V, et al. (2010) Guidelines on myocardial revascularization. Eur Heart J 31: 2501–2555. [DOI] [PubMed] [Google Scholar]
- 18. Rydén L, Standl E, Bartnik M, Van den Berghe G, Betteridge J, et al. (2007) Guidelines on diabetes, pre-diabetes, and cardiovascular diseases: executive summary. The Task Force on Diabetes and Cardiovascular Diseases of the European Society of Cardiology (ESC) and of the European Association for the Study of Diabetes (EASD). Eur Heart J 28: 88–136. [DOI] [PubMed] [Google Scholar]
- 19. Wald NJ, Law MR (2003) A strategy to reduce cardiovascular disease by more than 80%. BMJ 326: 1419. [DOI] [PMC free article] [PubMed] [Google Scholar]
- 20. Ferdinand KC (2003) Recommendations for the management of special populations: racial and ethnic populations. Am J Hypertens 16: 50S–54S. [DOI] [PubMed] [Google Scholar]
- 21. Rigat B, Hubert C, Alhenc-Gelas F, Cambien F, Corvol P, et al. (1990) An insertion/deletion polymorphism in the angiotensin I-converting enzyme gene accounting for half the variance of serum enzyme levels. J Clin Invest 86: 1343–1346. [DOI] [PMC free article] [PubMed] [Google Scholar]
- 22. Tiret L, Rigat B, Visvikis S, Breda C, Corvol P, et al. (1992) Evidence, from combined segregation and linkage analysis, that a variant of the angiotensin I-converting enzyme (ACE) gene controls plasma ACE levels. Am J Hum Genet 51: 197–205. [PMC free article] [PubMed] [Google Scholar]
- 23. Danilov S, Savoie F, Lenoir B, Jeunemaitre X, Azizi M, et al. (1996) Development of enzyme-linked immunoassays for human angiotensin I converting enzyme suitable for large-scale studies. J Hypertens 14: 719–727. [DOI] [PubMed] [Google Scholar]
- 24. Rice GI, Jones AL, Grant PJ, Carter AM, Turner AJ, et al. (2006) Circulating activities of angiotensin-converting enzyme, its homolog, angiotensin-converting enzyme 2, and neprilysin in a family study. Hypertension 48: 914–920. [DOI] [PubMed] [Google Scholar]
- 25. Fagyas M, Úri K, Mányiné IS, Fülöp GÁ, Csató V, et al. (2014) New perspectives in the renin-angiotensin-aldosterone system (RAAS) II: albumin suppresses angiotensin converting enzyme (ACE) activity in human. PLoS One doi:10.1371/journal.pone.0087844 [DOI] [PMC free article] [PubMed] [Google Scholar]
- 26. Fagyas M, Úri K, Mányiné IS, Daragó A, Boczán J, et al. (2014) New perspectives in the renin-angiotensin-aldosterone system (RAAS) I: endogenous angiotensin converting enzyme (ACE) inhibition. PLoS One doi:10.1371/journal.pone.0087843 [DOI] [PMC free article] [PubMed] [Google Scholar]
- 27. Beneteau B, Baudin B, Morgant G, Giboudeau J, Baumann FC (1986) Automated kinetic assay of angiotensin-converting enzyme in serum. Clin Chem 32: 884–886. [PubMed] [Google Scholar]
- 28. Rigat B, Hubert C, Corvol P, Soubrier F (1992) PCR detection of the insertion/deletion polymorphism of the human angiotensin converting enzyme gene (DCP1) (dipeptidyl carboxypeptidase 1). Nucleic Acids Res 20: 1433. [DOI] [PMC free article] [PubMed] [Google Scholar]
- 29. Lindpaintner K, Pfeffer MA, Kreutz R, Stampfer MJ, Grodstein F, et al. (1995) A prospective evaluation of an angiotensin-converting-enzyme gene polymorphism and the risk of ischemic heart disease. N Engl J Med 332: 706–711. [DOI] [PubMed] [Google Scholar]
- 30. Klauser RJ, Robinson CJ, Marinkovic DV, Erdös EG (1979) Inhibition of human peptidyl dipeptidase (angiotensin I converting enzyme: kininase II) by human serum albumin and its fragments. Hypertension 1: 281–286. [DOI] [PubMed] [Google Scholar]
- 31. Klauser RJ, Robinson CJ, Marinkovic DV, Erdös EG (1979) Inhibition of human peptidyl dipeptidase (angiotensin I converting enzyme: kininase II) by human serum albumin and its fragments. Hypertension 1: 281–286. [DOI] [PubMed] [Google Scholar]
- 32. Lieberman J, Sastre A (1986) An angiotensin-converting enzyme (ACE) inhibitor in human serum. Increased sensitivity of the serum ACE assay for detecting active sarcoidosis. Chest 90: 869–875. [DOI] [PubMed] [Google Scholar]
- 33. Brecher AS, Thevananther S, Wilson S (1996) Observation of high and low molecular weight inhibitors of angiotensin-converting enzyme in rat lung. Arch Int Pharmacodyn Ther 331: 301–312. [PubMed] [Google Scholar]
- 34. Wanasundara PKJPD, Ross ARS, Amarowicz R, Ambrose SJ, Pegg RB, et al. (2002) Peptides with angiotensin I-converting enzyme (ACE) inhibitory activity from defibrinated, hydrolyzed bovine plasma. J Agric Food Chem 50: 6981–6988. [DOI] [PubMed] [Google Scholar]
- 35. Nakagomi K, Yamada R, Ebisu H, Sadakane Y, Akizawa T, et al. (2000) Isolation of Acein-2, a novel angiotensin-I-converting enzyme inhibitory peptide derived from a tryptic hydrolysate of human plasma. FEBS Lett 467: 235–238. [DOI] [PubMed] [Google Scholar]
- 36. Nakagomi K, Fujimura A, Ebisu H, Sakai T, Sadakane Y, et al. (1998) Acein-1, a novel angiotensin-I-converting enzyme inhibitory peptide isolated from tryptic hydrolysate of human plasma. FEBS Lett 438: 255–257. [DOI] [PubMed] [Google Scholar]
- 37. Davidson NC, Barr CS, Struthers AD (1996) C-type natriuretic peptide. An endogenous inhibitor of vascular angiotensin-converting enzyme activity. Circulation 93: 1155–1159. [DOI] [PubMed] [Google Scholar]
- 38. Ikemoto F, Song GB, Tominaga M, Yamamoto K (1989) Endogenous inhibitor of angiotensin converting enzyme in the rat heart. Biochem Biophys Res Commun 159: 1093–1099. [DOI] [PubMed] [Google Scholar]
- 39. Ryan JW, Martin LC, Chung A, Pena GA (1979) Mammalian inhibitors of angiotensin converting enzyme (kininase II). Adv Exp Med Biol 120B: 599–606. [PubMed] [Google Scholar]
- 40. Guang C, Phillips RD (2009) Plant food-derived Angiotensin I converting enzyme inhibitory peptides. J Agric Food Chem 57: 5113–5120. [DOI] [PubMed] [Google Scholar]
- 41. León-Ruiz V, González-Porto AV, Al-Habsi N, Vera S, San Andrés MP, et al. (2013) Antioxidant, antibacterial and ACE-inhibitory activity of four monofloral honeys in relation to their chemical composition. Food Funct [DOI] [PubMed] [Google Scholar]
- 42. Rao S, Sun J, Liu Y, Zeng H, Su Y, et al. (2012) ACE inhibitory peptides and antioxidant peptides derived from in vitro digestion hydrolysate of hen egg white lysozyme. Food Chem 135: 1245–1252. [DOI] [PubMed] [Google Scholar]
- 43. Tauzin J, Miclo L, Gaillard JL (2002) Angiotensin-I-converting enzyme inhibitory peptides from tryptic hydrolysate of bovine alphaS2-casein. FEBS Lett 531: 369–374. [DOI] [PubMed] [Google Scholar]
- 44. Rogerson FM, Livett BG, Scanlon D, Mendelsohn FA (1989) Inhibition of angiotensin converting enzyme by N-terminal fragments of substance P. Neuropeptides 14: 213–217. [DOI] [PubMed] [Google Scholar]
- 45. Snyder RA, Wintroub BU (1986) Inhibition of angiotensin-converting enzyme by des-Leu10-angiotensin I: a potential mechanism of endogenous angiotensin-converting enzyme regulation. Biochim Biophys Acta 871: 1–5. [DOI] [PubMed] [Google Scholar]
- 46. Alhenc-Gelas F, Weare JA, Johnson RL, Erdös EG (1983) Measurement of human converting enzyme level by direct radioimmunoassay. J Lab Clin Med 101: 83–96. [PubMed] [Google Scholar]
- 47. Stevens J, Danilov S, Fanburg BL, Lanzillo JJ (1990) A sensitive two-site sandwich enzyme immunoassay for human angiotensin converting enzyme utilizing monoclonal antibodies. J Immunol Methods 132: 263–273. [DOI] [PubMed] [Google Scholar]
- 48. Agerholm-Larsen B, Nordestgaard BG, Tybjaerg-Hansen A (2000) ACE gene polymorphism in cardiovascular disease: meta-analyses of small and large studies in whites. Arterioscler Thromb Vasc Biol 20: 484–492. [DOI] [PubMed] [Google Scholar]
- 49. Van Dijk MA, Kroon I, Kamper AM, Boomsma F, Danser AH, et al. (2000) The angiotensin-converting enzyme gene polymorphism and responses to angiotensins and bradykinin in the human forearm. J Cardiovasc Pharmacol 35: 484–490. [DOI] [PubMed] [Google Scholar]
- 50. Danser AHJ, Batenburg WW, van den Meiracker AH, Danilov SM (2007) ACE phenotyping as a first step toward personalized medicine for ACE inhibitors. Why does ACE genotyping not predict the therapeutic efficacy of ACE inhibition? Pharmacol Ther 113: 607–618. [DOI] [PubMed] [Google Scholar]
- 51. Muller BR (2002) Analysis of serum angiotensin-converting enzyme. Ann Clin Biochem 39: 436–443. [DOI] [PubMed] [Google Scholar]
- 52. Kramers C, Danilov SM, Deinum J, Balyasnikova IV, Scharenborg N, et al. (2001) Point mutation in the stalk of angiotensin-converting enzyme causes a dramatic increase in serum angiotensin-converting enzyme but no cardiovascular disease. Circulation 104: 1236–1240. [DOI] [PubMed] [Google Scholar]
- 53. Nesterovitch AB, Hogarth KD, Adarichev VA, Vinokour EI, Schwartz DE, et al. (2009) Angiotensin I-converting enzyme mutation (Trp1197Stop) causes a dramatic increase in blood ACE. PLoS One 4: e8282. [DOI] [PMC free article] [PubMed] [Google Scholar]
- 54. Semmler A, Stein RW, Caplan L, Danilov SM, Klockgether T, et al. (2006) Hereditary hyper-ACE-emia due to the Pro1199Leu mutation of somatic ACE as a potential pitfall in diagnosis: a first family outside Europe. Clin Chem Lab Med 44: 1088–1089. [DOI] [PubMed] [Google Scholar]
- 55. Eyries M, Michaud A, Deinum J, Agrapart M, Chomilier J, et al. (2001) Increased shedding of angiotensin-converting enzyme by a mutation identified in the stalk region. J Biol Chem 276: 5525–5532. [DOI] [PubMed] [Google Scholar]
- 56. Linnebank M, Kesper K, Jeub M, Urbach H, Wüllner U, et al. (2003) Hereditary elevation of angiotensin converting enzyme suggesting neurosarcoidosis. Neurology 61: 1819–1820. [DOI] [PubMed] [Google Scholar]
- 57. Persu A, Lambert M, Deinum J, Cossu M, de Visscher N, et al. (2013) A novel splice-site mutation in angiotensin I-converting enzyme (ACE) gene, c.3691+1G>A (IVS25+1G>A), causes a dramatic increase in circulating ace through deletion of the transmembrane anchor. PLoS One 8: e59537. [DOI] [PMC free article] [PubMed] [Google Scholar]
- 58. Thevananther S, Brecher AS (1999) Isolation of angiotensin converting enzyme (ACE) binding protein from human serum with an ACE affinity column. Can J Physiol Pharmacol 77: 216–223. [PubMed] [Google Scholar]
- 59. Nakagomi K, Ebisu H, Sadakane Y, Fujii N, Akizawa T, et al. (2000) Properties and human origin of two angiotensin-I-converting enzyme inhibitory peptides isolated from a tryptic hydrolysate of human serum albumin. Biol Pharm Bull 23: 879–883. [DOI] [PubMed] [Google Scholar]
- 60. Úri K, Fagyas M, Mányiné IS, Kertész A, Csanádi Z, et al. (2014) New perspectives in the renin-angiotensin-aldosterone system (RAAS) IV: Circulating ACE2 as a biomarker of systolic dysfunction in human hypertension and heart failure. PLoS One [DOI] [PMC free article] [PubMed] [Google Scholar]
- 61. Tipnis SR, Hooper NM, Hyde R, Karran E, Christie G, et al. (2000) A human homolog of angiotensin-converting enzyme. Cloning and functional expression as a captopril-insensitive carboxypeptidase. J Biol Chem 275: 33238–33243. [DOI] [PubMed] [Google Scholar]
- 62. Ferreira AJ, Shenoy V, Qi Y, Fraga-Silva RA, Santos RAS, et al. (2011) Angiotensin-converting enzyme 2 activation protects against hypertension-induced cardiac fibrosis involving extracellular signal-regulated kinases. Exp Physiol 96: 287–294. [DOI] [PMC free article] [PubMed] [Google Scholar]
- 63. Oudit GY, Liu GC, Zhong J, Basu R, Chow FL, et al. (2010) Human recombinant ACE2 reduces the progression of diabetic nephropathy. Diabetes 59: 529–538. [DOI] [PMC free article] [PubMed] [Google Scholar]
- 64. Howard G, Downward G, Bowie D (2001) Human serum albumin induced hypotension in the postoperative phase of cardiac surgery. Anaesth Intensive Care 29: 591–594. [DOI] [PubMed] [Google Scholar]