


Figure 2.
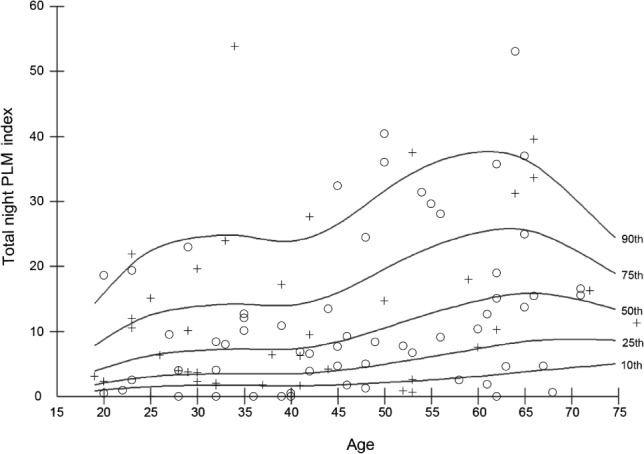
Sex- and age-related distribution of periodic limb movement in total night indices. The panel shows the percentiles (10th, 25th, 50th, 75th, 90th) for the total night periodic limb movement (PLM) indices in relation to age. Individuals are presented as circles (women) or crosses (men). The overall age-group difference was significant (P = 0.030).