

Abstract

Second harmonic generation (SHG) microscopy measurements indicate that inkjet-printed racemic solutions of amino acids can produce nanocrystals trapped in metastable polymorph forms upon rapid solvent evaporation. Polymorphism impacts the composition, distribution, and physico-kinetic properties of organic solids, with energetic arguments favoring the most stable polymorph. In this study, unfavored noncentrosymmetric crystal forms were observed by SHG microscopy. Polarization-dependent SHG measurement and synchrotron X-ray microdiffraction analysis of individual printed drops are consistent with formation of homochiral crystal production. Fundamentally, these results provide evidence supporting the ubiquity of Ostwald’s Rule of Stages, describing the hypothesized transitioning of crystals between metastable polymorphic forms in the early stages of crystal formation. Practically, the presence of homochiral metastable forms has implications on chiral resolution and on solid form preparations relying on rapid solvent evaporation.
1. Introduction
The crystalline form of a solid can profoundly affect its physical and chemical properties, with both stable and metastable crystal polymorphs potentially accessible during crystal formation. In a few relatively rare cases, the time frame for polymorph transitioning can be long enough to enable detection of the metastable intermediates using conventional existing methods.1−3 Perhaps the most famous example involves the case of ritonavir (Norvir).4−6 Only when a more thermodynamically stable Form II polymorph of ritonavir first appeared in commercial Norvir gel caps was it realized that the initial form was metastable. The more stable Form II exhibited much slower dissolution kinetics, and the product had to be withdrawn from the market and reformulated.
Formation of metastable polymorphs can be interpreted thermodynamically according to the Ostwald–Lussac’s Rule of Stages, which states that the form having the Gibbs free energy closest to the solvated molecules in the mother liquor will crystallize first,1,7,8 followed by adiabatic transitions through increasingly more stable forms before ultimately arriving at the most stable crystal form.3 However, this purely thermodynamic argument is based on an adiabatic limit. In practice, direct observation of such polymorph transitions are challenging given the rare and transient nature of crystal nucleation. More than a century after the original hypothesis by Ostwald, methods are now becoming available to systematically observe polymorphic transitions experimentally according to the Ostwald Rule of Stages at the individual building-block scale in a few model systems.9−11 Studies of colloidal crystal nucleation have provided a route for increasing the size of the “molecule” to one large enough to observe by conventional optical microscopy.3,9 Experiments of protein crystallization12 and simulations of relatively simple model systems11,13−16 also support a multistep process for crystallogenesis. The most compelling evidence for direct observation of rapid transitioning according to the Ostwald Rule of Stages in a system with directional bonding arguably comes from electron microscopy measurements of LiFePO4 nanocrystals.3 In this study Chung and co-workers observed at least four different polymorphic forms of the inorganic crystal sequentially at atomic resolution during high-temperature crystal formation. However, these atom/particle model systems generally consist of relatively simple highly symmetric building blocks with low barriers for interconversion between polymorphs and correspondingly facile polymorph transitioning. More complex molecules of low symmetry with greater conformational freedom generally can be expected to exhibit larger entropic barriers for interconversion. Consequently, studies working toward the broader goal of characterizing complex molecular species have been limited primarily by the difficulties in definitively isolating and characterizing the individual transient structures at low concentration and small sizes generated during the very earliest stages following crystal nucleogenesis.
According to classical nucleation theory, the rates of formation and growth of crystal nuclei arise from an interplay between surface free energy (ΔGS) and bulk free energy (ΔGB).10,12,17,18 The critical cluster size for nucleation corresponds to the maximum in the total free energy surface, as shown in Figure 1. The polymorph with the lowest barrier for nucleation may not necessarily correspond to the most thermodynamically stable bulk form. The transition to the most stable form can arise from two mechanisms. First, the relatively unstable polymorph can spontaneously convert to the alternative form, which requires another solid-state nucleation event. Second, the presence of crystallites of the stable polymorphic form elsewhere within the mother liquor can grow at the expense of the metastable forms through Ostwald ripening. In either case evidence of these polymorphic transformations is difficult to obtain as crystal nucleation is intrinsically a rare event and polymorphic changes upon nucleation are generally expected to be short lived.
Figure 1.

Change in Gibbs free energy change (ΔG) as a function of the radius of the cluster. Solid lines are the net free energy change of a cluster as a function of radius. Surface (dotted) and bulk (dashed) free energy represent the positive and negative contributions to the total energy. Critical radii (r*3D) and the corresponding (ΔG*3D) for two different polymorphs correspond to the maxima in the solid traces.
The conditions most likely to result in long-lived metastable polymorph generation correspond to small, confined volumes and rapid desolvation to reduce the possibility of ripening or interconversion. Inkjet printing, which deposits picoliter dots of solutions on substrates, is well matched to these requirements. In addition, inkjet printing can serve as a model for other deposition techniques involving rapid solvent evaporation, including spray drying, which is used routinely in the preparation of high surface area APIs.19
In the current study, piezoelectric inkjet printing was employed to produce metastable polymorphs of proline and second harmonic generation (SHG) microscopy used as a probe for identifying noncentrosymmetric (metastable) crystal domain formation. Two algorithm approaches, principal component analysis (PCA) and autocorrelation, have been used on the polarization-dependent SHG images and X-ray diffraction images of inkjet-printed dots to verify the presence of kinetically trapped metastable polymorphs of proline upon rapid crystallization from racemic solutions. The majority of the amino acids, including both proline and serine, produce centrosymmetric racemic cocrystals when crystallized from racemic aqueous solutions.20−22 Consequently, any noncentrosymmetric crystal forms prepared from such solutions would necessarily be metastable. However, crystal polymorphism studies using conventional methods (e.g., diffraction, Raman, infrared spectroscopy, NMR, calorimetry, etc.) typically do not have the sensitivity to selectively identify small quantities of the rare, unfavored polymorphs in mixtures.23
Second-harmonic generation can be used as a contrast mechanism, as it is highly selective for noncentrosymmetric submicrometer-sized noncentrosymmetric (i.e., chiral) crystals23 and produces no coherent SHG signal from liquids (even from a noncentrosymmetric solution), gases, and amorphous solids.20,23−26 Crystals grown from a racemic proline solution are expected to be centrosymmetric, racemic cocrystals22 and should not produce any SHG signal. However, the presence of detectable SHG signal from inkjet-printed microcrystals can serve as a simple indicator of the presence or absence of metastable polymorphic forms. Polarization-resolved SHG microscopy can further enhance the information content of SHG measurements,27,28 given the sensitivity of the polarization dependence of SHG to crystal form and orientation. SHG can also be used to rapidly identify regions of interest for X-ray diffraction analysis, which in turn can be used to characterize polymorphism.28−30 Here, we demonstrate the use of autocorrelation analysis of scattering patterns to recover high signal-to-noise XRD “powder patterns” from picograms to femtograms of material produced by piezoelectric inkjet printing and use this approach for structural analysis of the metastable forms.
2. Methods
d-Proline and l-proline, assay ≥ 99%, were purchased from Sigma-Aldrich and used without any further purification. Homochiral solutions (0.7 M) of each were made in deionized water, and racemic solution was prepared by obtaining an equal volume of each. In order to produce thermodynamically controlled racemic proline crystals, the racemic solution was kept on the hot plate with gentle heat for 30 min to prepare a supersaturated solution and then cooled to room temperature and kept in a fume hood overnight for spontaneous crystallization. Fine white crystals were formed. Racemic mixtures of dry proline crystals were prepared by crushing equal parts of the two homochiral proline powders in a mortar and pestle.
Homochiral and racemic proline solutions were printed on hydrophobic glass coverslips and on MiTeGen UV–vis 100 μm MicroTip by a Fujifilm Dimatix Material printer DMP 2800. Proline solutions were printed in dot matrix arrays with 80 μm periodicity between spots and 120 μm periodicity between rows, respectively (10 × 10 array). A standard monopolar waveform with an average jetting voltage of 33 V and nozzle temperature of 48 °C were used to print the arrays. Deposited volumes of <8 and <2 fL were estimated from the residual solid on the substrate in the array dots from homochiral and racemic solutions. The average printing time of each pattern was ∼10–12 s.
A built-in-house beam-scanning SHG microscope was used to acquire images. Beam scanning was performed with a resonant vibrating mirror (∼8 kHz, EOPC) along the fast-axis scan and a galvanometer (Cambridge) for slow-axis scanning. The 80 MHz Ti:sapphire pulsed laser (Spectra-Physics Mai Tai) of 100 fs pulse width directed through the scan mirrors and focused onto the sample using a 10× objective of working distance 1.6 cm (Nikon, N.A. = 0.30). Under typical operating conditions, the incident wavelength was 800 nm, with 80 mW laser power recorded before the objective. In order to reduce 1/f noise in the polarization-dependent measurements, a custom electro-optical modulator (EOM, Conoptics) was positioned in the beam path, enabling high-frequency (16 MHz) modulation of the polarization state of the beam. The laser repetition rate was doubled by an orthogonal pulse pair generator, in which the primary beam was split and recombined following a 6.25 ns delay to produce an interleaved pulse train of orthogonal polarizations prior to the EOM.31 Synchronous digitization of each laser pulse with strict timing control was used to identify the polarization dependence of each incident laser shot.32 Polarized transmission SHG signals were collected, with dichroic mirrors and narrow band-pass filters (Chroma HQ400/20 m-2p) centered around 400 nm placed prior to the photomultiplier tube detectors (Burke, XP 2920PC). Matlab code was written in-house to control the scanning mirrors and communication with the data acquisition electronics. Concurrently with the transmission SHG detection, bright-field images were acquired by measuring the extinction of the 800 nm beam using a photodiode, also acquired in transmission. Bright-field and SHG images were rendered and analyzed with Image J to produce a set of 10 unique polarization-dependent images per detector, and “analyze particles” options were used to measure the area of each dot in bright field as well as SHG active regions.33
X-ray microdiffraction measurements were acquired at GM/CA beamline 23-ID-B with a 10 μm diameter, 12.0 keV X-ray beam with 1 s exposure time, at a photon flux of 1.3 × 10¹⁰ photons s–1 (5-fold attenuation) and detector distance of 150 mm, at the Advanced Photon Source within Argonne National Laboratory.28−30 An SHG microscope built into the beamline and described previously was used to discriminate between the SHG-active and -inactive dots in inkjet-printed arrays and position them within a collimated 10 μm diameter X-ray beam.30 Diffraction patterns were collected from both SHG-active and -inactive dots of racemic proline and from pure l-proline dot.
Analysis of the X-ray scattering images was performed by autocorrelation over the azimuthal rotation angle for peak detection in order to suppress diffuse scatter and improve the S/N of the diffraction measurements. In brief, scattering images were transformed into polar coordinates by use of python image processing,34 followed by autocorrelation along the φ axis which was performed by the Wiener-Kmintchine method.35,36 The differences between the asymptotic mean of the azimuthal autocorrelogram and the mean of the autocorrelogram over steps of 1–4 pixels were plotted as a function of the radial 2θ angle. This algorithm served to retain sharp features in the scattering pattern consistent with diffraction while suppressing rolling features from diffuse scattering arising from amorphous materials or through inelastic scattering events. For comparative purposes, conventional powder XRD scattering patterns were also produced simply by integration over all the azimuthal angles and all regions probed by the X-ray beam.
For the polarization-dependent studies, principal component analysis (PCA) was performed on 10 different input and output SHG polarization combinations using R v.2.15 with the built-in PCA function (princomp).28,37 Each pixel in the SHG images was treated as a “hyperspectral” vector in a 10-dimensional polarization space.27 PCA separates the data into the eigenvectors or principal components that maximize the total variance in the data set, the first few of which provide the greatest separation within the polarization-dependent dimensions.
3. Results and Discussion
Laser transmittance and SHG images of racemic proline crystals produced by solvent evaporation from racemic solutions and physical mixtures (1:1 mass ratio) of two homochiral powder are presented in Figure 2. The crystals of homochiral proline from aqueous solution adopt a P212121 space group as the thermodynamically favored form,38 which is SHG active. A physical mixture of the two homochiral crystalline materials prepared by grinding produced an ensemble that was racemic overall but still primarily comprised of homochiral crystalline domains. SHG imaging of these materials produced a strong signal. The disparity between the bright regions in the SHG image and the optical transmittance images suggests that scattering losses in the optically opaque regions attenuated the SHG response, either through scattering of the fundamental and the corresponding reduction of SHG or through the scattering of the coherent SHG to angles outside the acceptance cone of the collection objective. Alternatively, the darker regions could correspond to domains in which the racemic solid dispersion has undergone phase transformation to either an amorphous material or the racemic cocrystal.39 The racemic proline cocrystal produced upon crystallization of proline from a racemic solution adopts a P21/c space group22 with a centrosymmetric lattice, which is forbidden by symmetry from producing SHG.24,26 Combining the results from all of the considered cases, the SHG activity was >50-fold in the physical mixture of homochiral crystals than in the powders produced upon crystallization from a racemic solution.
Figure 2.

Bright-field images of laser transmittance (top row) and SHG images (bottom row) of racemic proline, obtained from two different conditions. The physical mixture (a and c) was made by grinding equal amounts of d- and l-proline in a mortar and pestle. Overnight crystallization of a saturated racemic proline solution produces white racemic cocrystals (b and d), which was also crushed in a mortar and pestle for imaging. Racemic crystals did not produce any detectable SHG signals.
Inkjet-printing racemic proline solutions on hydrophobic glass slides produced markedly different results. Figure 3a and 3b are bright-field and SHG images of inkjet-printed racemic proline solution, respectively. Seven out of 12 printed dots produced SHG signal, while the other five did not (red circles in Figure 3b) show any SHG activity. Similar SHG activity was observed from multiple dot arrays (not shown) with >60% of printed racemic dots exhibiting SHG activity. The average SHG photon counts of 45 ± 6 from racemic dots were comparable to the average SHG counts of 45 ± 5 from BaTiO3 nanocrystals (200 nm) in polyethylene glycol (PEG) from the same laser power. SHG signals (Figure 3b) coincide qualitatively with locations of laser extinction (Figure 3a), although extinction arose over quantitatively larger areas. From the SHG intensity measurements (presented in Table 1), 82 ± 2% of the area within the homochiral dot was SHG active, compared to just 58 ± 2% in the racemic dot exhibiting SHG activity.
Figure 3.
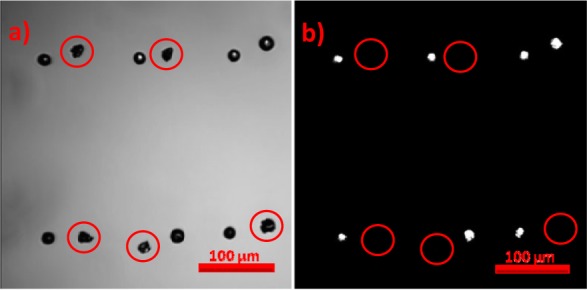
Bright-field (a) and SHG (b) images of dot matrix-printed racemic solution. There are 12 dots of racemic proline in the field of view. Seven of them formed a round-shaped dot, while the remaining five formed jagged shapes. Only the round-shaped dot generated substantial amounts of SHG.
Table 1. Statistical Details of Bright-Field and SHG Images of Inkjet-Printed Dot Matrices of Proline Solution (uncertainties correspond to 95% confidence intervals).
| proline | average area in bright field (pixels) | SHG active area (pixels) | SHG active area (%) | avg SHG intensity (counts) |
|---|---|---|---|---|
| d-proline | 375 ± 3 | 310 ± 3 | 83 ± 1 | 9 ± 2 |
| l-proline | 336 ± 4 | 270 ± 4 | 80 ± 2 | 6 ± 2 |
| racemic proline | 235 ± 4 | 137 ± 4 | 58 ± 2 | 45 ± 6 |
Several possible origins of the observed SHG activity upon inkjet printing were considered. SHG is well known to arise at interfaces between centrosymmetric media from local symmetry breaking.24,26 In heterogeneous dots, multiple interfaces between amorphous and/or crystalline domains may be present, contributing to interfacial SHG. The anticipated magnitude of the interfacial response can be estimated based on the relative number of bulk versus interfacial molecules producing signal. Assuming a ∼1 μm2 beam waist and a similarly sized crystal, the number of interfacial molecules is roughly 104-fold lower than the number of bulk molecules within a crystalline lattice (assuming a ∼10 Å lattice constant). Given the quadratic scaling of SHG with number density, this difference corresponds to a ∼108-fold difference in anticipated SHG from the interface of a centrosymmetric or amorphous media versus a noncentrosymmetric crystalline lattice. The observation of SHG activity comparable in brightness to the highly SHG-active BaTiO3 nanoparticles suggests formation of bulk-allowed noncentrosymmetric crystal domains within the dot and not SHG arising from interfaces. In addition, SHG from impurities in the racemic solutions is unlikely to serve as a major source of background, as those same solutions were used to prepare the SHG-inactive samples by slow drying. Therefore, the SHG activity from inkjet printing of the racemic solutions was attributed to noncentrosymmetric crystal formation.
Inkjet-printed homochiral proline samples were also studied, prepared from the same stock solutions used to produce the racemic solutions, producing representative SHG micrographs shown in Figure 4. The top row are laser transmittance images, and the bottom row are SHG images of inkjet-printed homochiral (d and l) proline. The average areas of the homochiral dots were larger than the racemic dots, possibly attributed to a lower surface tension, higher contact angle, and more spherical initial droplet of a homochiral proline solution compared to that of the racemic solution. Secondary dot formation adjacent to the main drop, known as satellites, was observed from nonuniform ejection of the ink dot from the cartridge from nonideal matching of the ink to the jetting waveform, incorrect voltages, or high surface tension. No surfactant was used in these studies, which introduced additional challenges in control proper drop formation. The observation of clearly detectable SHG activity from each dot (Figure 4c and 4d) is consistent with formation of the known thermodynamically favored and SHG-active P212121 space group38,40 adopted by homochiral proline upon crystallization from aqueous solution.
Figure 4.

Bright-field (a and b) and SHG image of inkjet-printed d- and l-proline (c and d) are shown for comparing the bright-field and SHG images; all dots in the field of view are SHG active.
The disparities between the total printed areas of the dot and the fraction of them that exhibited SHG activity suggest that a significant amorphous content remained following printing. For the dot prepared from homochiral solutions, all published polymorphs of proline identified by the authors fall into space groups that are allowed for SHG.38,41 Therefore, it is reasonable to assign the SHG-inactive area to regions containing either amorphous proline or nanocrystalline proline with crystal sizes falling below the detection limits of SHG (i.e., SHG amorphous). In the racemic dot, the SHG-inactive domains could correspond to either amorphous proline or SHG-inactive racemic cocrystals. If it is assumed that 20% of the area corresponds to amorphous material as in the homochiral dot, then the inactive co-crystal may potentially occupy 22% area of the remaining 80% area. However, this SHG-inactive fraction represents the minor constituent within the dot, rather than the major. Both the cross-sectional area of the dot exhibiting SHG activity and the integrated brightness of the racemic dot (the SHG active racemic crystals were 2–3 times brighter than crystals in either homochiral dot) suggest that the majority of the printed volume corresponds to an SHG-active metastable polymorphic form.
In order to confirm that the SHG-active domains were indeed from metastable crystal forms, SHG-active inkjet-printed dots prepared from racemic solutions were rehydrated by extended exposure to 100% relative humidity and reanalyzed (Supporting Information). The rehydrated dots exhibited SHG activities that were reduced 5-fold (18%) compared to the initially prepared dots after 24 h in 100% relative humidity, which is consistent with interconversion to more stable crystal forms.
While the simple SHG intensity measurements summarized in Figures 3 and 4 indicate the presence of SHG-active crystals produced from the racemic solution, the SHG intensity alone provides little meaningful information on the forms of the crystals produced. The observation of SHG activity could potentially be arising from either homochiral crystallization, from generation of noncentrosymmetric racemic cocrystals with both enantiomers present within the lattice, or some combination of the two.
Polarization-dependent SHG measurements were acquired and interpreted using principal component analysis (PCA) to aid in assessing the crystal forms produced upon inkjet printing the racemic solutions. A set of 10 polarization-dependent micrographs was used to define a 10-dimensional “polarization space”, with PCA used to reduce the majority of the relevant polarization-dependent information to a few key principal components containing the majority of the intrinsic information content in the polarization-dependent data set. PCA results from the 10 different polarization combination images of inkjet-printed racemic proline solution and a histogram of all the dot are presented in Figure 5. Together, PC1 and PC2 contain 96% of the total signal variance. The first principal component, PC1, was dominated by differences in overall intensity as a function of location.28,42,43 Therefore, PC2 carried the majority of the polarization dependence of the measurements. This interpretation is also consistent with previous work designed to detect different crystal domains by SHG imaging demonstrating that PC2 carries the majority of the polarization-dependent information.28 Figure 5g is the histogram of PC2 values averaged within each dot.
Figure 5.

(a–c and d–f) Images of the first two principle components of proline. (g) Histogram of all SHG active d-proline, l-proline, and racemic proline crystals. PC1 corresponds mostly to overall signal intensity, and PC2 corresponds mostly to the polarization-dependent SHG response. d and l crystals give similar overall intensity and were separable only in their polarization-dependent response. Racemic proline had a less characteristic polarization-dependent response but was characteristically brighter than d and l crystals.
Interestingly, the histogram of PC2 values indicates reasonable separation between d- and l-proline by polarization-dependent SHG microscopy. This result is somewhat surprising given that SHG is not predicted to enable discrimination between the two enantiomers from an isotropic population of crystal orientations (analogous to hyper-Rayleigh scattering). The ability to resolve the two therefore suggests preferred crystal orientation (e.g., from heterogeneous templating by the solid interface). It is even more remarkable that the influence of absolute chirality appears to provide a greater inherent variance in the SHG measurements than changes related to the random population of azimuthal orientations of the crystals. Both effects can be seen by inspection of the PC2 images in Figure 5, in which the PC2 values varied significantly within the individual dot (attributed to a population of oriented crystals), but integration over the dots nevertheless produced overall darker spots for the d-proline and vice versa for the l-proline.
Dot arrays prepared from printing the racemic solution produced PC2 values intermediate between the two homochiral crystal results. These observations are consistent with formation of a population of homochiral crystals within the dot generated from printing the racemic solution. However, several alternative possibilities were also considered. First, the SHG activity could be emerging from a noncentrosymmetric polymorph that still includes both enantiomers within the unit cell. No such forms are known for proline but could still be formed under kinetic control. It would be coincidental for the polarization dependence of such a form to lie between the two homochiral poles in the histogram within Figure 5, but the possibility cannot be definitively excluded based solely on the SHG measurements.
X-ray microdiffraction measurements using synchrotron radiation were also performed to characterize the structures produced upon inkjet printing of proline solutions (Figure 6). Figure 6a and 6b shows the bright-field and SHG images of l-proline printed onto an X-ray microtip, respectively. Using a microfocused beam only 10 μm in diameter to reduce background scatter, diffraction analysis could be performed on each individual printed dot. A representative scattering pattern is shown in Figure 6c. The small probed volume and even smaller crystal sizes associated with the diffraction measurements placed them between the two extreme limits of single-crystal diffraction and powder X-ray diffraction (PXRD), in which a statistical population of crystal sizes and orientations are probed. The conditions of the current experiments preclude the ability to obtain large single crystals from inkjet-printed drops; however, they also do not produce enough microcrystals to approximate all possible crystal orientations. Consequently, an autocorrelation-based approach was developed to recover a powder-like pattern from the spots present in the scattering image, illustrated in Figure 6. First, the scattering image was transformed from Cartesian coordinates to radial coordinates, after first performing calibration to place the center of the undiffracted beam within one pixel of the center of the 4096 × 4096 element X-ray detection array. Following this transformation, the diffuse rings circling the beam stop in the initial image appear as vertical swaths in radial coordinates. Next, autocorrelation was performed along the azimuthal axis (vertical axis in Figure 6d). From the autocorrelogram at each radial 2θ distance, integration was performed over the short-lived features (1–4 pixels) corresponding to spots in the original scattering image, followed by subtraction of the asymptotic baseline arising from the diffuse scattering background. Autocorrelation provides no discrimination based on absolute azimuthal position, recovering a one-dimensional diffraction pattern analogous to what one might obtain by powder XRD (Figure 6e). Similar analyses were performed on several printed dots of the racemic solution (both SHG active and SHG inactive) as well as a printed dot of homochiral l-proline.
Figure 6.

(a and b) Laser bright-field and SHG images of inkjet-printed l-proline on a microtip, respectively. White spots in b are the SHG active inkjet-printed drops. (c) X-ray diffraction image of a single 10 × 10 μm spot obtained from the center of the corresponding SHG active droplet. Dark spots in this diffraction image correspond to high signal-to-noise diffraction peaks arising from the crystal. (d) Diffraction image remapped into polar coordinates, in which ϕ is the azimuthal rotation angle and 2θ is the proportional to the distance from the image center, corresponding to the location of the undiffracted beam. The powder-like pattern shown in e was produced by autocorrelation along the azimuthal direction to select for sharp diffraction spots, followed by integration over the baseline-subtracted autocorrelogram. High signal-to-noise of the diffracted peak is shown in the inset.
Even with the autocorrelation analysis, the small volumes within each printed dot did not allow for statistical sampling of crystal orientations, complicating quantitative determination of crystal form directly from the relative intensities of the diffracted peaks. Therefore, the positions of peaks with S/N > 100 were used as the primary factor for structural assignment. A comparison of these peak intensities is presented in Figure 7. The integrated intensities under these similar diffraction peaks were calculated along with total area under each peak in between 10° and 28° diffraction angles. Results indicate that 64% of the integrated peak intensity from SHG-active racemic dot corresponded to 2θ locations also present for l-proline, while only 5% of the area under the peak is present for SHG-silent racemic proline. These results further support the polarization-dependent SHG analyses, suggesting that the homochiral metastable crystal polymorph forms upon rapid inkjet printing from an aqueous solution.
Figure 7.
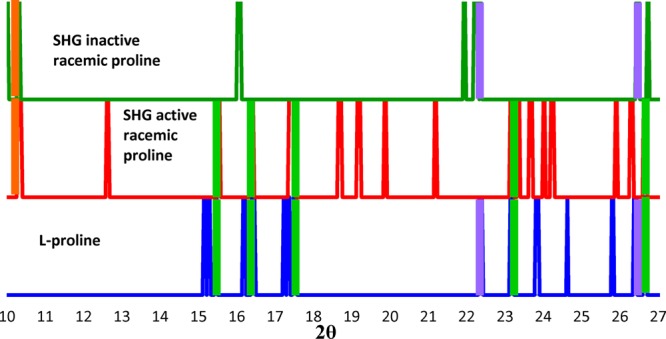
Comparison of the XRD peak positions for a racemic dot exhibiting no SHG activity (top row), racemic dots that were bright for SHG (middle row), and a SHG-active dot of l-proline. Peaks correspond to locations of diffraction exhibiting S/N > 100. Intensities were omitted as orientational affects make these nontrivial to compare. Purple shading indicates regions where l-proline peaks match the SHG inactive racemate spots, green highlights where l-proline and the SHG active racemate spots match, and orange highlights where the two racemates share peaks missing from the l-proline samples.
Interestingly, about one-third of the diffracted intensity within the SHG-active racemic dot did not overlap with diffraction peaks observed in either the homochiral dot or the racemic SHG-inactive dot. This disparity could arise from undersampling of the homochiral dot, such that not all 2θ diffraction locations were adequately sampled within the limited number of dots analyzed. Alternatively, additional crystal forms may be present that do not correspond to constituents of either of the other two sets of dots (i.e., homochiral and racemic SHG inactive). Nevertheless, it appears that the homochiral metastable crystals comprise the majority composition of the racemic SHG-active dots based on X-ray microdiffraction analysis. Consequently, the SHG-active domains are attributed to homochiral crystalline domains, with an equal probability of forming from the d- or l-enantiomers on a single nanocrystal basis.
In addition to the SHG and XRD analyses, confocal Raman measurements within individual inkjet-printed dots were acquired by signal integration for 1.5 h in a single inkjet confocal volume positioned within the printed dots and compared with Raman spectra of the pure powders generated with 10 s integration times (summarized in the Supporting Information). For dots printed from the homochiral solutions, spectral features qualitatively similar to those observed from the racemic powder were observed. However, interpretation of the spectra was complicated by preferred orientation effects, as the relative intensities of the different Raman features are markedly different for the inkjet-printed proline versus the powder spectra. Attempts were made to obtain confocal Raman spectra of the SHG-active dots produced from racemic solutions, but no sharp spectral features consistent with crystalline lysine were observable, prohibiting meaningful assessment of crystal polymorphism by Raman. The absence of detectable Raman is attributed to the relatively weak Raman cross-section of proline, the trace quantities of crystalline material present, and the relatively high detection limits of Raman microscopy compared to both SHG and the minibeam synchrotron XRD method developed in this work. The S/N of the most prominent Raman peak was 16 after 1.5 h of signal averaging, compared to a S/N of >3000 from the synchrotron XRD measurements for a 1 s XRD integration time per pixel and 250 μs per pixel integration time for SHG.
The phase diagram of proline provides a framework for describing the thermodynamic driving factors underpinning crystallization (Figure 8). Klussmann, Blackmond, and co-workers presented a framework for predicting the anticipated eutectic points from combined solubility measurements of the enantiopure homochiral form and the racemic cocrystal.44−46 Using this model, the solid lines for the phase boundaries were calculated using just the solubilities of the racemic and homochiral solutions. In the case of proline crystallizing from an aqueous solution, the solubilities of the two crystal forms are similar, with a solubility ratio of α = [racemic]sat/[enantiopure]sat = 0.78, resulting in an anticipated eutectic point corresponding to a 0.89 mol fraction of pure enantiomer (or equivalently, and enantiomeric excess of 0.74). These results are in good qualitative agreement with previous studies of the crystallization of proline from hydrophobic solvents (CHCl3 and CHCl3/MeOH mixtures), in which the racemic form was found to exhibit substantially lower solubility than the enantiopure form and indicating a strong preference for formation of the racemic cocrystal.44,46 However, the measured phase diagram in Figure 8 is in better qualitative agreement with the previous crystallizations in DMSO yielding a solubility ratio closer to 1. Quantitatively the solubility ratio in DMSO was reported to be α = 1.155,44 while the measurements presented here indicate α = 0.78 in H2O. Overall, the slightly lower solubility of the racemic form suggests that both crystal forms are energetically accessible under the conditions of the experiment, but the racemic cocrystal is clearly the thermodynamically favored crystal produced from a racemic solution. Therefore, observation of SHG-active forms emerging from a racemic solution indicates that crystallization is proceeding under kinetic control.
Figure 8.

Ternary phase diagram of d-proline, l-proline, and H2O at 25 °C. Experimental data points (red circles) are plotted in this triplot according to their mass percentage, and it is assumed that the data points are symmetric about the vertical axis. Solid lines connecting points DER and RE′L represent the saturated solution, and E, E′ are the eutectic composition. The eutectic mass percentage was found to be 74%, calculated from the solubility of homochiral and racemic proline.
The presence of transient SHG-active polymorphic forms can be understood qualitatively from classical nucleation theory. Homogeneous crystal nucleation is driven by the interplay between an interfacial free energy cost and a volume free energy gain under conditions of supersaturation (Figure 1). Polymorphic forms with different interfacial free energy costs and volume gains have the potential to exhibit lower barriers for initial nucleation.8,17 Under adiabatic conditions, curve crossing between different polymorphic forms can arise to ultimately favor growth of the most thermodynamically stable crystal form. However, curve crossing may be avoided under nonadiabatic conditions of rapid solvent evaporation, promoting continued growth of kinetically trapped metastable polymorphs. If the SHG-active polymorphs are comprised of homochiral crystalline domains, transitioning to the more stable racemic cocrystal would require significant changes in the fundamental composition of the lattice, which may explain the presence of a relatively large kinetic barrier to interconversion.
4. Conclusion
The rapid drying of inkjet-printed dots of racemic proline solutions on substrates produce SHG-active domains. These domains were attributed to the presence of metastable polymorphic forms kinetically trapped during rapid solvent desolvation, which supports Ostwald’s conjecture of polymorph transitioning during crystallogenesis. Given the ubiquity of inkjet printing and the related approach of spray drying as a preparative method for pharmaceutical ingredients combined with the impact of crystal polymorphism on bioavailability, these findings may help guide future API formulation strategies that involve inkjet printing and spray drying.
For example, the possibility of a kinetic route to enable homochiral resolution has potential implications in pharmaceutical syntheses and preparation of final dosage forms. While crystallization is arguably the most energy-efficient means of resolving homochiral compounds from an enantiomeric mixture, the process is only currently viable in the absence of resolving agents (e.g., chiral salts) under conditions in which the homochiral polymorph is the thermodynamically most stable form. Unfortunately, homochiral crystallization is often found to be the exception rather than the rule, with most compounds favoring racemic cocrystal production as in proline. However, if the emerging crystal form can be placed under kinetic control rather than thermodynamic control, a host of new possible options and architectures emerge for efficient chiral resolution through crystallization. SHG imaging may help enable such developments by rapidly identifying and optimizing potentially promising conditions.
Acknowledgments
The authors gratefully acknowledge Dr. Alexander Wei for his help with the inkjet printing and Dr. Duangporn Wanapun for her contributions in the instrumental and experimental design. Support was provided by the National Institutes of Health, Award Nos. NIH-R01GM103401 and NIH-R01GM103910, the National Institute for Pharmaceutical Technology and Education (NIPTE), Award No. NIPTE-106361, and support for algorithm development and integrated XRD & SHG instrumentation by the Center for Direct Catalytic Conversion of Biomass to Biofuels (C3Bio), an Energy Frontier Research Center funded by the U.S. Department of Energy, Office of Science, Office of Basic Energy Sciences, Award No. DE-SC0000997.
Supporting Information Available
SHG micrographs of racemic dots prior to and following extended exposure in a 100% relative humidity environment; confocal Raman spectra for inkjet-printed dots and pure powders. This material is available free of charge via the Internet at http://pubs.acs.org.
The authors declare no competing financial interest.
Funding Statement
National Institutes of Health, United States
Supplementary Material
References
- Nývlt J. Cryst. Res. Technol. 1995, 30, 443–449. [Google Scholar]
- Hamilton B. D.; Hillmyer M. A.; Ward M. D. Cryst. Growth Des. 2008, 8, 3368–3375. [Google Scholar]
- Chung S.-Y.; Kim Y.-M.; Kim J.-G.; Kim Y.-J. Nat. Phys. 2008, 5, 68–73. [Google Scholar]
- Chemburkar S. R.; Bauer J.; Deming K.; Spiwek H.; Patel K.; Morris J.; Henry R.; Spanton S.; Dziki W.; Porter W.; Quick J.; Bauer P.; Donaubauer J.; Narayanan B. A.; Soldani M.; Riley D.; McFarland K. Org. Process Res. Dev. 2000, 4, 413–417. [Google Scholar]
- Morissette S. L.; Soukasene S.; Levinson D.; Cima M. J.; Almarsson O. Natl. Acad. Sci. U.S.A. 2003, 100, 2180–2184. [DOI] [PMC free article] [PubMed] [Google Scholar]
- Bauer J.; Spanton S.; Henry R.; Quick J.; Dziki W.; Porter W.; Morris J. Pharm. Res. 2001, 18, 859–866. [DOI] [PubMed] [Google Scholar]
- Terry T. Org. Process Res. Dev. 2003, 7, 1017–1027. [Google Scholar]
- Wilhelm O. Z. Phys. Chem. 1897, 22, 289–330. [Google Scholar]
- Gasser U.; Weeks E. R.; Schofield A.; Pusey P. N.; Weitz D. A. Science 2001, 292, 258–262. [DOI] [PubMed] [Google Scholar]
- Zhang T. H.; Liu X. Y. Angew. Chem., Int. Ed. Engl. 2009, 48, 1308–1312. [DOI] [PubMed] [Google Scholar]
- Chakraborty D.; Patey G. N. J. Phys. Chem. Lett. 2013, 4, 573–578. [DOI] [PubMed] [Google Scholar]
- Vekilov P. G. J. Cryst. Growth 2005, 275, 65–76. [Google Scholar]
- Anwar J.; Boateng P. K. J. Am. Chem. Soc. 1998, 120, 9600–9604. [Google Scholar]
- Anwar J.; Zahn D. Angew. Chem., Int. Ed. Engl. 2011, 50, 1996–2013. [DOI] [PubMed] [Google Scholar]
- Lutsko J.; Nicolis G. Phys. Rev. Lett. 2006, 96, 046102. [DOI] [PubMed] [Google Scholar]
- Mucha M.; Jungwirth P. J. Phys. Chem. B 2003, 107, 8271–8274. [Google Scholar]
- Erdemir D.; Lee A. Y.; Myerson A. S. Acc. Chem. Res. 2009, 42, 621–629. [DOI] [PubMed] [Google Scholar]
- Vekilov P. G. Cryst. Growth Des. 2010, 10, 5007–5019. [DOI] [PMC free article] [PubMed] [Google Scholar]
- Basaran O. a.; Gao H.; Bhat P. P. Annu. Rev. Fluid Mech. 2013, 45, 85–113. [Google Scholar]
- Hall V. J.; Simpson G. J. J. Am. Chem. Soc. 2010, 132, 13598–13599. [DOI] [PubMed] [Google Scholar]
- Jean J., André Collet S. H. W.. Enantiomers, Racemates, and Resolutions; Wiley: New York, 1981. [Google Scholar]
- Myung S.; Pink M.; Baik M. H.; Clemmer D. E. Acta Crystallogr., Sect. C 2005, 61, o506–8. [DOI] [PubMed] [Google Scholar]
- Wanapun D.; Kestur U. S.; Kissick D. J.; Simpson G. J.; Taylor L. S. Anal. Chem. 2010, 82, 5425–5432. [DOI] [PubMed] [Google Scholar]
- Boyd R. W.Nonlinear Optics, 3rd ed.; Academic Press: Rocheste, NY, 2008; pp 2–4. [Google Scholar]
- Knight P. L. Opt. Acta Int. J. Opt. 1985, 32, 1–2. [Google Scholar]
- Stegeman G. I.; Stegeman R. A.. Nonlinear Optics: Phenomena, Materials and Devices; John Wiley & Sons: NJ, 2012. [Google Scholar]
- Begue N. J.; Simpson G. J. Anal. Chem. 2010, 82, 559–566. [DOI] [PubMed] [Google Scholar]
- DeWalt E. L.; Begue V. J.; Ronau J. a; Sullivan S. Z.; Das C.; Simpson G. J. Acta Crystallogr., Sect. D: Biol. Crystallogr. 2013, 69, 74–81. [DOI] [PMC free article] [PubMed] [Google Scholar]
- Kissick D. J.; Dettmar C. M.; Becker M.; Mulichak A. M.; Cherezov V.; Ginell S. L.; Battaile K. P.; Keefe L. J.; Fischetti R. F.; Simpson G. J. Acta Crystallogr., Sect. D: Biol. Crystallogr. 2013, 69, 843–851. [DOI] [PMC free article] [PubMed] [Google Scholar]
- Madden J. T.; Toth S. J.; Dettmar C. M.; Newman J. A; Oglesbee R. A; Hedderich H. G.; Everly R. M.; Becker M.; Ronau J. A; Buchanan S. K.; Cherezov V.; Morrow M. E.; Xu S.; Ferguson D.; Makarov O.; Das C.; Fischetti R.; Simpson G. J. J. Synchrotron Radiat. 2013, 20, 531–540. [DOI] [PMC free article] [PubMed] [Google Scholar]
- Jr S. E. J. Light Technol. 1992, 10, 28–35. [Google Scholar]
- Muir R. D.; Sullivan S. Z.; Oglesbee R.; Simpson G. J.. Rev. Sci. Instrum. 2013, accepted for publication. [Google Scholar]
- Abramoff M. D.; Magalhaes P. J.; Ram S. J. Biophotonics Int. 2004, 11, 36–42. [Google Scholar]
- Klington J. python image information along a polar coordinate system - Stack Overflow; http://stackoverflow.com/questions/3798333/image-information-along-a-polar-coordinate-system/3806851#3806851 (accessed Aug 27, 2013).
- Wiener N.Acta Math. 1930, 55, 117–258. [Google Scholar]
- Khintchine A. Math. Ann. 1934, 109, 604–615. [Google Scholar]
- Jolliffe I. T.Principal Components in Regression Analysis. In Principal Component Analysis; Springer: New York, 2002; pp 167–198. [Google Scholar]
- Wright B. A.; Cole P. A. Acta Crystallogr. 1949, 2, 129–130. [Google Scholar]
- Carter C., Barry M. G. N.Ceramic Materials; Springer New York: New York, 2007; pp 444–462. [Google Scholar]
- Wampler R. D.; Kissick D. J.; Dehen C. J.; Gualtieri E. J.; Grey J. L.; Wang H.-F.; Thompson D. H.; Cheng J.-X.; Simpson G. J. J. Am. Chem. Soc. 2008, 130, 14076–14077. [DOI] [PMC free article] [PubMed] [Google Scholar]
- Seijas L. E.; Delgado G. E.; Mora A. J.; Fitch A. N.; Brunelli M. Powder Diffr. 2012, 25, 235–240. [Google Scholar]
- Lee J. L. S.; Gilmore I. S.; Seah M. P. Surf. Interface Anal. 2008, 40, 1–14. [Google Scholar]
- Loukas C. G.; Wilson G. D.; Vojnovic B.; Linney A. Cytom. A 2003, 55, 30–42. [DOI] [PubMed] [Google Scholar]
- Klussmann M.; White A. J. P.; Armstrong A.; Blackmond D. G. Angew. Chem., Int. Ed. Engl. 2006, 45, 7985–7989. [DOI] [PubMed] [Google Scholar]
- Klussmann M.; Iwamura H.; Mathew S. P.; Wells D. H.; Pandya U.; Armstrong A.; Blackmond D. G. Nature 2006, 441, 621–623. [DOI] [PubMed] [Google Scholar]
- Kellogg R. M. Angew. Chem., Int. Ed. Engl. 2007, 46, 494–497. [DOI] [PubMed] [Google Scholar]
Associated Data
This section collects any data citations, data availability statements, or supplementary materials included in this article.