

Abstract
The basal ganglia may play an important role in the control of motor scaling or effort. Recently local field potential (LFP) recordings from patients with deep brain stimulation electrodes in the basal ganglia have suggested that local increases in the synchronisation of neurons in the gamma frequency band may correlate with force or effort. Whether this feature uniquely codes for effort and whether such a coding mechanism holds true over a range of efforts is unclear. Here we investigated the relationship between frequency-specific oscillatory activities in the subthalamic nucleus (STN) and manual grips made with different efforts. The latter were self-rated using the 10 level Borg scale ranging from 0 (no effort) to 10 (maximal effort). STN LFP activities were recorded in patients with Parkinson's Disease (PD) who had undergone functional surgery. Patients were studied while motor performance was improved by dopaminergic medication. In line with previous studies we observed power increase in the theta/alpha band (4–12 Hz), power suppression in the beta band (13–30 Hz) and power increase in the gamma band (55–90 Hz) and high frequency band (101–375 Hz) during voluntary grips. Beta suppression deepened, and then reached a floor level as effort increased. Conversely, gamma and high frequency power increases were enhanced during grips made with greater effort. Multiple regression models incorporating the four different spectral changes confirmed that the modulation of power in the beta band was the only independent predictor of effort during grips made with efforts rated < 5. In contrast, increases in gamma band activity were the only independent predictor of effort during grips made with efforts ≥ 5. Accordingly, the difference between power changes in the gamma and beta bands correlated with effort across all effort levels. These findings suggest complementary roles for changes in beta and gamma band activities in the STN in motor effort coding. The latter function is thought to be impaired in untreated PD where task-related reactivity in these two bands is deficient.
Keywords: Basal ganglia, Local field potentials, Beta oscillation, Gamma oscillation, Motor effort coding
Highlights
-
•
Changes in motor effort are associated with changes in oscillatory synchronisation in the STN.
-
•
The precise pattern of changes in STN activity depends on the degree of effort.
-
•
Failure of these changes may contribute to impairment in effort in Parkinson's Disease.
Introduction
Neuronal recordings in monkeys and imaging studies in healthy humans have suggested that the basal ganglia play an important role in the control of the scaling of motor responses, as often measured in terms of the amplitude, velocity or force of an action (Delong et al., 1984; Spraker et al., 2007; Turner and Anderson, 1997; Vaillancourt et al., 2007). However, it is not necessarily that the basal ganglia are themselves directly involved in the parameterisation of these measures through the control of muscular contraction; rather, along with other functions, they determine the effort or vigour to be attributed to a response that is then organised elsewhere (Schmidt et al., 2008; Shadmehr and Krakauer, 2008; Turner and Desmurget, 2010). Indeed, a distinction between effort and action dynamics would seem functionally relevant, as effort may increase while force and other measures stay constant or even fall, as might be the case when muscles begin to fatigue. Derangement of the effort ascribing function of the basal ganglia has formed the basis for recent theoretical accounts of motor impairment in Parkinson's disease (Mazzoni et al., 2007). Direct recordings from basal ganglia targets in patients suggest that local synchronisation in the gamma band may contribute to the selection of effort or force levels for voluntary movements. Thus the power over 60–80 Hz in the local field potential (LFP) in the globus pallidus correlates with the movement amplitude and velocity of the contralateral hand of patients with cranial dystonia, a condition that ostensibly spares hand function (Brücke et al., 2012). Similar correlations have been noted in patients with Parkinson's disease between power in the LFP of the subthalamic nucleus over 70–90 Hz and movement speed (Joundi et al., 2012), and between the LFP power in the subthalamic nucleus over 55–375 Hz and force (Anzak et al., 2012). Conversely, lower levels of 55–375 Hz power and their further reduction while contraction is meant to be sustained are both associated with greater force decrement over time in Parkinsonian patients (Tan et al., 2013).
Whether these correlations with effort measures are limited to the gamma band is, however, less clear. It is well established that beta band power in basal ganglia LFPs is suppressed prior to and during voluntary movements, but whether this might help dictate force measures is uncertain. Several studies have reported that the depth of beta desynchronization is relatively fixed regardless of force or movement speed (Anzak et al., 2012; Brücke et al., 2012; Joundi et al., 2012), consistent with the hypothesis that suppression of population synchrony in the beta frequency range serves a permissive role, allowing task-related rate coding and more focal neuronal assemblies to engage in task-specific processing related to voluntary movement (Brown and Williams, 2005). At odds with this though, other studies have reported that the level of suppression of beta power does vary with the details of task performance, including the force generated (Androulidakis et al., 2008; Kempf et al., 2007; Tan et al., 2013).
Some of these conflicting results may relate to the interdependency of spectral features and may be clarified by multivariate approaches to statistical dependencies (Anzak et al., 2012). However, task details may also be important. Here we test the hypothesis that both beta desynchronisation and gamma synchronisation in the basal ganglia relate to motor effort, but that their relative contributions depend on the level of effort exerted.
Methods
Subjects
Nine patients with idiopathic Parkinson's Disease (mean disease duration 13 years, mean age 62 years, range 49–69 years; 7 males) provided informed consent to take part in this study, which was approved by the local ethics committees. Patients underwent bilateral implantation DBS electrodes into the STN, as a prelude to therapeutic high frequency stimulation for advanced idiopathic PD with motor fluctuations and/or dyskinesia. Techniques to target and implant electrodes in the STN have previously been described (Foltynie and Hariz, 2010). Microelectrode recordings were not made during surgery. The permanent quadripolar macroelectrode used was model 3389 (Medtronic Neurologic Division, Minneapolis, MN, USA) featuring four platinum–iridium cylindrical surfaces. Its contacts are numbered 0, 1, 2, and 3, with 0 being the most caudal and contact 3 being the most cranial. Localisation was supported intra-operatively by the effects of direct stimulation (cases 1–4) and by immediate post-operative stereotactic imaging. Nonetheless, in acknowledgement of the fact that not all electrode contacts could be expected to lie in the STN per se, we term the area sampled by the electrode contact the STN region (STNr). DBS electrode extension cables were externalized through the scalp to enable recordings prior to connection to a subcutaneous DBS pacemaker, implanted in a second operative procedure up to seven days later. One out of the nine patients (case 1) had only one electrode externalized for testing, thus we could record from 17 STN regions (STNr). Clinical details of the patients are given in Table 1. The patients showed 53.4 ± 6.2% (p < 0.001) improvement in the motor section of the Unified Parkinson's Disease Rating Scale (UPDRS) on treatment with levodopa, indicating good responsiveness to this drug.
Table 1.
Surgical sites: (1) John Radcliffe Hospital, Oxford; (2) Kings College Hospital, London; (3) National Hospital for Neurology and Neurosurgery, London, United Kingdom.
| Site | Patient number | Age (years) | Disease duration (years) | Daily dose (mg) | Preoperative UPDRS part III |
|
|---|---|---|---|---|---|---|
| OFF | ON | |||||
| 1 | 1 | 69 | 15 | Ropinirole 8 Pramipexole 0.7 Levodopa 900 |
38 | 18 |
| 1 | 2 | 65 | 17 | Amantadine 400 Levodopa 600 |
55 | 49 |
| 2 | 3 | 73 | 14 | Rotigotine 16 Selegeline 10 Levodopa 700 |
35 | 15 |
| 2 | 4 | 63 | 14 | Ropinirole 23 Levodopa 150 |
35 | 24 |
| 3 | 5 | 49 | 13 | Levodopa 800 Apomorphine (6.3 mg/h) Rotigotine 8 |
38 | 13 |
| 3 | 6 | 56 | 10 | Trihexyphenidyl 24 Levodopa 1000 |
40 | 12 |
| 3 | 7 | 60 | 11 | Levodopa 600 Pramipexole 0.7 |
53 | 16 |
| 3 | 8 | 56 | 6 | Levodopa 400 Entacapone 800 Rotigotine 8 |
52 | 19 |
| 3 | 9 | 67 | 16 | Levodopa 600 Amantadine 200 Ropinirole 24 Rasagiline 1 |
32 | 13 |
Experimental paradigm
Subjects were seated in a comfortable chair with their shoulders adducted and their elbows flexed at about 90°. They were presented with a series of imperative visual cues (red light-emitting diode illuminated for 3 s), separated by 11–13 s, and instructed to ‘choose an effort level from the scale provided and then to squeeze the force dynamometer at this chosen effort level when the light comes on and maintain this squeeze for the duration of the light’. The subjects were asked to report the effort level verbally right after each grip. They were also asked to try and randomise their selection of effort levels, so that all levels were represented. Subjects were provided with the Rated Perceived Exertion Scale with 10 levels ranging from zero to 10 (Borg, 1998; Supplementary material). Patients were asked to grip following illumination of the LED, but were not requested to respond as quickly as possible.
Recordings
Recordings were made when the patients were ON their usual dopaminergic medication, 3–6 days postoperatively, while electrodes were externalized and before implantation of the pulse generator. Grip force was measured one hand at a time using an isometric dynamometer with standard Jamar design, and it's handle set in the second of the five discrete grip diameter adjustments possible (G200; Biometrics Ltd, Cwmfelinfach, Gwent, UK; Sancho-Bru et al., 2008). The order in which left and right hands were tested was counterbalanced across subjects. Monopolar LFPs were recorded with a TMSi porti (TMS International, Netherlands) and its respective software. They were low and high pass filtered at 0.5 and 500 Hz, respectively. Force was only low pass filtered at 200 Hz. LFP and force were originally at 2048 Hz. The effort level the subject reported verbally after each grip was logged manually and then used to label each individual trial.
Analysis
The mean number (± SEM) of remaining trials per hand was 31 ± 2 grips. Analyses of both behavioural and LFP data were performed in Matlab (version 2010b). The grip force trajectory of each individual trial of each subject was normalized against the average maximal force that the subject achieved in their maximal effort trials. Normalized peak force, normalized peak yank (differentiation of force) and response time were calculated for each individual trial and averaged across trials with the same self-rated effort (SRE), before averaging across subjects. Response time was operationally defined as the time interval between cue onset and the point at which force exceeded 5% of peak force (taken as response onset).
LFP data were converted off-line to give three bipolar contact pairs (01, 12 and 23) per electrode. A time-frequency decomposition based on the continuous wavelet transform was then applied to LFP recordings from each trial to analyse changes in LFP activity in the time–frequency domain. Event related LFP power was subsequently normalized relative to the average power during the one second before the cue, so that a value higher than zero indicated power higher than before the cue and vice versa. The normalized (event related synchronisation, ERS, and event related desynchronisation, ERD) power was aligned to movement onset and subsequently averaged across the three bipolar contacts for each STNr lead contralateral to the gripping hand. We averaged across all the contact pairs in a given electrode so as to avoid selection bias, although not all contacts will have been in the STN per se. Grand averages of behavioural and LFP data for a given SRE were calculated after deriving each of these variables from the individual grips made by a subject, averaging across trials for a given SRE in that subject, and then averaging across study participants.
Statistics
Statistical analyses were performed in SPSS Statistics 19 (SPSS Inc., Chicago, IL, USA). Visual inspection of Q–Q plots and Kolmogorov–Smirnov tests were used to confirm that behavioural measures and LFP data were normally distributed. Where necessary, raw data were transformed using a monotonic Box–Cox transformation prior to further parametric testing. Multiple regressions were used to identify which, if any, frequency specific LFP activities were significant independent predictors for SRE. The modelling errors of the multiple regressions were also assessed by Q–Q plots, together with plots of the standardized residuals (the errors) with respect to the regression standardized predicted values. In this way we were able to check that the model residuals were normally distributed and also satisfied the assumption of homoscedasticity. Means ± standard error of means (SEM) are presented throughout the text, unless otherwise specified.
Results
Effort level correlates with force parameters but not response time
The force trajectory of each grip was normalized to the maximal force achieved in the maximal effort trials in that subject and aligned to movement onset (Fig. 1). Response time, normalized peak force and normalized peak yank were calculated from the force trajectory of each individual grip, and averaged across trials with a given SRE before averaging across subjects. Linear regression analysis showed that the SRE correlated well with average normalized peak force (r = 0.741, p < 0.001, n = 170), peak yank (r = 0.664, p < 0.001, n = 170) and total force from the time of force onset to the time of peak force (r = 0.821, p < 0.001, n = 170). However, there was a lack of correlation between response time and SRE (r = 0.129, p = 0.094, n = 170). Mean response times were 0.387 ± 0.091 across grips of different SRE.
Fig. 1.
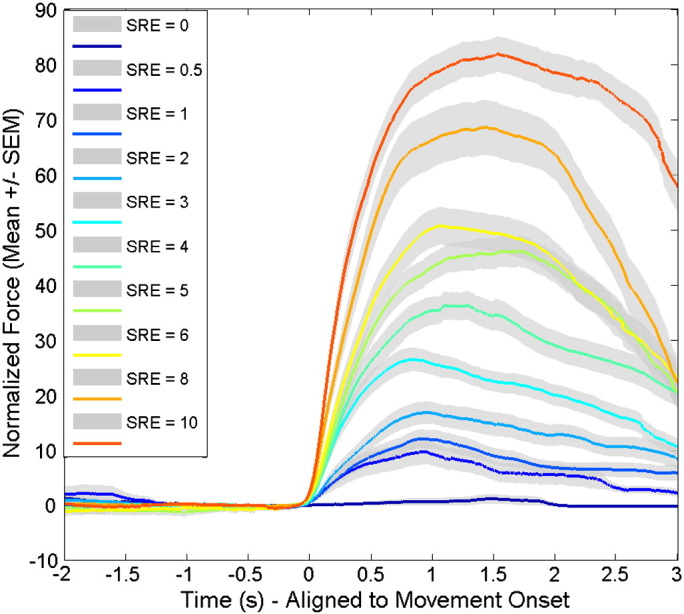
Force trajectories at different SRE levels. These have been normalized to peak force in the maximal effort trials for each hand and aligned to movement onset before averaging across hands. Lines are the average across subjects and shading represents the standard error.
Increasing effort level is accompanied by reciprocal changes in the beta and gamma bands
Time–frequency decomposition was applied to STNr LFPs recorded during individual grips, and the power change for each frequency was calculated by normalizing the power at each time point against the average power during the 1 s before cue presentation. Trials were grouped into either low effort (SRE < 5) or high effort (SRE ≥ 5) ranges and averaged within and across subjects (Fig. 2). A general pattern of enhanced theta (4–7 Hz) and alpha (8–12 Hz) and decreased low beta (13–22 Hz) and high beta (23–30 Hz) activity was observed prior to and following response onset (Figs. 2A and B). In addition, there was a prominent increase in gamma (55–90 Hz) spectral power with movement onset, particularly over the high effort range. Finally there was an increase in activity at even higher frequency (101–375 Hz), but this was small compared with the activity in the gamma band. As LFP reactivity was similar within the 4–12 Hz and 13–30 Hz bands, activities in these frequency ranges were averaged to give ‘theta/alpha’ and ‘beta’ bands (see also Tan et al., 2013). Thus, subsequent analysis of the LFP activity focused on four frequency bands: alpha/theta (4–12 Hz), beta (13–30 Hz), gamma (55–90 Hz) and high frequency (101–375 Hz).
Fig. 2.

Group average STNr LFP power changes over time. Power change across (A and C) the low effort (SRE levels < 5) and (B and D) high effort (SRE ≥ 5) ranges at different frequencies. There were power increases in the theta (4–7 Hz) and alpha (8–12 Hz) bands, and a decrease in both low (13–22 Hz) and high beta (23–30 Hz) band just prior to and following response onset. There was a prominent increase in gamma (55–90 Hz) power with response onset that was greater over the high effort range. Activities in a broad high frequency band (101–375 Hz) also increased with response onset, more prominently in high effort trials, although the relative increase was much smaller than the activity in the gamma band. LFP power was normalized to the period between 1.5 s and 0.5 s before the cue and re-aligned to movement onset before averaging. Shading represents the standard error.
Average power changes between the onset of grip force and the time to peak force (a duration of 1.24 s ± 0.17 s; hitherto termed the force generation period) were estimated over the four frequency bands in individual grips. These values were then averaged across low effort (SRE < 5) and high effort (SRE ≥ 5) ranges for each subject. A two-way repeated-measures ANOVA applied to the average power change during force generation identified an effect of frequency band (F3,48 = 7.757, p < 0.001) and an interaction between frequency band and effort range (F3,48 = 3.651, p = 0.019). Paired-sample t-tests confirmed that, compared with the low effort range, the high effort range had significantly lower power in the beta band (13–30 Hz; t16 = 4.204, p = 0.001) and higher power in both the gamma band (55–90 Hz; t16 = − 4.948, p < 0.001) and high frequency band (101–375 Hz; t16 = − 3.467, p = 0.003) during force generation (Fig. 3). Finally, we repeated this ANOVA for the two beta sub-bands (low beta, 13–22 Hz and high beta, 23–30 Hz). This failed to show any effect of frequency (F1,16 = 0.464, p = 0.506) nor interaction between frequency sub-band and effort range (F1,16 < 0.001, p = 0.999). There was, however, a main effect of effort level (F1,16 = 9.025, p = 0.008).
Fig. 3.

Group average STNr LFP power changes between movement onset and time to peak force over the low and high effort ranges. Both the desynchronisation in the beta band (13–30 Hz) and the synchronisations in the gamma (55–90 Hz) and high frequency (101–375 Hz) bands were enhanced over the high effort range compared to the low effort range. The power increase in the theta/alpha band (4–12 Hz) did not change with effort range. * denotes p < 0.05. Error bars are SEMs.
Figs. 2C and D suggest that spectral changes were less sustained in low effort than in high effort contractions, particularly in the high beta sub-band. Could the analysis based on average spectral changes over the force generation period have confounded our assessment of the behaviour of different frequency ranges? To discount this possibility we calculated the average over a 0.4 second window around the peak absolute spectral change after the movement onset, and repeated the above ANOVA. This confirmed an effect of frequency band (F3,48 = 49.327, p < 0.001) and an interaction between frequency band and effort range (F3,48 = 5.808, p = 0.002). Paired-sample t-tests confirmed that, compared with the low effort range, the high effort range had a significantly lower power trough in the beta band (13–30 Hz; t16 = 6.387, p < 0.001) and higher power peak in both the gamma band (55–90 Hz; t16 = − 4.0139, p = 0.001) and the high frequency band (101–375 Hz; t16 = − 2.336, p = 0.033). Thus the results were similar irrespective of whether changes were contrasted over the force generation period or during a shorter 0.4 s window around peak power changes.
Different spectral features correlate with low and high effort grips within subjects
Partial correlation was used to investigate the relationship between LFP power changes during force generation in each of the four frequency bands and SRE within subjects, while controlling for the effect of activity in the remaining three frequency bands. This was assessed for each STNr with respect to grips made with the contralateral hand. The mean and standard error of the partial correlation coefficients are shown for the different frequency bands for low and high effort ranges in Fig. 4.
Fig. 4.

Grand average of partial correlation coefficients between SRE and power changes in different frequency bands. There was a positive correlation between gamma band power changes and SRE levels but not over the low effort range. There was a negative correlation between beta band power change and SRE levels but not over the high effort range. There was no consistent correlation between theta/alpha power change or high frequency change and SRE, when activities from other frequency bands were controlled, irrespective of effort level. Error bars are SEMs.
Single sample t tests showed that when considering data from all effort levels from one STN together, both the partial correlation coefficients between beta power change and effort (r = − 0.163 ± 0.054, t16 = − 3.052, p = 0.008) and that between gamma power change and effort (r = 0.237 ± 0.061, t16 = 3.906, p = 0.001) were significantly different from zero. Further analysis with a two-way repeated measures ANOVA of partial correlation coefficients with frequency band (alpha/theta, beta, gamma and high frequency) and effort range (low effort: SRE < 5 and high effort: SRE ≥ 5) as main effects identified an effect of frequency band (F3,48 = 4.232, p = 0.010), an effect of effort range (F1,16 = 19.882, p < 0.001) and an interaction between frequency band and effort range (F3,48 = 3.472, p = 0.023). Further analyses with paired t-tests confirmed that the negative correlations between SRE and power change in the beta band in the low effort range (r = − 0.310 ± 0.047) were diminished in the high effort range (r = − 0.058 ± 0.067; t16 = − 3.539, p = 0.003). In contrast, there was a positive correlation between SRE and power change in the gamma band in the high effort range (r = 0.387 ± 0.053), which was absent in the low effort range (r = 0.086 ± 0.054; t16 = − 3.361, p = 0.004). There was no consistent correlation between effort range and LFP activity in the theta/alpha and high frequency band or effects of effort levels on the correlation coefficients in these two frequency bands (Fig. 4). Finally, note that the mean partial correlation coefficients for beta activity were greater over SRE < 5 than over all SRE (t16 = − 2.582, p = 0.020), while the mean partial correlation coefficients for gamma activity were greater over SRE ≥ 5 than over all SRE (t16 = − 2.720, p = 0.015).
Although we studied patients on levodopa when gamma activity should have been promoted, we cannot discount the possibility that the scaling of gamma and high frequency activity with increasing effort at low effort levels could not be discriminated due to low signal to noise ratios in these frequency bands. However, this appears unlikely; even at low effort levels we were able to detect a significant increase in gamma activity (single sample t test, t16 = 3.764, p = 0.002) and high frequency band activity (single sample t test, t16 = 5.440, p < 0.001) during the force generation period (Fig. 3). This was despite the fact that mean partial correlation coefficients were not significantly different to zero for gamma (single sample t test, t16 = 0.311, p = 0.760; Fig. 4) or high frequency (single sample t test, t16 = 1.215, p = 0.242) activity within this effort range, when the effects of activities in other frequency bands were controlled. Fig. 5 suggests that this was because there was no simple linear relationship between these activities and effort over SRE < 5.
Fig. 5.

Dependency of STNr LFP band changes on effort levels. Power changes relative to baseline are presented for the period from response onset to time of peak force. Note beta band power suppression was progressively enhanced over SRE levels 0 to 5 and then plateaued, whereas gamma power increases were variable until SREs ≥ 5, following which there was a monotonic increase. Activities in the high frequency band tended to increase with increasing SRE, but the relative change was much smaller than in the gamma band and there were dips at the lowest and highest effort levels. Synchronisation in the theta/alpha band was very variable between subjects and displayed no consistent relationship with SRE level. Error bars are SEMs.
Different spectral features correlate with low and high effort grips across subjects
Average power changes in the STNr contralateral to grips were estimated over the four frequency bands during force generation across trials with a given SRE level, and then averaged across sides in different subjects. Desynchronisation in the beta band was progressively enhanced as SRE level increased from 0 to 4, but plateaued upon further increases in SRE (Fig. 5). In contrast, synchronisation in the gamma band was particularly enhanced as SRE level increased from 5 to 10. There was no systematic relationship between group average theta/alpha power changes and SRE levels.
Multiple linear regression with average power changes over the four bands in the STNr contralateral to grips as independent variables (Box–Cox transformed) and SRE levels as the dependent variable in the low effort range (SRE 0–4; F4,91 = 3.808, p = 0.006 and adjusted R2 = 0.095 for the model) revealed that power change in the beta band was an independent predictor of SRE level (standardized β = − 0.262, t95 = − 2.263, p = 0.026). Thus a one standard deviation decrease in beta power led to a 0.262 standard deviation increase in SRE level in the low effort range while other variables in the model were held constant. Changes in power in the theta/alpha (standardized β = 0.055, t95 = 0.476, p = 0.635), gamma bands (standardized β = 0.132, t95 = 1.261, p = 0.210) or high frequency (standardized β = 0.130, t95 = 1.293, p = 0.199) did not significantly predict SRE over the low effort range.
This was repeated over the high effort range (SRE 5–10; F4,55 = 3.081, p = 0.035 and adjusted R2 = 0.114 for the model). Under these circumstances only power change in the gamma band was an independent predictor of SRE level, with increases in gamma power being associated with higher levels of effort (standardized β = 0.435, t59 = 2.615, p = 0.011). Thus a one standard deviation increase in gamma power led to a 0.435 standard deviation increase in SRE level while other variables in the model were held constant, so that gamma power was a stronger determinant of effort level in the high effort range than beta power in the low effort range. Theta/alpha (standardized β = − 0.275, t59 = − 1.701, p = 0.095), beta (standardized β = − 0.033, t59 = − 0.256, p = 0.799) and high frequency (standardized β = − 0.022, t59 = − 0.121, p = 0.904) band activities did not significantly predict SRE over the high effort range.
A combination of power changes encodes effort across all effort levels
The above findings and Fig. 5 suggest that a combination of beta and gamma power changes might correlate with SRE level over the whole range of effort. Multiple regression with theta/alpha, high frequency power change and the difference between gamma and beta as independent variables and SRE as the dependent variable applied to all SREs (F3,154 = 21.808, p < 0.001 and adjusted R2 = 0.267 for the model) showed that the difference between gamma and beta was a significant predictor for SRE level (standardized β = 0.395, t157 = 5.249, p < 0.001). Changes in the theta/alpha band or high frequency band were non-contributory (standardized β = − 0.029, t157 = − 0.391, p = 0.697 and standardized β = 0.156, t157 = 1.320, p = 0.189, respectively). The group average difference between power changes in the gamma and beta bands correlated even more strikingly with the SRE level across the whole effort range (0–10; Pearson correlation coefficient, r2 = 0.9282, n = 10, p < 0.001; Fig. 6a).
Fig. 6.

Group average difference between power changes in gamma and beta bands correlates with SRE levels and normalized peak force. Each point is the group average power difference (± standard error) at a given SRE (A) or a given range of the normalized peak force (B). Thick and thin black lines are the regression line and its 95% confidence limits.
Earlier it was noted that SRE correlated well with average normalized peak force. Thus we repeated the multiple regression with normalized peak force over the whole range of effort as the dependent variable and theta/alpha and high frequency power changes and the difference in gamma and beta band power changes as the independent variables. This gave a more noisy model but with similar results: the model was significant (F2, 155 = 4.284, p = 0.015 and adjusted R2 = 0.053; compared with an adjusted R2 = 0.267 for the model with SRE), the difference between gamma and beta was a significant predictor for normalized peak force (standardized β = 0.231, t157 = 2.923, p = 0.004), but not the power change in theta/alpha band (standardized β = − 0.033, t157 = 0.413, p = 0.680) or high frequency bands (standardized β = 0.047, t157 = 0.595, p = 0.552). The group average difference between power changes in the gamma and beta bands correlated with normalized peak force (Pearson correlation coefficient, r2 = 0.9156, n = 10, p < 0.001; Fig. 6B).
LFP recordings were focal and findings were preserved when analysing only the contact paper with the highest beta power at rest
LFP recordings from the STNr were highly focal, as indexed by steep percentage drops in power when comparing the contact pair with the highest absolute power to the mean power recorded by the two remaining contact pairs on each electrode. Relative to the best contact pair, the relative mean power in the frequencies of interest for the two remaining channels dropped to: theta/alpha: 44.2 ± 13.6%; beta: 59.8 ± 7.8%, gamma: 69.9 ± 7.3% and high frequency: 41.7 ± 17.3%.
Our results hitherto have been based on LFP spectra that were averaged across all contact pairs, so as to avoid selection bias. The ANOVA results were similar if spectral data were just analysed from the contact pair of each electrode with the highest beta power at rest (Supplementary material). Increased effort level was accompanied by lower power in the beta band and higher activity in both the gamma and high frequency bands. There was an interaction between effort levels and frequency bands in the within-subject trial-to-trial partial correlation coefficients between the power changes and SRE. There was a negative correlation between SRE and power change in the beta band, which was identified as the only independent predictor at low effort levels. There was a positive correlation between SRE and power change in gamma band, which was identified as the only independent predictor at high effort levels. The only departure from our previous results based on averaging across all contact pairs was that high frequency activity estimated at the contact pair with the highest beta activity at rest was an independent predictor for SRE and normalized peak force, but only when regression models were simplified by substituting the difference between gamma and beta activities for changes in these bands considered separately.
Discussion
We have previously shown that frequency-specific LFP activities in the STNr correlate with force-related variables in manual grips made with maximal effort (Anzak et al., 2012; Tan et al., 2013). In the current study we demonstrate that this is also true at lower levels of effort, but that the precise pattern of LFP involvement depends on the effort range. Thus low effort contractions correlate with the degree of beta (13–30 Hz) band suppression whereas high effort contractions correlate with the degree of gamma (55–90 Hz) band synchronisation. Our recordings provide further evidence that the basal ganglia play an important role in the control of the scaling of motor responses (Delong et al., 1984; Spraker et al., 2007; Turner and Anderson, 1997; Vaillancourt et al., 2007), and highlight that this function may hold over the whole range of efforts and be associated with changes in oscillatory synchronisation in the STN, as indexed by changes in the LFP (Hammond et al., 2007).
Before considering the significance of the findings in greater detail we should acknowledge three possible limitations of the present study. First, participants were necessarily PD patients who had undergone surgery, so inferences with regard to normal functioning must be circumspect (Williams et al., 2002). That said, recordings were made on levodopa, while patients' clinical state was as near normal as possible. Second, even depth recordings of LFPs can be subject to volume conduction of activities from cerebral cortex. To mitigate this, we recorded in a bipolar configuration from the contacts of the DBS electrode and demonstrated a steep gradient in LFP power between contact pairs, consistent with a local generator (Kühn et al., 2004; Kühn et al., 2006). Furthermore, several studies have confirmed the locking of neuronal discharge to LFP oscillations in the STN (Kühn et al., 2005; Levy et al., 2002; Weinberger et al., 2006). However, this brings us to the third limitation. In order to avoid selection bias we averaged the results of all contact pairs of a given electrode, some of which will have been close to but not within the STN per se. This may have led us to underestimate the strength of behavioural correlations arising from activities within the STN. To counter this we also analysed power change at the contact pair of each electrode that had the highest beta power at rest, based on the premise that activity at this contact pair is most likely to represent that in the STN itself (Chen et al., 2006; Kühn et al., 2004; Kühn et al., 2006). Behavioural correlations were maintained. The final limitation of the current study is the failure to categorically disambiguate effort level from normalized force level. Multiple regression models incorporating power changes averaged across contacts for the whole range of contraction efforts/forces were less noisy for effort (R2 = 0.267) than for normalized force (R2 = 0.053). However, further studies will be necessary in the future to completely disambiguate effort from force coding, perhaps using fatigue to disengage the two phenomena.
The correlation between gamma synchronisation in the basal ganglia, as indexed by gamma band power LFP, and effort in strong contractions is consistent with other reports where very strong or very fast movements have been studied (Anzak et al., 2012; Brücke et al., 2012; Joundi et al., 2012), and with the general characterisation of such LFP activity as prokinetic (Brown, 2003). Its failure to predict lower effort levels is more unexpected and evidenced by the insignificant correlation with low effort levels when changes in beta activity were controlled for in the multiple linear regression model. Nevertheless, the lack of correlation at low effort levels might be in line with the view that gamma synchronisation centred around 70 Hz represents an attentional or arousal related process that impacts on motor performance (Jenkinson et al., 2013; Kempf et al., 2009). Low effort movements may not necessitate changes in attentional or arousal state. It should be noted that here we have focussed on the oscillatory gamma activity that is often associated with a discrete spectral peak centred around 70 Hz.
In contrast, there was a negative correlation between beta synchronisation, as indexed by beta band power in the STNr LFP, and effort during low effort contractions, although this relationship saturated at higher effort levels. Previous studies that have reported a relatively fixed depth of beta desynchronization regardless of force or movement speed may have possibly demanded higher effort levels (Anzak et al., 2012; Brücke et al., 2012; Joundi et al., 2012). Thus beta desynchronisation may not act in a binary fashion to gate movement (Brücke et al., 2012; Kempf et al., 2007 Kühn et al., 2004); rather it may potentially help code for performance at weaker effort levels but hit a floor effect at higher efforts.
Beta and gamma activities could therefore be considered complementary non-linear correlates of effort, that when combined as, for example as a difference between power levels, afford a measure that linearly correlates with effort across all levels. Interestingly, functional magnetic resonance imaging (fMRI) studies raise the possibility of a sigmoid rather than simple linear relationship between STN activation and force (Spraker et al., 2007), and blood oxygenation-level dependent fMRI signal seems to correlate with gamma activity, at least in cerebral cortex (Logothetis et al., 2001; Nir et al., 2007).
The absence of a systematic relationship between theta/alpha activity in the STNr LFP and effort is also interesting. This has been previously reported as correlating with force measures and reaction time during tasks performed under time pressure (Anzak et al., 2012). Likewise, others have highlighted that alpha activity increases in ballistic but not in non-ballistic arm movements (Singh et al., 2011). However, in the current study we did not request subjects to make grips as fast as possible, and perhaps because of this we were able to disambiguate reaction time phenomena from force measures, and the two did not correlate. Thus increases in theta/alpha power may be more important under circumstances of time pressure.
Activities at the high frequency range (100 Hz–375 Hz) were also observed and power at this frequency band increased at higher effort levels. Similar activities in the STN were previously reported either as a discrete peak centred around 300 Hz (Foffani et al., 2003; Lopez-Azcarate et al., 2010; Özkurt et al., 2011) or as a broad power increase that may reflect changes in neural spiking, by analogy with similar features in the cortex (Anzak et al., 2012; Litvak et al., 2012; Ray & Maunsell, 2011). High frequency activity from the contact pair with highest beta activity at rest, was an independent predictor for effort or force, but not when spectra were averaged across all contact pairs. This difference may relate to the focality of the high frequency activity, so that changes in this band were compromised by averaging across contact pairs. That said, the high frequency activities contribution was only detectable when regression models were simplified by substituting the difference between gamma and beta activities for changes in these bands considered separately. On the other hand, these behavioural correlations with high frequency activity are consistent with previous observations showing movement related amplitude modulation of high-frequency oscillations in the basal ganglia when the patients are ON dopaminergic medication (Lopez-Azcarate et al., 2010), and a positive correlation between this high frequency activity and force at the outset of the maximal grip (Anzak et al., 2012) and with slower force decrement during sustained maximal grip (Tan et al., 2013).
There is an emerging view that the basal ganglia motor cortical circuit, including its dopaminergic innervation, regulates response vigour or effort (Niv and Rivlin-Etzion, 2007; Salamone et al., 2009; Turner and Desmurget, 2010) and that Parkinsonian bradykinesia reflects an impairment in the link between motivation and movement vigour or effort (Mazzoni et al., 2007). The current results add to this in demonstrating a correlate of motor effort that can be recorded in the STNr and is valid across the full range of efforts. This correlate particularly consists of the combined suppression of beta activity and promotion of gamma activity, both forms of task-related reactivity that are deficient in untreated Parkinson's disease and which may be potentiated by treatment with the dopamine-pro drug levodopa (Androulidakis et al., 2007; Cassidy et al., 2002; Devos and Defebvre, 2006; Doyle et al., 2005).
Acknowledgments
This work was funded by the Medical Research Council and the National Institute of Health Research, Oxford Biomedical Research Centre.
Footnotes
This is an open-access article distributed under the terms of the Creative Commons Attribution-NonCommercial-No Derivative Works License, which permits non-commercial use, distribution, and reproduction in any medium, provided the original author and source are credited.
Supplementary data to this article can be found online at http://dx.doi.org/10.1016/j.expneurol.2013.06.010.
Appendix A. Supplementary data
Analysis of electrode contacts with highest beta band power.
RPE Scale.
References
- Androulidakis A.G., Doyle L.M., Yarrow K., Litvak V., Gilbertson T.P., Brown P. Anticipatory changes in beta synchrony in the human corticospinal system and associated improvements in task performance. Eur. J. Neurosci. 2007;25(12):3758–3765. doi: 10.1111/j.1460-9568.2007.05620.x. [DOI] [PubMed] [Google Scholar]
- Androulidakis A.G., Brucke C., Kempf F., Kupsch A., Aziz T., Ashkan K., Kuhn A.A., Brown P. Amplitude modulation of oscillatory activity in the subthalamic nucleus during movement. Eur. J. Neurosci. 2008;27(5):1277–1284. doi: 10.1111/j.1460-9568.2008.06085.x. [DOI] [PubMed] [Google Scholar]
- Anzak A., Tan H., Pogosyan A., Foltynie T., Limousin P., Zrinzo L., Hariz M., Ashkan K., Bogdanovic M., Green A.L., Aziz T., Brown P. Subthalamic nucleus activity optimizes maximal effort motor responses in Parkinson's disease. Brain. 2012;135:2766–2778. doi: 10.1093/brain/aws183. [DOI] [PMC free article] [PubMed] [Google Scholar]
- Borg G. Human Kinetics Publishers; 1998. Borg's Perceived Exertion and Pain Scales. [Google Scholar]
- Brown P. Oscillatory nature of human basal ganglia activity: relationship to the pathophysiology of Parkinson's disease. Mov. Disord. 2003;18(4):357–363. doi: 10.1002/mds.10358. [DOI] [PubMed] [Google Scholar]
- Brown P., Williams D. Basal ganglia local field potential activity: character and functional significance in the human. Clin. Neurophysiol. 2005;116(11):2510–2519. doi: 10.1016/j.clinph.2005.05.009. [DOI] [PubMed] [Google Scholar]
- Brücke C., Huebl J., Schonecker T., Neumann W.J., Yarrow K., Küpsch A., Blahak C., Lutjens G., Brown P., Krauss J.K., Schneider G.H., Kühn A.A. Scaling of movement is related to pallidal gamma oscillations in patients with dystonia. J. Neurosci. 2012;32(3):1008–1019. doi: 10.1523/JNEUROSCI.3860-11.2012. [DOI] [PMC free article] [PubMed] [Google Scholar]
- Cassidy M., Mazzone P., Oliviero A., Insola A., Tonali P., Di Lazzaro V., Brown P. Movement-related changes in synchronization in the human basal ganglia. Brain. 2002;125(Pt 6):1235–1246. doi: 10.1093/brain/awf135. [DOI] [PubMed] [Google Scholar]
- Chen C.C., Pogosyan A., Zrinzo L.U., Tisch S., Limousin P., Ashkan K., Yousry T., Hariz M.I., Brown P. Intra-operative recordings of local field potentials can help localise the subthalamic nucleus in Parkinson's disease surgery. Exp. Neurol. 2006;198:214–221. doi: 10.1016/j.expneurol.2005.11.019. [DOI] [PubMed] [Google Scholar]
- DeLong M.R., Alexander G.E., Georgopoulos A.P., Crutcher M.D., Mitchell S.J., Richardson R.T. Role of basal ganglia in limb movements. Hum. Neurobiol. 1984;2(4):235–244. [PubMed] [Google Scholar]
- Devos D., Defebvre L. Effect of deep brain stimulation and l-dopa on electrocortical rhythms related to movement in Parkinson's disease. Prog. Brain Res. 2006;159:331–349. doi: 10.1016/S0079-6123(06)59022-3. [DOI] [PubMed] [Google Scholar]
- Doyle L.M., Kuhn A.A., Hariz M., Kupsch A., Schneider G.H., Brown P. Levodopa-induced modulation of subthalamic beta oscillations during self-paced movements in patients with Parkinson's disease. Eur. J. Neurosci. 2005;21(5):1403–1412. doi: 10.1111/j.1460-9568.2005.03969.x. [DOI] [PubMed] [Google Scholar]
- Foffani G., Priori A., Egidi M., Rampini P., Tamma F., Caputo E. 300 Hz subthalamic oscillations in Parkinson's disease. Brain. 2003;126:2153–2163. doi: 10.1093/brain/awg229. [DOI] [PubMed] [Google Scholar]
- Foltynie T., Hariz M.I. Surgical management of Parkinson's disease. Expert. Rev. Neurother. 2010;10(6):903–914. doi: 10.1586/ern.10.68. [DOI] [PubMed] [Google Scholar]
- Hammond C., Bergman H., Brown P. Pathological synchronization in Parkinson's disease: networks, models and treatments. Tr. Neurosci. 2007;30:357–364. doi: 10.1016/j.tins.2007.05.004. [DOI] [PubMed] [Google Scholar]
- Jenkinson N., Kühn A.A., Brown P. Gamma oscillations in the human basal ganglia. Exp. Neurol. 2013;245:72–76. doi: 10.1016/j.expneurol.2012.07.005. [DOI] [PubMed] [Google Scholar]
- Joundi R.A., Brittain J.S., Green A.L., Aziz T.Z., Brown P., Jenkinson N. Oscillatory activity in the subthalamic nucleus during arm reaching in Parkinson's disease. Exp. Neurol. 2012;236(2):319–326. doi: 10.1016/j.expneurol.2012.05.013. [DOI] [PubMed] [Google Scholar]
- Kempf F., Kühn A.A., Kupsch A., Brücke C., Weise L., Schneider G.H., Brown P. Premovement activities in the subthalamic area of patients with Parkinson's disease and their dependence on task. Eur. J. Neurosci. 2007;25(10):3137–3145. doi: 10.1111/j.1460-9568.2007.05536.x. [DOI] [PubMed] [Google Scholar]
- Kempf F., Brücke C., Salih F., Trottenberg T., Kupsch A., Schneider G.H., Doyle Gaynor L.M.F., Hoffmann K.T., Vesper J., Wöhrle J., Altenmüller D.M., Krauss J.K., Mazzone P., Di Lazzaro V., Yelnik J., Kühn A.A., Brown P. Gamma activity and re-activity in human thalamic local field potentials. Eur. J. Neurosci. 2009;29l:943–953. doi: 10.1111/j.1460-9568.2009.06655.x. [DOI] [PubMed] [Google Scholar]
- Kühn A.A., Williams D., Kupsch A., Limousin P., Hariz M., Schneider G.H., Yarrow K., Brown P. Event-related beta desynchronization in human subthalamic nucleus correlates with motor performance. Brain. 2004;127(Pt 4):735–746. doi: 10.1093/brain/awh106. [DOI] [PubMed] [Google Scholar]
- Kühn A.A., Trottenberg T., Kivi A., Kupsch A., Schneider G.H., Brown P. The relationship between local field potential and neuronal discharge in the subthalamic nucleus of patients with Parkinson's disease. Exp. Neurol. 2005;194(1):212–220. doi: 10.1016/j.expneurol.2005.02.010. [DOI] [PubMed] [Google Scholar]
- Kühn A.A., Doyle L., Pogosyan A., Yarrow K., Kupsch A., Schneider G.H., Hariz M.I., Trottenberg T., Brown P. Modulation of beta oscillations in the subthalamic area during motor imagery in Parkinson's disease. Brain. 2006;129(Pt 3):695–706. doi: 10.1093/brain/awh715. [DOI] [PubMed] [Google Scholar]
- Levy R., Hutchison W.D., Lozano A.M., Dostrovsky J.O. Synchronized neuronal discharge in the basal ganglia of Parkinsonian patients is limited to oscillatory activity. J. Neurosci. 2002;22(7):2855–2861. doi: 10.1523/JNEUROSCI.22-07-02855.2002. [DOI] [PMC free article] [PubMed] [Google Scholar]
- Litvak V., Eusebio A., Jha A., Oostenveld R., Barnes G., Foltynie T., Limousin P., Zrinzo L., Hariz M., Friston K., Brown P. Movement-related changes in local and long-range synchronization in Parkinson's disease revealed by simultaneous magnetoencephalography and intracranial recordings. J. Neurosci. 2012;32:10541–10553. doi: 10.1523/JNEUROSCI.0767-12.2012. [DOI] [PMC free article] [PubMed] [Google Scholar]
- Logothetis N.K., Pauls J., Augath M., Trinath T., Oeltermann A. Neurophysiological investigation of the basis of the fMRI signal. Nature. 2001;412(6843):150–157. doi: 10.1038/35084005. [DOI] [PubMed] [Google Scholar]
- Lopez-Azcarate J., Tainta M., Rodriguez-Oroz M., Valencia M., Gonzalez R., Guirdi J. Coupling between beta and high-frequency activity in the human subthalamic nucleus may be a pathophysiological mechanism in Parkinson's disease. J. Neurosci. 2010;30:6667–6677. doi: 10.1523/JNEUROSCI.5459-09.2010. [DOI] [PMC free article] [PubMed] [Google Scholar]
- Mazzoni P., Hristova A., Krakauer J.W. Why don't we move faster? Parkinson's disease, movement vigor, and implicit motivation. J. Neurosci. 2007;27(27):7105–7116. doi: 10.1523/JNEUROSCI.0264-07.2007. [DOI] [PMC free article] [PubMed] [Google Scholar]
- Nir Y., Fisch L., Mukamel R., Gelbard-Sagiv H., Arieli A., Fried I., Malach R. Coupling between neuronal firing rate, gamma LFP, and BOLD fMRI is related to interneuronal correlations. Curr. Biol. 2007;17(15):1275–1285. doi: 10.1016/j.cub.2007.06.066. [DOI] [PubMed] [Google Scholar]
- Niv Y., Rivlin-Etzion M. Parkinson's disease: fighting the will? J. Neurosci. 2007;27(44):11777–11779. doi: 10.1523/JNEUROSCI.4010-07.2007. [DOI] [PMC free article] [PubMed] [Google Scholar]
- Özkurt T.E., Butz M., Homburger M., Elben S., Vesper J., Wotjeckl L. High frequency oscillations in the subthalamic nucleus: a neurophysiological marker of the motor state in Parkinson's disease. Exp. Neurol. 2011;229:324–331. doi: 10.1016/j.expneurol.2011.02.015. [DOI] [PubMed] [Google Scholar]
- Ray S., Maunsell J.H.R. Different origins of gamma rhythm and high-gamma activity in macaque visual cortex. PLoS Biol. 2011;9(4) doi: 10.1371/journal.pbio.1000610. [DOI] [PMC free article] [PubMed] [Google Scholar]
- Salamone J.D., Correa M., Farrar A.M., Nunes E.J., Pardo M. Dopamine, behavioral economics, and effort Front. Behav. Neurosci. 2009;3:13. doi: 10.3389/neuro.08.013.2009. [DOI] [PMC free article] [PubMed] [Google Scholar]
- Sancho-Bru J.L., Vergara M., Rodriguez-Cervantes P.J., Giurintano D.J., Perez-Gonzalez A. Scalability of the muscular action in a parametric 3D model of the index finger. Ann. Biomed. Eng. 2008;36(1):102–107. doi: 10.1007/s10439-007-9395-6. [DOI] [PubMed] [Google Scholar]
- Schmidt L., d'Arc B.F., Lafargue G., Galanaud D., Czernecki V., Grabli D., Schupbach M., Hartmann A., Levy R., Dubois B., Pessiglione M. Disconnecting force from money: effects of basal ganglia damage on incentive motivation. Brain. 2008;131(Pt 5):1303–1310. doi: 10.1093/brain/awn045. [DOI] [PubMed] [Google Scholar]
- Shadmehr R., Krakauer J.W. A computational neuroanatomy for motor control. Exp. Brain Res. 2008;185(3):359–381. doi: 10.1007/s00221-008-1280-5. [DOI] [PMC free article] [PubMed] [Google Scholar]
- Singh A., Levin J., Mehrkens J.H., Botzel K. Alpha frequency modulation in the human basal ganglia is dependent on motor task. Eur. J. Neurosci. 2011;33(5):960–967. doi: 10.1111/j.1460-9568.2010.07577.x. [DOI] [PubMed] [Google Scholar]
- Spraker M.B., Yu H., Corcos D.M., Vaillancourt D.E. Role of individual basal ganglia nuclei in force amplitude generation. J. Neurophysiol. 2007;98(2):821–834. doi: 10.1152/jn.00239.2007. [DOI] [PMC free article] [PubMed] [Google Scholar]
- Tan H., Pogosyan A., Anzak A., Foltynie T., Limousin P., Zrinzo L., Ashkan K., Bogdanovic M., Green A.L., Aziz T., Brown P. Frequency specific activity in subthalamic nucleus correlates with hand bradykinesia in Parkinson's disease. Exp. Neurol. 2013;240:122–129. doi: 10.1016/j.expneurol.2012.11.011. [DOI] [PMC free article] [PubMed] [Google Scholar]
- Turner R.S., Anderson M.E. Pallidal discharge related to the kinematics of reaching movements in two dimensions. J. Neurophysiol. 1997;77(3):1051–1074. doi: 10.1152/jn.1997.77.3.1051. [DOI] [PubMed] [Google Scholar]
- Turner R.S., Desmurget M. Basal ganglia contributions to motor control: a vigorous tutor. Curr. Opin. Neurobiol. 2010;20(6):704–716. doi: 10.1016/j.conb.2010.08.022. [DOI] [PMC free article] [PubMed] [Google Scholar]
- Vaillancourt D.E., Yu H., Mayka M.A., Corcos D.M. Role of the basal ganglia and frontal cortex in selecting and producing internally guided force pulses. NeuroImage. 2007;36(3):793–803. doi: 10.1016/j.neuroimage.2007.03.002. [DOI] [PMC free article] [PubMed] [Google Scholar]
- Weinberger M., Mahant N., Hutchison W.D., Lozano A.M., Moro E., Hodaie M., Lang A.E., Dostrovsky J.O. Beta oscillatory activity in the subthalamic nucleus and its relation to dopaminergic response in Parkinson's disease. J. Neurophysiol. 2006;96(6):3248–3256. doi: 10.1152/jn.00697.2006. [DOI] [PubMed] [Google Scholar]
- Williams D., Tijssen M., Van Bruggen G., Bosch A., Insola A., Di Lazzaro V., Mazzone P., Oliviero A., Quartarone A., Speelman H., Brown P. Dopamine-dependent changes in the functional connectivity between basal ganglia and cerebral cortex in humans. Brain. 2002;125(Pt 7):1558–1569. doi: 10.1093/brain/awf156. [DOI] [PubMed] [Google Scholar]
Associated Data
This section collects any data citations, data availability statements, or supplementary materials included in this article.
Supplementary Materials
Analysis of electrode contacts with highest beta band power.
RPE Scale.