

Abstract
Early in development, GABA, an inhibitory neurotransmitter in adults, is excitatory. NKCC1 (SLC12A2) encodes one of two cation chloride cotransporters mediating the conversion of GABA from excitatory to inhibitory. Using 3′ and 5′ RACE and PCR, we verified previously characterized alternative transcripts of NKCC1a (1–27) and NKCC1b (1–27(Δ21)), identified new NKCC1 transcripts, and explored their expression patterns during human prefrontal cortical development. A novel ultra-short transcript (1–2a) was expressed preferentially in the fetus. Expression of NKCC1b and 1–2a were decreased in schizophrenia compared with controls (NKCC1b: 0.8-fold decrease, p = 0.013; 1–2a: 0.8-fold decrease, p = 0.006). Furthermore, the expression of NKCC1b was associated with NKCC1 polymorphism rs3087889. The minor allele at rs3087889, associated with reduced NKCC1b expression (homozygous for major allele: N = 37; homozygous for minor allele: N = 15; 1.5-fold decrease; p < 0.01), was also associated with a modest increase in schizophrenia risk in a case-control sample (controls: N = 435; cases: N = 397, OR = 1.5). This same allele was then found associated with cognitive (n = 369) and fMRI (n = 313) intermediate phenotypes associated with schizophrenia—working memory (Cohen's d = 0.35), global cognition or g (d = 0.18), and prefrontal inefficiency (d = 0.36) as measured by BOLD fMRI during a working memory task. Together, these preclinical and clinical results suggest that variation in NKCC1 may increase risk for schizophrenia via alterations of mRNA expression at the molecular level and impairment of optimal prefrontal function at the macro or systems level.
Keywords: GABA, mRNA, neurotransmitter, NKCC1, schizophrenia, transcripts
Introduction
Schizophrenia is a complex psychiatric disorder with a lifetime prevalence of 1% (Sartorius et al., 1986). Abnormalities in GABA signaling are one of the most reproducible findings in postmortem schizophrenia studies (Akbarian et al., 1995; Lewis and Hashimoto, 2007; Charych et al., 2009; Hyde et al., 2011). NKCC1, a cation chloride cotransporter, plays an important role in brain development and the electrophysiological effects of GABA (Kaila, 1994; Owens and Kriegstein, 2002; Yamada et al., 2004; Blaesse et al., 2009).
Early in brain development, GABA, the main inhibitory neurotransmitter of adult brain, is depolarizing (Ben-Ari, 2002; Lee et al., 2005). The developmental stages when GABA elicits excitation involve cellular proliferation and migration, followed by dendritic and axonal outgrowth, synapse formation, and circuit refinement (Hanse et al., 1997; Leinekugel et al., 1997; Ben-Ari, 2002; Owens and Kriegstein, 2002). The GABA “switch,” converting from excitation to inhibition, is mediated by the relative expression of Na+-K+-2Cl− cotransporter NKCC1 (SLC12A2) and K+-Cl− cotransporter KCC2 (SLC12A5) (Owens and Kriegstein, 2002). The decreasing NKCC1/KCC2 ratio parallels the change of GABA from an excitatory to inhibitory neurotransmitter (Owens and Kriegstein, 2002; Blaesse et al., 2009). Consistent with its role in excitation, NKCC1 inhibition by bumetanide causes a hyperpolarizing shift of the GABA reversal potential in rat neocortical (Yamada et al., 2004) and hippocampal neurons (Dzhala et al., 2005; Sipilä et al., 2005). Kim et al. (2012) recently showed that NKCC1 and DISC1 interact to regulate dendritic development during hippocampal neurogenesis.
In DLPFC, postmortem schizophrenia studies have consistently revealed alterations in GABA signaling (Lewis et al., 2005), including decreased GAD67 mRNA (Volk et al., 2000; Straub et al., 2007; Hashimoto et al., 2008). We previously identified abnormalities in KCC2, GAD25, and GAD67 in hippocampus: GAD25/GAD67 and NKCC1/KCC2 ratios were increased in schizophrenia, reflecting a potentially immature GABA physiology (Hyde et al., 2011). There were no changes in the full-length isoform of NKCC1 in either DLPFC (Arion and Lewis, 2011; Hyde et al., 2011) or hippocampus (Hyde et al., 2011). Arion and Lewis (2011) found increased levels of OXSR1, which regulates NKCC1 phosphorylation, identifying yet another alteration in inhibitory physiology in schizophrenia.
NKCC1 not only helps mediate the postsynaptic effects of GABA but also is important in circuit formation in developing brain. To explore its ontogenetic role, specifically related to developmental neuropsychiatric disorders, we defined the complete transcriptome of NKCC1. Two NKCC1 splice variants previously have been identified in human brain, NKCC1a (1–27) and NKCC1b (1–27 (Δ21) (missing exon 21) (Gamba et al., 1993; Gillen et al., 1996; Payne et al., 1996; Hiki et al., 1999; Mount et al., 1999). Both form functional cotransporters (Randall et al., 1997; Vibat et al., 2001). Alternative splicing is known to affect more than half of all genes and is a primary factor in the evolution of phenotypic complexity (Lander et al., 2001; Johnson et al., 2003). Here we have identified an association of expression of novel NKCC1 splice variants and schizophrenia, and of NKCC1 SNPs and risk for illness.
Materials and Methods
Human postmortem tissue.
Postmortem adult brains were collected at the Clinical Brain Disorders Branch (CBDB), National Institute of Mental Health (NIMH) with informed consent from the legal next of kin under NIMH protocol 90-M-0142 and processed as previously described (Lipska et al., 2006). In the DLPFC (Brodmann areas 9 and 46), gray matter tissue from the middle frontal gyrus was obtained from a coronal slab corresponding to the middle one-third immediately anterior to the genu of the corpus callosum. Psychiatric diagnoses were determined by independent reviews of clinical records and family interviews by two psychiatrists using Diagnostic and Statistical Manual of Mental Disorders, Fourth Edition (DSM-IVR) criteria, in 45 patients with schizophrenia (48.9 ± 15.5 years of age; 27 males, 18 females) and 48 healthy controls (46.9 ± 15.2 years of age; 30 males, 18 females). Toxicological analysis was conducted on every subject. Normal control subjects had no known history of psychiatric symptoms or substance abuse, and negative toxicological results. Positive toxicology was not an exclusion criterion for cases with schizophrenia. Total daily, lifetime, and last dose of neuroleptic medication was calculated for each case with schizophrenia and converted to chlorpromazine equivalents.
An additional cohort of 91 nonpsychiatric controls (“a developmental series”), spanning ages from gestational weeks 14 through 20 in the fetus and from birth up to 78 years of age, was used to measure expression of NKCC1 transcripts in the prefrontal cortex across the human life span (see Table 3). Postmortem fetal brain tissue samples were provided by the Brain and Tissue Bank for Developmental Disorders of the National Institute of Child Health and Human Development under contracts NO1-HD-4–3368 and NO1-HD-4–3383 (protocol approved by the Institutional Review Board of the University of Maryland at Baltimore), and the tissue was donated to the NIMH under the terms of a Material Transfer Agreement. The samples in this series had no known history of psychiatric symptoms or substance abuse, and negative toxicological results.
Table 3.
To investigate the developmental expression profile of the novel transcripts, we used samples from the prefrontal cortex of nonpsychiatric controls encompassing almost the entire human lifespan, from the fetal 14th through 20th gestational weeks and from birth through old age (78 years)a
| Name | Sequence |
|---|---|
| NKCC1a (1-27) forward primer | 5′-ACCAAGGATGTGGTAGTAAGTGTGG-3′ |
| NKCC1a (1-27) reverse primer | 5′-GGATTCTTTTTTCAACAGTGGTTGA-3′ |
| NKCC1a (1-27) probe | 6FAMTACACACAAAGTTGAGGAAGMGBNFQ |
| NKCC1b (1-27 (Δ21)) forward primer | 5′-AGGATGTGGTAGTAAGTGTGGAATATAGTAA-3′ |
| NKCC1b (1-27 (Δ21)) reverse primer | 5′-TCAAGAAGCTTTTGGTCAGCTACAT-3′ |
| NKCC1b (1-27 (Δ21)) probe | 6FAMTACACACAAAGAATCCAMGBNFQ |
| NKCC1 1-27 (21a) forward primer | 5′-GAATATAGTAAAAAGTCCGATTTAGATACTTCC-3′ |
| NKCC1 1-27 (21a) reverse primer | 5′-CCTTCTCATAAAATTCATGTATGTTGACA-3′ |
| NKCC1 1-27 (21a) probe | 6FAMTTACACACAAAGTCGTGCTGMGBNFQ |
| NKCC1 1-4a forward primer | 5′-TGACAACTATCACAGGATTGTCTACTTC-3′ |
| NKCC1 1-4a reverse primer | 5′-ATTCTTTTCTTCTTGTTTTCAGGGATC-3′ |
| NKCC1 1-4a probe | 6FAMAGAGGAGGAAGAGGACMGBNFQ |
| NKCC1 1-2a forward primer | 5′-CTGTGGTCACGTATACTGCAGAAAGTA-3′ |
| NKCC1 1-2a reverse primer | 5′-AACTGATGAGAACGTTAGGAAGATTTTATA-3′ |
| NKCC1 1-2a probe | 6FAMCAAGGGTGTATTAGTATGTATATMGBNFQ |
aWe assessed mRNA expression levels of novel NKCC1 transcripts [isoforms 1–27 (21a), 1–4a, and 1–2a] as well as the known transcripts NKCC1a (1–27) and NKCC1b (1–27 (Δ21)) in the DLPFC by qRT-PCR (Table 3). We measured the expression of NKCC1a (1–27), using an assay spanning exon 20 and exon 21, expression of NKCC1b (1–27 (Δ21)), using an assay spanning exon 20 and exon 22, expression of 1–4a, using an assay spanning exon 4 and a unique exon 4a, and expression of NKCC1b 1–2a, using an assay spanning exon 2 and a unique exon 2a. We did not measure the isoform 1–27 (Δ5–26) by qPCR because of low abundance (Ct > 36) of mRNA expression in our preliminary study (data not shown). All data were normalized to a geometric mean of three “housekeeping genes.”
RNA extraction and reverse transcription of brain samples.
Tissue was pulverized and stored at −80°C. RNA extraction and reverse transcription reaction were performed as described previously (Lipska et al., 2006). Briefly, total RNA was extracted from 300 mg of tissue using TRIZOL Reagent (Invitrogen). The yield of total RNA was determined by absorbance at 260 nm. RNA quality was assessed with high-resolution capillary electrophoresis (Agilent Technologies). Total RNA (4 μg) was used in 50 μl of reverse transcriptase reaction to synthesize cDNA, using a SuperScript First-Strand Synthesis System for RT-PCR (Invitrogen) according to the manufacturer's protocol. The same normalization procedures were used throughout on all postmortem samples.
5′ RACE and 3′ RACE of NKCC1 splice variants.
5′ RACE and 3′ RACE were performed using the SMART RACE cDNA Amplification Kit (Clontech). We used human adult brain reference RNA (Ambion) and human 20- to 33-week fetal brain poly A+ RNA (Clontech), and these RNAs were reverse-transcribed to cDNA by MMLV reverse transcriptase (Clontech). Enzyme and buffer for RACE PCRs were used from the Advantage-GC 2 PCR Kit (Clontech). Antisense primers for 5′ RACE and sense primers for 3′ RACE, which we designed, are shown in Table 1. When necessary, nested PCR was performed using a designed nested NKCC1 gene-specific primer and a nested universal primer A. The PCR amplification profile was 94°C for 3 min, 35 cycles of 94°C for 30 s, 64°C-68°C for 30 s, and 68°C for 2–5 min, and 68°C for 10 min in the last cycle. All RACE products were cloned into pCR 4-TOPO vectors (Invitrogen) and bidirectionally sequenced.
Table 1.
5′ RACE and 3′ RACE was performed using SMART RACE cDNA Amplification Kit (Clontech)a
| Name | Sequence |
|---|---|
| NKCC1 Ex2 (3′RACE) F1 primer | 5′-TGAGGATGGCTTTGCAAATGGGGAAG-3′ |
| NKCC1 Ex2 (3′RACE) F2 primer | 5′-CTCCAACCAGAGATGCTGTGGTCACG-3′ |
| NKCC1 Ex6, 7 (3′RACE) F1 primer | 5′-GCTGGAATGGAGTGGGAAGCAAAAGC-3′ |
| NKCC1 Ex6, 7 (3′RACE) F2 primer | 5′-CCCACTGGAGAGCAAGAAGCCAAAAGG-3′ |
| NKCC1 Ex14, 15 (3′RACE) F1 primer | 5′-TCGTCATTAACTGGTGGGCTGCATTGCT-3′ |
| NKCC1 Ex14, 15 (3′RACE) F2 primer | 5′-TTGGGGATCCTCTACACAAGCCCTGA-3′ |
| NKCC1 Ex2 (5′RACE) R1 primer | 5′-CACCCTTGATCCAGCCAAACTTCACGA-3′ |
| NKCC1 Ex2 (5′RACE) R2 primer | 5′-CTTCCCCATTTGCAAAGCCATCCTCA-3′ |
| NKCC1 Ex6, 7 (5′RACE) R1 primer | 5′-CCCTTTTGGCTTCTTGCTCTCCAGTG-3′ |
| NKCC1 Ex6, 7 (5′RACE) R2 primer | 5′-CTGAGCTTTTGCTTCCCACTCCATTCCA-3′ |
| NKCC1 Ex13, 14 (5′RACE) R1 primer | 5′-GCAATGCAGCCCACCAGTTAATGACGA-3′ |
| NKCC1 Ex13, 14 (5′RACE) R2 primer | 5′-GGACGCCATCCTGGAGATTTTGCAAGTG-3′ |
aWe used human adult brain reference RNA (Ambion) and human 20- to 33-week fetal brain poly A+ RNA (Clontech), and these RNAs were reverse-transcribed to cDNA by MMLV reverse transcriptase (Clontech). Enzyme and buffer for RACE PCR reactions were used from Advantage-GC 2 PCR Kit (Clontech). Antisense primers for 5′ RACE and sense primers for 3′ RACE, which we designed, are shown in Table 1.
Analysis of full-length NKCC1 splice variants by long-range RT-PCR.
Total RNA was extracted from postmortem DLPFC tissues of eight adult normal controls (from CBDB/NIMH Brain Collection) and was used to synthesize cDNA as described previously (Lipska et al., 2006). In humans, at least two different NKCC1 transcripts (NM_001046 and NM_001046.2) have been reported in the NCBI RefSeq database. PCR primers used for this study were designed on the basis of these existing NKCC1 transcripts' sequences (see Table 2). Portions of the NKCC1 gene were amplified with each combination of primers using Platinum TaqDNA polymerase (Invitrogen). The PCR conditions were 94°C for 5 min, 35 cycles of 94°C for 30 s, 58°C-62°C for 30 s, 3 min, 72°C for 30 s, and 72°C for 7 min. The sequences of amplified products were analyzed by direct sequencing to evaluate the presence of novel transcripts. The exon structure of each product was determined by aligning the amplified sequence to the human chromosome genomic sequence of the human NKCC1 gene (NT_034772.6). Subsequently, the same analysis was conducted using postmortem human DLPFC tissues of eight adult normal controls and frontal cortical tissues of eight fetal prefrontal cortical samples from the CBDB/NIMH Brain Collection (Tan et al., 2008).
Table 2.
Total RNA was extracted from postmortem DLPFC tissues of eight adult normal controls (from CBDB/NIMH Brain Collection) and was used to synthesize cDNA as described previously (Lipska et al., 2006)a
| Name | Sequence |
|---|---|
| NKCC1 Ex1 forward primer | 5′-GGTCGGGCAGCTATGGAGCCGCGG-3′ |
| NKCC1 Ex27 reverse primer | 5′-TGGAGCAACTTTCCTGTGTGCTTTCA-3′ |
| NKCC1 Ex1 forward primer | 5′-GGTCGGGCAGCTATGGAGCCGCGG-3′ |
| NKCC1 Int4 reverse primer | 5′-GGGTCACAGTGATTTGGATCCTCTGG-3′ |
| NKCC1 Ex1 forward primer | 5′-GGTCGGGCAGCTATGGAGCCGCGG-3′ |
| NKCC1 Int2 reverse primer | 5′-TCCCTGCTCAGCCTTCTTGATTCTGA-3′ |
aIn humans, at least two different NKCC1 transcripts (NM_001046 and NM_001046.2) have been reported in the NCBI RefSeq database. PCR primers used for this study were designed on the basis of these existing NKCC1 transcripts' sequences (Table 2). Portions of the NKCC1 gene were amplified with each combination of primers using Platinum Taq DNA polymerase (Invitrogen). The PCR conditions were 94°C for 5 min, 35 cycles of 94°C for 30 s, 58°C-62°C for 30 s, 3 min, 72°C for 30 s, and 72°C for 7 min. The sequences of amplified products were analyzed by direct sequencing to evaluate the presence of novel transcripts. The exon structure of each product was determined by aligning the amplified sequence to the human chromosome 5 genomic contig sequence of the human NKCC1 gene (NT_034772.6). Subsequently, the same analysis was conducted using postmortem human DLPFC tissues of eight adult normal controls and frontal cortical tissues of eight fetal prefrontal cortical samples from CBDB/NIMH Brain Collection (Tan et al., 2008). Based on the sequence information of 5′- and 3′-ends obtained from RACE, we designed primers for amplification of full-length transcripts (Table 2).
Based on the sequence information of 5′- and 3′-ends obtained from RACE, we designed primers for amplification of full-length transcripts (see Table 2) and performed end-to-end PCR using cDNAs generated from commercial human fetal and adult brain poly A+ RNAs (Clontech). When necessary, nested PCR was performed using a set of nested primers. NKCC1 gene-specific PCR products were cloned into pCR 4-TOPO vectors (Invitrogen) and sequenced.
Sequencing.
Samples were sequenced using Big Dye Terminator 3.1 (Applied Biosystems) according to the manufacturer's specifications by diluting the reagent 4–8-fold. The reactions were performed on an ABI 9700 thermal cycler using the BDT cycling protocol. An SDS wash was performed adding 1% SDS and denaturing the samples for 5 min at 95°C. The reactions were then purified over Sephadex G-50 superfine columns (Sigma-Aldrich) and either lyophilized and resuspended in Hi-Dye formamide or loaded in water after adding one-tenth volume of 100 mm EDTA, pH 8.0. The reaction products were analyzed on an Applied Biosystems 3130.
Transfection of cultured HEK 293 cells with plasmid NKCC1 cDNA variants.
Human embryonic kidney cells (HEK 293) were cultured in DMEM (Invitrogen) with 10% fetal bovine serum and 1% penicillin-streptomycin in a humidified 5% CO2 incubator at 37°C. Cells were seeded into 6-well plates at 6 × 10⁵ cells/well 24 h before transfection. NKCC1 cDNA variants were subcloned into the mammalian expression vector pCMV-SC-NM containing an N-terminal Myc tag (Stratagene) to generate c-myc fusion constructs. To confirm proper orientation of the insert, restriction digests and sequencing reactions were performed. NKCC1 clones (4 μg, 6-well) were transfected using Lipofectamine 2000 (Invitrogen) according to the manufacturer's instructions. The following variants were used for transfection: 1–27 (exon 1–27), 1–4a, and 1–2a (see Figure 3). Cells were harvested 36 h after transfection and lysed in a buffer (20 mm Tris, pH 7.4, 150 mm NaCl, 10% glycerol, 1 mm sodium orthovanadate, 1 mm EDTA, 1× protease inhibitor cocktail; Sigma). After pulse sonification, homogenates were incubated on ice for 15 min and centrifuged at 5000 × g for 5 min at 4°C. Supernatants were collected and protein concentrations were assayed by the Bradford method (Bio-Rad).
Figure 3.
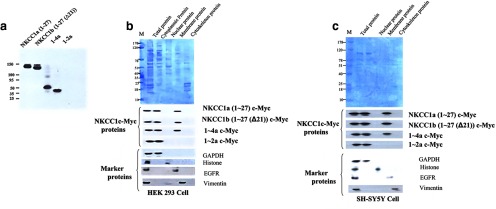
Detection of proteins by Western blotting using anti-Myc antibodies. Protein extracts were obtained from HEK293 cells transfected with NKCC1 variants. a, NKCC1a (exon 1–27), NKCC1b (exon 1–27(Δ21)), 1–4a (exon 1–4a), and 1–2a (exon 1–2a). b, Purification of NKCC1 proteins using a protein extraction kit. We transfected HEK293 cells with Myc-fusion construct containing the following NKCC1 variants: NKCC1a (exon 1–27), NKCC1b (exon 1–27, Δ21), 1–4a, and 1–2a. Then, we separated these proteins into five aliquots: total, cytoplasmic, nuclear, membrane, and cytoskeletal protein. We detected proteins from NKCC1a (exon 1–27), NKCC1b (exon 1–27, Δ21), and 1–4a isoforms in cytoplasmic and membrane fractions. However, the 1–2a protein was found only in the cytoplasmic fraction. c, We confirmed these results using different cells, human SH-SY5Y neuroblastoma cells.
Western blot analysis.
Immunoblotting was performed using 20 μg of protein/sample in 4× LDS sample buffer (Invitrogen) containing β-mercaptoethanol. Samples were boiled for 2 min and resolved on NuPage 4–12% Bis-Tris gels (Invitrogen). Gels were transferred to nitrocellulose membranes (Invitrogen) and then blocked in TBS containing 0.05% Tween 20 and 5% nonfat, dry milk (TBSTM) for 1 h. For detection of c-myc fusion proteins, an anti-myc antibody conjugated to HRP (Invitrogen) was diluted in TBSTM at a 1: 5000 concentration and incubated overnight at 4°C with gentle agitation. Blots were washed for 3 times in TBST for 10 min and developed using chemiluminescence (SuperSignal West Femto, Pierce Biotechnology).
NKCC1 protein analysis.
Protein extraction was performed using a commercial extraction kit (Millipore). NKCC1 cDNA variants were subcloned into the mammalian expression vector pCMV-SC-NM containing an N-terminal Myc tag (Stratagene) to generate c-myc fusion constructs. The human SH-SY5Y neuroblastoma cells and the HEK293 cells were cultured in DMEM (Invitrogen) with 10% FBS and 1% penicillin-streptomycin in a humidified 5% CO2 incubator at 37°C. Cells were seeded into 6-well plates at 6 × 10⁵ cells/well 24 h before transfection. NKCC1 clones (4 μg, 6-well) were transfected using Lipofectamine 2000 (Invitrogen) according to the manufacturer's instructions. The following variants were used for transfection: 1–27 (exon 1–27), 1–4a, and 1–2a. Cells were harvested 36 h after transfection and lysed in cell lysis buffer C (Millipole). Thereafter, the protein extraction experiments were performed under the manufacturer's instructions. Then, immunoblotting was performed using 20 μg of protein/sample in 4× LDS sample buffer (Invitrogen) containing β-mercaptoethanol.
Expression analysis by qRT-PCR.
mRNA expression levels of newly identified NKCC1 transcripts were quantified in homogenates of postmortem DLPFC tissue of 46 control subjects and 45 subjects with schizophrenia and in 91 normal controls across the lifespan by quantitative real-time PCR (qPCR), using an ABI Prism 7900 sequence detection system with 384-well format (Applied Biosystems). Custom-made primers/probes were designed using Primer Express software (Applied Biosystems) to amplify specific transcripts based on the unique exon structure of each transcript (see Table 3). Each 10 μl reaction contained 900 nm of each primer, 250 nm of probe, and TaqMan Universal PCR Mastermix (Applied Biosystems) containing Hot Goldstar DNA Polymerase, dNTPs with dUTP, uracil-N-glycosylase, passive reference, and 100 ng of cDNA template. PCR cycle parameters were 50°C for 2 min, 95°C for 10 min, 40 cycles of 95°C for 15 s, and 60°C for 1 min. PCR data were acquired from the Sequence Detector Software (SDS version 2.0, Applied Biosystems) and quantified by a standard curve method with serial dilutions of pooled cDNA derived from RNA obtained from DLPFC of 12 normal control subjects. In each experiment, the R2 value of the curve was >0.99, and controls comprising no-template cDNA resulted in no detectable signal. All samples were measured in a single plate for each transcript, and their cycles at threshold (Ct) values were in the linear range of the standard curve. All measurements were performed in triplicates, and the gene expression level was calculated as an average of the triplicates. Data were normalized to a geometric mean of three housekeeping genes: β-actin (ACTB), β2-microglobulin (B2M), and β-glucuronidase (GUSB). Commercial and custom designed TaqMan assays used in the study are shown in Table 3. We eliminated outliers (points > ±2 SD from the mean, n = 0–4 per experiment) for each expression variable.
DNA collection and NKCC1 genotype determination.
DNA was extracted from cerebellar brain tissue of subjects used for the quantitative real-time PCR using a standard protocol supplied by Puregene (Gentra Systems). We genotyped 10 SNPs (rs10067555 (N = 833), rs53805604 (N = 822), rs10067555 (N = 837), rs2568928 (N = 834), rs380561 (N = 845), rs12189448 (N = 814), rs13175996 (N = 837), rs3805616 (N = 837), rs10089 (N = 836), and rs3087889 (N = 832)) located within or around the NKCC1 gene. We used TAGGER (http://www.broadinstitute.org/tagger-0) to identify eight tag SNPs used for individual analyses (see Fig. 7) and for a 4-marker haplotype spanning the 3′ region. Genotyping was performed using the TaqMan 5′ exonuclease allelic discrimination assay. Genotype reproducibility was routinely assessed by regenotyping all samples for selected SNPs and was generally >99%. The subjects with missing genotypes were not included in the genotypic analysis because an unequivocal assignment of genotype for some DNA samples was not possible.
Figure 7.

Expression of NKCC1 transcripts in the DLPFC of patients with schizophrenia and normal controls. We examined the association of 10 NKCC1 SNPs with the mRNA expression levels of NKCC1 splice variants. All data were covaried by age at death, pH, RIN, and sex. The mRNA expression of NKCC1a (1–27) and NKCC1b (1–27 (Δ21)) was significantly associated with rs12189448: carriers of the minor (C) allele (NKCC1a: N = 82; NKCC1b: N = 81) had significantly lower expression of both transcripts compared with individuals homozygous for the major (A) allele (NKCC1a: N = 12; NKCC1b: N = 12) (*). Furthermore, rs3087889 was significantly associated with the expression of NKCC1b (1–27 (Δ21)) in a dose-dependent fashion. In particular, individuals homozygous for the minor allele (A) at rs3087889 (N = 15) had significantly lower expression than those homozygous for the major allele (T) (N = 37) (p < 0.01) (**). Genotype and allele frequencies by race for rs3087889 are seen in 6.
For all postmortem data, statistical analyses were conducted using Statistica version 7.1 (StatSoft). We assessed the association in the combined sample of cases and controls while adjusting for study and sample genotyping cohorts. Comparisons between groups were made using ANCOVA for each mRNA with diagnosis, genotype, and race as independent variables and sex, pH, postmortem interval (PMI), age, and RNA quality as covariates. Variance estimates were calculated as follows: For dichotomous traits, Nagelkerke's pseudo R2 was compared between a model with only covariates (sex and age) and a model including covariates (reduced model) and the allelic coding of SNP (full model). For continuous traits, the difference in adjusted R2 between the reduced model and the full model was used. For expression data, covariates include age at death, pH, RNA integrity number (RIN), and sex.
Clinical association cohorts.
Clinical and genetic data were obtained from subjects evaluated in the Clinical Brain Disorders Branch Sibling Study, which has been described previously (Egan et al., 2001). All research subjects gave written informed consent under a protocol approved by the human subjects research committees of the appropriate institution and by the Combined Neuroscience Institutional Review Board of the National Institutes of Health Intramural Research Program (Egan et al., 2000). Subjects were all of European ancestry to minimize genetic heterogeneity and stratification artifacts. All subjects were from 18 to 60 years of age and had an IQ > 70. Exclusion criteria were significant medical problems, history of loss of consciousness for >5 min, alcohol or drug abuse/dependence within the last 12 months, and electroconvulsive therapy within the last 6 months. All subjects were medically screened and completed separate diagnostic interviews with two research psychiatrists using the structured interview for DSM-IV. For probands, data from psychiatric records were also evaluated during diagnostic ascertainment. Individuals were included in the schizophrenia group if they had schizophrenia, schizoaffective disorder, psychosis not otherwise specified, or schizoid personality disorder. Controls were excluded if they had first-degree relatives with schizophrenia spectrum disorders, if they were currently diagnosed with an Axis 1 or Axis II disorder, or if they were taking psychotropic medication at the time of the study. Schizophrenia participants were stable and receiving neuroleptic medication at the time of testing (Dickinson et al., 2011). For genetic association studies in families, we examined a total of 481 pedigrees (N = 128 nuclear families for SNP rs3087889): one father, one mother, and one offspring from each. We also examined for genetic association in a largely overlapping sample of 397 schizophrenic probands and 435 unrelated healthy controls (see Table 5). In genotype studies, we analyzed SNP association within families by family-based association testing (Horvath et al., 2001) and by logistic regression in unrelated cases and controls, assuming an additive genetic model, using a biallelic test.
Table 5.
Cognitive factor associations with NKCC1 rs3087889a
| Healthy controls | SCZ | Family | |
|---|---|---|---|
| Verbal memory | 0.901 (N = 409) | 0.519 (N = 302) | 0.041 (N = 91) |
| N-back | 0.006* (N = 369) | 0.674 (N = 181) | 0.061 (N = 60) |
| Visual memory | 0.366 (N = 271) | 0.827 (N = 298) | 0.004* (N = 91) |
| Processing speed | 0.119 (N = 408) | 0.671 (N = 302) | 0.018 (N = 90) |
| Card sorting | 0.155 (N = 399) | 0.507 (N = 295) | 0.028 (N = 89) |
| Digit span | 0.350 (N = 288) | 0.838 (N = 301) | 0.035 (N = 91) |
| g | 0.030 (N = 391) | 0.548 (N = 299) | 0.678 (N = 89) |
aNKCC1 rs3087889 A allele was associated with working memory (N = 369) and g (N = 391) in healthy subjects. Although not associated with cognitive measures in schizophrenic subjects per se, family-based association showed that this SNP associated with between-sibling differences in most factors to some extent.
*p values survive minimal correction for number of factor scores tabulated (n = 7, p < 0.007); however, they would not survive a more rigorous correction for number of scores and grouping variables (n = 21, p < 0.002).
fMRI data and analyses.
Subjects were recruited from the CBDB Sibling Study. From healthy subjects with high-quality fMRI data and NKCC1 rs3087889 genotype, there was a sample of 313 healthy volunteers of European descent. All subjects gave written informed consent under a protocol approved by the Combined Neuroscience Institutional Review Board of the National Institutes of Health. Participants performed the well-described N-back working memory task (Callicott et al., 1999, 2000). Participants first practiced the task outside the scanner until performance was constant. We used padding to minimize in-scanner head movement inside the gradient inert coil and visual inspection (i.e., cine loop to detect uncorrected movement), automated measures (e.g., improvements in SNR after motion correction), and modifications to data analysis (i.e., six parameters for movement as covariates of no interest for first level individual fMRI maps). In addition, we required minimal working memory performance accuracy of perfect performance on the control 0-back and better than chance at 2-back (> 25% accuracy), standards easily met by our healthy control subjects, with little performance variation across genotypes and no subjects excluded for performance. Additional exclusion criteria included history of psychosis, head trauma, significant medical condition, or current psychiatric medications. Significant differences in demographic and performance metrics were assessed using a repeated-measures ANOVA followed by Tukey's Honest Significant Difference post hoc, but none was found for age, sex, WAIS-IQ, N-back reaction time, or N-back performance (p > 0.05) (see Table 4).
Table 4.
NKCC1 genotype demographics from subjects recruited from the CBDB Sibling Studya
| T/T | A carriers | |
|---|---|---|
| Total | 134 | 91 |
| Age (years) | 31 ± 9 | 32 ± 10 |
| Gender | 57 M; 77 F | 43 M; 48 F |
| WAIS-IQ | 107.4 ± 9.8 | 108.5 ± 8.5 |
| Education (years) | 16.9 ± 2.5 | 17.1 ± 2.8 |
| 2-back accuracy (%) | 82.3 ± 15.6 | 81.0 ± 17.6 |
| 2-back reaction time (s) | 0.50 ± 0.23 | 0.52 ± 0.23 |
aFrom available healthy subjects with QC + fMRI data and NKCC1 rs3087889 genotypes (specific to the Δ21 transcript), there was a sample of 313 white healthy volunteers. Exclusion criteria included history of psychosis, head trauma, significant medical condition, or current psychiatric medications. The genotype groups were matched for age, gender, WAIS-IQ, N-back reaction time, and N-back performance (p > 0.05).
Whole-brain BOLD fMRI data were collected on a 3 Tesla GE scanner (24 interleaved slices, TE = 20, TR = 2, flip angle = 90°, FOV = 24, voxel size = 3.75 × 3.75 × 3.75, matrix = 64 × 64) using gradient echo-planar imaging. We used SPM5 for all analyses (http://www.fil.ion.ucl.ac.uk/spm), specifically a second-level, random effect multiple regression that included our main effect of SNP while controlling for confounding by age, sex, and working memory performance. We chose a minimal statistical threshold of p < 0.005, cluster size (k) > 5 (whole brain uncorrected), followed by small volume correction (SVC FWE: p < 0.05) for the prefrontal cortex based upon our prior expectation of prefrontal efficiency effects by NKCC1. To display our results, we used a less stringent threshold (p < 0.01, k > 5) and graphed extracted parameter estimates (displayed as arbitrary units (au.)) from prefrontal cortex using SPSS (see Fig. 8).
Figure 8.

NKCC1 rs3087889 predicts prefrontal inefficiency in healthy controls during a working memory task. Healthy individuals carrying the minor allele (A) of NKCC1 rs3087889 that was associated with mRNA expression and risk for schizophrenia showed greater left DLPFC activation during the N-back working memory task assayed by BOLD fMRI. We compared 186 NKCC1 T/T subjects against 127 NKCC1 A carriers who otherwise did not differ in age, gender, WAIS-IQ, N-back reaction time, and N-back performance (p > 0.05). We corrected BOLD fMRI results for a small volume and familywise error (SVC, FWE): p < 0.05 given our prior hypothesis of activation differences in the prefrontal cortex (efficiency) and location of postmortem assays. For illustrative purposes, we display results here at p < 0.01 and in arbitrary units (au).
Neuropsychological data.
Healthy controls completed a battery of neuropsychological tests in the course of participation in the CBDB/NIMH Study of Schizophrenia Genetics, which has been described previously (Egan et al., 2001). A total of 25 variables from a larger neuropsychological battery set were examined, as explained previously (Dickinson et al., 2011, their Table 1). Subgroup data were subjected to principal components analyses and six factors emerged from exploratory factor analyses. For each individual with sufficient data, composite scores representing domains of verbal memory, N-back working memory, visual memory, processing speed, card sorting, and span performance were constructed, as was a global composite (“g”) representing general cognitive performance (Dickinson et al., 2011). We analyzed SNP associations in controls assuming an additive genetic model, using a biallelic test with age and sex as covariates of no interest.
Results
5′ RACE and 3′ RACE of NKCC1 splice variants
Multiple 5′ RACE and 3′ RACE reactions were performed using pooled fetal and pooled adult human brain RNA (Ambion and Clontech) with NKCC1 gene-specific antisense and sense primers located in exons 2, 6, 10, and 14 (Table 1). Sequencing of the 5′ RACE products revealed that all transcripts began with the same 5′ exon 1 from the full-length transcript for NKCC1 (Fig. 1). Characterization of the 3′ RACE products revealed the presence of 10 alternative termination exons, two of which (exon 4a and exon 2a) have not been previously reported as final exons (Fig. 1).
Figure 1.

Schematic representation of 5′- and 3′-end structures of the human NKCC1 gene identified by RACE. The genomic organization of the human NKCC1 gene (full-length isoform NKCC1a) is shown at the top of the figure, along with horizontal arrows indicating transcriptional orientation. The continuous line indicates genomic sequence, on which known exons of NKCC1 are shown as rectangles and numbered. The newly identified exons 2a and 4a are shown as small rectangles. The exons contained within the 5′ and 3′ RACE products are indicated as boxes linked by a solid line. The one alternative first exon and the 10 alternative termination exons (NKCC1 exon 2a, 4a, and 27) were detected by RACE.
Characterization of NKCC1 splice variants by end-to-end RT-PCR
End-to-end RT-PCR was used to further examine the genomic structures of the NKCC1 transcripts with sense primers binding to the first exon and antisense primers binding to each of the alternative termination exons identified by RACE. Antisense primers binding to two alternative termination exons (exons 4a and 2a) were designed to recognize the unique elongations of these exons, and thus were specific to the novel termination exons (Table 2). Multiple PCR products obtained from the reactions were subsequently cloned into plasmid vectors and sequenced.
We sequenced hundreds of clones derived from both human fetal and adult brain poly A+ RNA and confirmed the previously reported large transcripts, NKCC1a (the full-length transcript) and NKCC1b (with a deletion of exon 21: Δ21) (Fig. 2). Additionally, our assays identified a long transcript with a novel exon 21(21a), and another with a deletion of exons 5–26 (Δ5–26), both ending with exon 27 (Fig. 2). These two transcripts were found infrequently among our clones. Finally, we identified two very short novel NKCC1 transcripts, 1–4a and 1–2a, both of which were abundant among our clones. We confirmed the full-length genomic structures of newly identified isoforms. All exons in the novel transcripts that we identified were identical to the NKCC1 genomic sequence (NT_034772.6) and conformed to the consensus donor and acceptor sequences. The nonsense-mediated mRNA decay pathway is predicted to degrade only the 21a alternate transcript (Chang et al., 2007). The 21a alternate transcript is predicted to degrade rather than being translated into protein because the ORF starting from exon 1 resulted in a premature stop codon (Fig. 2, open ovals). The presence of stop codons indicates that these may be translated into proteins (Fig. 2, closed ovals). The predicted molecular weight (MW) of each protein isoform translated from the first start codon within NKCC1 exon 1 up to the normal stop codon or the premature termination codon, was calculated using Compute pI/Mw tool (http://www.expasy.org/tools/pi_tool.html) and shown under the column MW.
Figure 2.

Schematic representation of the genomic organization of alternative splice variants of the human NKCC1 gene. The genomic organization of the human NKCC1 gene (isoform NKCC1a) is shown at the top of the figure, along with horizontal arrows indicating transcriptional orientation. The continuous line indicates genomic sequence, on which known exons of NKCC1 are shown as rectangles and numbered. Novel exons (exon 2a located in intron 2, 4a in intron 4, and 21a in intron 21) are shown as small rectangles. An oval represents the location of the stop codon for the ORF starting with NKCC1 exon 1; the open oval indicates a premature termination codon (PTC); the closed oval indicates the normal stop codon. The predicted MW of each protein isoform, translated from the first start codon within NKCC1 exon 1 up to the normal stop codon or the PTC, was calculated using the Compute pI/Mw tool (http://www.expasy.org/tools/pi_tool.html) and shown under the column MW. Variants used in transfection experiments are marked with asterisks.
Expression of proteins in transfected HEK 293 cells
HEK293 cells were transfected with a Myc-fusion construct containing the following NKCC1 variants: NKCC1a (exon 1–27), NKCC1b (exon 1–27, Δ21), 1–4a, and 1–2a. Using Western blotting with an anti-Myc antibody, we determined that these isoforms are translated into proteins, as indicated by single bands of the approximately predicted sizes (Fig. 3a). In lane 1a, a band was found at 140 kDa. In lane 1b (Δ21), a band was identified at 130 kDa, in lane 1c (1–4a) at 50 kDa, and in lane 1d (1–2a), a band was located at 40 kDa (Fig. 3a). We used the mammalian expression vector pCMV-SC-NM containing an N-terminal Myc tag (Stratagene) for NKCC1 clones. Proper orientation of the insert was confirmed with restriction digests followed by sequencing.
Subcellular distribution of NKCC1 proteins
We transfected HEK293 cells with Myc-fusion constructs containing the following NKCC1 variants: NKCC1a (exon 1–27), NKCC1b (exon 1–27, Δ21), 1–4a, and 1–2a (Fig. 3a). After 36 h, the cells were harvested for protein extraction. Protein extraction was performed using a commercial kit (Millipole). Then, these proteins were measured into four compartments: cytoplasm, nucleus, membranes, and cytoskeleton proteins. NKCC1a (exon 1–27), NKCC1b (exon 1–27, Δ21), and 1–4a isoforms were present in both the cytoplasmic and membrane fractions (Fig. 3b). However, the protein from the 1–2a isoform was found only in the cytoplasmic compartment (Fig. 3b). We confirmed these results in a second type of cell line, human SH-SY5Y neuroblastoma cells (Fig. 3c).
Expression of NKCC1 transcripts across the lifespan
To investigate the developmental expression profile of the novel transcripts, we used samples from the prefrontal cortex of nonpsychiatric controls from the fetal 14th through 20th gestational week and from birth through old age (78 years of age). We assessed mRNA expression levels of novel NKCC1 transcripts (isoforms 1–27 (21a), 1–4a, and 1–2a) as well as the known transcripts NKCC1a (1–27) and NKCC1b (1–27 (Δ21)) in the DLPFC by quantitative real-time PCR (for assay sequences, see Table 3). The expression of NKCC1a (1–27) was measured using an assay spanning exon 20 and exon 21, expression of NKCC1b (1–27 (Δ21)), using an assay spanning exon 20 and exon 22, expression of 1–4a, using an assay spanning the annotated exon 4 and a unique exon 4a, and expression of NKCC1b 1–2a, using an assay spanning the annotated exon 2 and a unique exon 2a. We did not measure isoform 1–27 (Δ5–26) by qPCR because of low abundance (Ct > 36) of mRNA expression in our preliminary study (data not shown). All data were normalized to a geometric mean of three “housekeeping genes”: ACTB, B2M, and GUSB. NKCC1a (1–27), NKCC1b (1–27 (Δ21)), and 1–4a were lower during fetal development, increased after birth through adolescence, and had more stable expression throughout adulthood (Fig. 4a,b,d). Expression of 1–27 (21a) transcript was very low throughout fetal and postnatal life (Fig. 4c). Expression of the 1–2a transcript was much higher during fetal development, dropped around birth, and remained stably expressed throughout postnatal life (Fig. 4e). Of all these isoforms, only the ultrashort NKCC1 transcript (1–2a) was expressed preferentially during fetal development.
Figure 4.
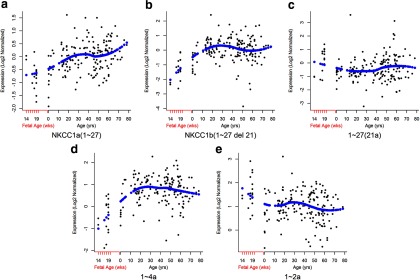
Expression of NKCC1 transcripts in the human prefrontal cortex across the lifespan, from gestational week 14 through 20, and from birth (0) until old age. Age is on the x-axis; relative expression levels are on the y-axis. Each dot represents one subject; the blue diamonds represent the Loess fit. a, NKCC1a (1–27). b, NKCC1b (1–27 (Δ21)). c, 1–27 (21a). d, 1–4a. e, 1–2a. The ultrashort NKCC1 transcript (1–2a) is expressed preferentially in the fetal prefrontal cortex (e).
mRNA expression of NKCC1 splice variants in schizophrenia
qRT-PCR mRNA was used to measure expression levels of the novel NKCC1 transcripts (isoforms 1–27 (21a), 1–4a, and an isoform 1–2a) as well as the previously identified NKCC1 transcripts in the DLPFC of patient and control samples (for assay sequences, see Table 3). All normalized data were covaried by age at death, PMI, pH, RIN, and sex. Compared with nonpsychiatric controls, the expression of NKCC1b and 1–2a mRNA was significantly decreased in the DLPFC of patients with schizophrenia (NKCC1b (1–27 (Δ21)): ANCOVA: 0.8-fold decrease, F(1,86) = 6.4, p = 0.013; 1–2a: ANCOVA: 0.8-fold decrease, F(1,84) = 8.1, p = 0.006) (Fig. 5). We then separately evaluated the effect of diagnosis in blacks and whites. In the black subjects, NKCC1b, 21a, 1–4a, and 1–2a isoforms were significantly decreased in the DLPFC of patients with schizophrenia compared with controls (NKCC1b (1–27 (Δ21)): ANCOVA: 0.7-fold decrease, F(1,52) = 7.9, p = 0.007; 1–27 (21a): ANCOVA: 0.7-fold decrease, F(1,53) = 5.5, p = 0.022; 1–4a: ANCOVA: 0.8-fold decrease, F(1,55) = 6.5, p = 0.014; 1–2a: ANCOVA: 0.8-fold decrease, F(1,53) = 6.2, p = 0.016) (Fig. 6). There was no difference in the expression of NKCC1a (1–27) (F values <1.0, p > 0.5). In the white subjects, only the 1–2a isoform was significantly decreased in patients with schizophrenia (ANCOVA: 0.8-fold decrease, F(1,27) = 6.3, p = 0.018) (Fig. 6). We examined the potential contribution of clinical factors to the differences in the expression between schizophrenics and controls. There were no significant effects of a history of substance abuse, age at the onset of the disease, age at first hospitalization, duration of illness, estimated daily life, and last dose of neuroleptics on any of the NKCC1 transcripts' expression in patients with schizophrenia (all p > 0.11).
Figure 5.
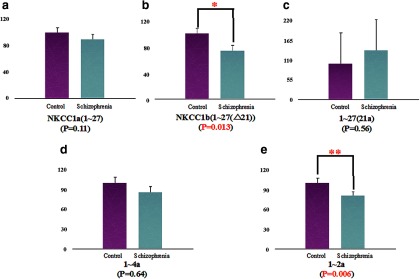
Expression of NKCC1 transcripts in the DLPFC of patients with schizophrenia and nonpsychiatric controls. The expression of NKCC1b (1–27 (Δ21)) (*) and 1–2a (**) mRNA was significantly decreased in the DLPFC of patients with schizophrenia (NKCC1b: N = 48; 1–2a: N = 45) compared with controls (NKCC1b: N = 47; 1–2a: N = 44) (b,e). Expression of NKCC1a (1–27), 1–27 (21a), and 1–4a transcripts was not different in the DLPFC of patients with schizophrenia (NKCC1a: N = 45; 1–27: N = 44; 1–4a: N = 45) compared with controls (NKCC1a: N = 48; 1–27: N = 47; 1–4a: N = 48) (a,c,d).
Figure 6.
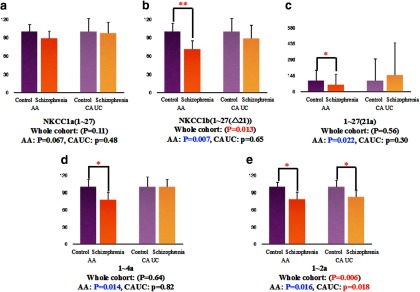
Expression of NKCC1 transcripts in the DLPFC of patients with schizophrenia and nonpsychiatric controls. We examined expression levels in the black group (AA) and white (CAUC) groups separately, comparing controls with patients with schizophrenia. In the black cohort, NKCC1b (1–27 (Δ21)) (**), 1–27 (21a) (*), 1–4a (*), and 1–2a (*) isoforms were significantly decreased in the DLPFC of patients with schizophrenia (NKCC1b: N = 28; 1–27: N = 27; 1–4a: N = 28; 1–2a: N = 27) compared with controls (NKCC1b: N = 31; 1–27: N = 30; 1–4a: N = 31; 1–2a: N = 30) (b–e). In the white cohort, the 1–2a isoform was also significantly decreased in patients with schizophrenia (N = 17) compared with controls (N = 14) (*) (e). There were no differences in the expression of NKCC1b (1–27 (Δ21)) (Control: N = 15; Schizophrenia: N = 17), 1–27 (21a) (Control: N = 15; Schizophrenia: N = 17), and 1–4a (Control: N = 15; Schizophrenia: N = 17) transcripts in the white cohort (b–d). There was no significant difference in the expression of NKCC1a (1–27) in either the black cohort (Control: N = 32; Schizophrenia: N = 28) or the white cohort (Control: N = 15; Schizophrenia: N = 17) (a).
Effects of NKCC1 genotype on NKCC1 splice variant expression
We examined the association of genetic variation at 10 tagging SNPs in NKCC1 on the mRNA expression levels of the splice variants in patients and controls. All data were covaried by age at death, pH, RIN, and sex. The mRNA expression of NKCC1a and NKCC1b was significantly associated with allelic variation at rs12189448: individuals homozygous for the major allele, A, had significantly higher expression of both NKCC1a (1.3-fold increase, F(1,88) = 4.91, p = 0.03) and NKCC1b (1.4-fold increase, F(1,87) = 6.45, p = 0.013) compared with carriers of the minor allele, C (Fig. 7). Additionally, allelic variation at rs3087889 was significantly associated with the expression of NKCC1b in a dose-dependent fashion (F(2,86) = 3.81, p = 0.026). That is, in the combined cohort of patients with schizophrenia and normal controls, individuals homozygous for the minor allele, A, at rs3087889 had significantly lower NKCC1b expression than those homozygous for the major allele, T (1.5-fold decrease, p < 0.01). Additionally, rs1218948 explained 4.47% (Cohen's d = 0.43) and rs3087889 explained 1.07% (Cohen's d = 0.21) of the NKCC1 splice variant expression. No association was observed between any of these polymorphisms and genotype, or race and genotype (all F values <0.05, all p values >0.8) (For allele frequencies by race for Fig. 7, see Table 6).
Table 6.
Genotype and allele frequencies by race at NKCC1 rs3087889, in a combined cohort of patients with schizophrenia and normal controls
| Black | White | Asian | |
|---|---|---|---|
| TT | 22 | 15 | 0 |
| TA | 25 | 14 | 2 |
| AA | 12 | 3 | 0 |
| T allele | 69 | 44 | 2 |
| A allele | 49 | 20 | 2 |
Allelic variation in NKCC1 and clinical risk, cognitive performance, and fMRI measures
In our clinical datasets, allelic variations in NKCC1 were associated with risk for schizophrenia. Family-based association testing revealed that the minor allele, A, for rs3087889 was associated with schizophrenia in families (p = 0.03), the same allele associated with reduced expression of the 1b transcript. One other SNP reached nominal significance in the family-based association testing analysis: rs3805616 (p = 0.01), which is in moderate LD with rs3087889 (r2 = 0.63, D′ = 1). From the allelic model for the case-control data, both rs3087889 and rs3805616 each explained 0.3% (OR = 1.5) of risk for schizophrenia.
Although the clinical associations are weak, we sought to amplify their meaning by exploring associations with intermediate phenotypes related to risk for schizophrenia. Cognitive deficits in working memory have been well established as core clinical features of patients with schizophrenia and observed in the healthy siblings of patients. This latter observation suggests that they are traits linked to clinical risk, so-called intermediate phenotypes (Preston and Weinberger, 2005). Indeed, A allele carriers at rs3087889 had a strong association with poorer performance on a working memory (WM) task (p = 0.006) in normal individuals (see Table 5). For risk for cognitive defects, rs10089 and rs3087889 explained 3.51% (Cohen's d = 0.38) and 3.13% (Cohen's d = 0.35) variance, respectively, of performance on the N-back cognitive task. In addition, these two SNPs explained 1.18% (Cohen's d = 0.22) and 0.86% (Cohen's d = 0.18), respectively, of variance for the global composite of general cognitive performance, g.
Prefrontal inefficiency during working memory as measured by fMRI is another well-characterized intermediate phenotype that is heritable in healthy twins (Blokland et al., 2011) and found in both schizophrenic subjects and their unaffected siblings (Callicott et al., 2003). We found that the same allele of rs3087889 predicting poorer working memory and lower g was also associated with prefrontal signal during the N-back (Fig. 8). Specifically, NKCC1 minor or “risk” allele (A) carriers showed greater activation without better performance (i.e., prefrontal efficiency) (Talairach coordinate peak [−45, 33, 27], SPM T = 3.17, p = 0.001 uncorrected; SVC FWE: p = 0.03, Cohen's d = 0.36 or 3.1% explained variance). Thus, the same allele of rs3087889 was associated with decreased expression of NKCC1b in human prefrontal cortex, risk for schizophrenia in a family-based study, deficits in working memory performance and inefficient prefrontal physiology in normal subjects during a working memory task, in both latter cases resulting in small-moderate effect (d ∼ 0.4).
Discussion
Our investigations have identified four novel alternative splice variants of the NKCC1 gene in human brain homogenates. Among these variants, the expression levels of NKCC1b (1–27 (Δ21)) and 1–2a were decreased in schizophrenia compared with nonpsychiatric controls in a combined cohort of blacks and whites. There was a significant effect of diagnosis for the NKCC1b (1–2-7 (Δ21)), 1–27 (21a), 1–4a, and 1–2a isoforms in black subjects, and for 1–2a isoform in white subjects. Furthermore, we also detected significant associations of NKCC1 polymorphisms (rs12189448 and rs3087889) with decreased expression of the alternative transcripts NKCC1a (1–27), and NKCC1b (1–27 (Δ21)). Using homogenates, it is not possible to distinguish whether these changes are present in neurons, glia, or both, as they all are known to express NKCC1 in the human brain (Hübner et al., 2001; Kanaka et al., 2001).
Not only was there an association between NKCC1 genotype and transcript expression in postmortem brain, there also was a clinical relationship in vivo. From the expression data, one of the two SNPs (rs3087889) was associated with increased risk for schizophrenia, abnormal cognition, and alterations within the DLPFC and hippocampus during fMRI. In neuropsychological data, rs3087889 predicted worse working memory and general cognitive performance in controls, whereas family-based tests showed genotype associations to affected/unaffected sibling differences in cognitive performance, including memory, processing speed, working memory, card sorting, and span (Tables 4 and 5). Using fMRI, there was an association within imaging space between allelic variation in NKCC1 rs3087889 and neural activity within the WM network as measured by BOLD fMRI. Within DLPFC, these differences were driven by increased and thus less efficient (Callicott et al., 1999) activation by rs3087889 A allele carriers (Fig. 8). In other words, A allele carriers activated DLPFC more than non-TT carriers during WM tasks, despite equivalent task accuracy and reaction time. The postmortem and in vivo findings suggest that allelic variation in NKCC1 at rs3087889 is associated with abnormal expression of alternate transcripts and that this abnormal expression may underlie cortical information processing dysfunction within the WM neural network that have been linked with schizophrenia. Moreover, these data suggest that NKCC1 may contribute to the heritability of WM network inefficiency and increase susceptibility for schizophrenia, albeit in a small way as effect sizes across datasets were generally small. It is tempting to speculate that alterations in alternate transcripts, cognitive deficits, and BOLD differences are part of a single mechanistic chain, but this would require greater work on the physiological ramifications of altered transcript on prefrontal neuronal function. Additionally, determining a mechanistic “chain of causation” would be difficult across datasets (e.g., lack of cognitive or MRI data (“antemortem”) for postmortem samples) and may require much larger sample sizes even to understand links between cognition and fMRI. It should be noted that, whereas genetic variation in NKCC1 has not been associated with schizophrenia in recent genome-wide association studies at genome-wide significance levels, multiple SNPs within the gene show association at p < 0.01 (Ripke et al., 2011).
In our protein extraction studies, we detected NKCC1a (1–27), NKCC1b (1–27 (Δ21)), and 1–4a isoform bands in the cytoplasmic and membrane protein fractions of brain tissue (Fig. 3b). The presence of NKCC1b (1–27 (Δ21)) in the membrane protein fraction supports previous observations that this protein may act as a functional cation cotransporter (Vibat et al., 2001). Allelic variation at rs3087889 was significantly associated with the expression of NKCC1b (1–27 (Δ21)) in a dose-dependent fashion. In particular, individuals homozygous for the minor allele (A) at rs3087889 had significantly lower expression than those homozygous for the major allele (T). Collectively, these findings suggest that genetic variation at rs3087889 leads to alterations in NKCC1b expression, and this in turn may contribute to both the genetic vulnerability to schizophrenia and defects in working memory.
The novel 1–2a transcript is expressed in much higher levels in fetal than postnatal brains, suggesting a role for the 1–2a isoform in early brain development. Interestingly, the 1–2a protein band only was found in the cytoplasmic fraction. According to the NKCC1 amino acid sequence, whereas the 1–4a protein should contain two of the transmembrane domains (TM1 and TM2), the 1–2a protein is predicted to lack TM domains. Our data suggest that 1–4a isoform retains a transmembrane location. As such, the 1–2a protein could not function as a Na+-K+-2Cl− cotransporter. The actual role of the 1–2a protein during early brain development remains unclear. In our qPCR studies, we found significant differences in 1–2a isoform expression levels between the patients with schizophrenia and normal controls in a combined cohort, as well as separately in the black and white cohorts. This suggests that the 1–2a isoform might play the important roles not only in early brain development but also in the pathophysiology of schizophrenia.
In the brain, NKCC1 is present in neuronal and non-neuronal cell types (Plotkin et al., 1997a). In neurons, NKCC1 is functionally linked to postsynaptic GABA receptors (Sung et al., 2000). Early in development, GABA, the primary inhibitory neurotransmitter in adults, excites neurons because of the relatively high expression of the NKCC1. In addition to its role in neurotransmission, GABA is also involved in several essential developmental functions, including neuronal migration, cell division, and neurite growth (Owens and Kriegstein, 2002). Recently, Wang and Kriegstein (2008) indicated that the development of a balance between excitatory and inhibitory synapses is a critical process in the generation and maturation of functional circuits. They reported that GABA-induced depolarization is necessary for proper excitatory synapse formation and dendritic development in newborn cortical neurons. They also indicated that GABA's role in glutamatergic synaptic development is dependent on its ability to depolarize and activate voltage-dependent NMDA receptors (Wang and Kriegstein, 2008). Several studies indicate that the expression of AMPA, NMDA, and dopamine receptors on GABA interneurons dramatically changes during postnatal brain maturation (Hornung and Fritschy, 1996; Hashimoto et al., 2009). Abnormalities in cortical GABA interneurons may play an important role in the pathophysiology of schizophrenia (Davidson et al., 1999; Lisman et al., 2008). Dysfunction of fast spiking interneurons might lead to disinhibition of pyramidal neurons in the cortex and hippocampus, as well as asynchrony of pyramidal neuron activation and cognitive impairment, all thought to be hallmarks of the pathophysiology of schizophrenia (Uhlhaas et al., 2008). Alterations in the electrophysiological effects of GABA early in life could lead to abnormal brain development. Abnormalities in GABA signaling in adulthood could contribute to the cognitive deficits that are an intrinsic and disabling feature of schizophrenia.
Previous work has suggested association of specific splice variants with the pathophysiology of schizophrenia (Huffaker et al., 2009; Nakata et al., 2009; Tao et al., 2012). In this study, we identified several novel isoforms of NKCC1, and for some their expression levels were significantly different in patients with schizophrenia compared with controls in the DLPFC. We suggest that the regulation of NKCC1 splicing mechanisms might play the critical role about the pathophysiology of schizophrenia, especially during fetal age or early brain development. Because there are well-known molecules that block NKCC1 activity (Kahle et al., 2009), such as the diuretic bumetanide, NKCC1 might be a reasonable target for drug development in schizophrenia.
Footnotes
We thank Amy Deep-Soboslay of the Lieber Institute for Brain Development for efforts in clinical diagnosis and demographic characterization; Vesna Imamovic, Yeva Snitkovsky, Jonathan Sirovatka, and Bianca Iglesieas of the Clinical Brain Disorders Branch, NIMH, for excellent technical assistance; Dr. Ronald Zielke, Robert D. Vigorito, and Robert M. Johnson of the National Institute of Child Health and Human Development Brain and Tissue Bank for Developmental Disorders at the University of Maryland for their provision of fetal, child, and adolescent brain specimens for this study; and Anna Brandtjen of the Lieber Institute for Brain Development for expertise in content review and editing.
The authors declare no competing financial interests.
References
- Akbarian S, Huntsman MM, Kim JJ, Tafazzoli A, Potkin SG, Bunney WE, Jr, Jones EG. GABAA receptor subunit gene expression in human prefrontal cortex: comparison of schizophrenics and controls. Cereb Cortex. 1995;5:550–560. doi: 10.1093/cercor/5.6.550. [DOI] [PubMed] [Google Scholar]
- Arion D, Lewis DA. Altered expression of regulators of the cortical chloride transporters NKCC1 and KCC2 in schizophrenia. Arch Gen Psychiatry. 2011;68:21–31. doi: 10.1001/archgenpsychiatry.2010.114. [DOI] [PMC free article] [PubMed] [Google Scholar]
- Ben-Ari Y. Excitatory actions of GABA during development: the nature of the nurture. Nat Rev Neurosci. 2002;3:728–739. doi: 10.1038/nrn920. [DOI] [PubMed] [Google Scholar]
- Blaesse P, Airaksinen MS, Rivera C, Kaila K. Cation-chloride cotransporters and neuronal function. Neuron. 2009;61:820–838. doi: 10.1016/j.neuron.2009.03.003. [DOI] [PubMed] [Google Scholar]
- Blokland GA, McMahon KL, Thompson PM, Martin NG, de Zubicaray GI, Wright MJ. Heritability of working memory brain activation. J Neurosci. 2011;31:10882–10890. doi: 10.1523/JNEUROSCI.5334-10.2011. [DOI] [PMC free article] [PubMed] [Google Scholar]
- Callicott JH, Mattay VS, Bertolino A, Finn K, Coppola R, Frank JA, Goldberg TE, Weinberger DR. Physiological characteristics of capacity constraints in working memory as revealed by functional MRI. Cereb Cortex. 1999;9:20–26. doi: 10.1093/cercor/9.1.20. [DOI] [PubMed] [Google Scholar]
- Callicott JH, Bertolino A, Mattay VS, Langheim FJ, Duyn J, Coppola R, Goldberg TE, Weinberger DR. Physiological dysfunction of the dorsolateral prefrontal cortex in schizophrenia revisited. Cereb Cortex. 2000;10:1078–1092. doi: 10.1093/cercor/10.11.1078. [DOI] [PubMed] [Google Scholar]
- Callicott JH, Egan MF, Mattay VS, Bertolino A, Bone AD, Verchinksi B, Weinberger DR. Abnormal fMRI response of the dorsolateral prefrontal cortex in cognitively intact siblings of patients with schizophrenia. Am J Psychiatry. 2003;160:709–719. doi: 10.1176/appi.ajp.160.4.709. [DOI] [PubMed] [Google Scholar]
- Chang YF, Imam JS, Wilkinson MF. The nonsense-mediated decay RNA surveillance pathway. Annu Rev Biochem. 2007;76:51–74. doi: 10.1146/annurev.biochem.76.050106.093909. [DOI] [PubMed] [Google Scholar]
- Charych EI, Liu F, Moss SJ, Brandon NJ. GABA(A) receptors and their associated proteins: implications in the etiology and treatment of schizophrenia and related disorders. Neuropharmacology. 2009;57:481–495. doi: 10.1016/j.neuropharm.2009.07.027. [DOI] [PMC free article] [PubMed] [Google Scholar]
- Davidson M, Reichenberg A, Rabinowitz J, Weiser M, Kaplan Z, Mark M. Behavioral and intellectual markers for schizophrenia in apparently healthy male adolescents. Am J Psychiatry. 1999;156:1328–1335. doi: 10.1176/ajp.156.9.1328. [DOI] [PubMed] [Google Scholar]
- Dickinson D, Goldberg TE, Gold JM, Elvevåg B, Weinberger DR. Cognitive factor structure and invariance in people with schizophrenia, their unaffected siblings, and controls. Schizophr Bull. 2011;37:1157–1167. doi: 10.1093/schbul/sbq018. [DOI] [PMC free article] [PubMed] [Google Scholar]
- Dzhala VI, Talos DM, Sdrulla DA, Brumback AC, Mathews GC, Benke TA, Delpire E, Jensen FE, Staley KJ. NKCC1 transporter facilitates seizures in the developing brain. Nat Med. 2005;11:1205–1213. doi: 10.1038/nm1301. [DOI] [PubMed] [Google Scholar]
- Egan MF, Goldberg TE, Gscheidle T, Weirich M, Bigelow LB, Weinberger DR. Relative risk of attention deficits in siblings of patients with schizophrenia. Am J Psychiatry. 2000;157:1309–1316. doi: 10.1176/appi.ajp.157.8.1309. [DOI] [PubMed] [Google Scholar]
- Egan MF, Goldberg TE, Gscheidle T, Weirich M, Rawlings R, Hyde TM, Bigelow L, Weinberger DR. Relative risk for cognitive impairments in siblings of patients with schizophrenia. Biol Psychiatry. 2001;50:98–107. doi: 10.1016/S0006-3223(01)01133-7. [DOI] [PubMed] [Google Scholar]
- Gamba G, Saltzberg SN, Lombardi M, Miyanoshita A, Lytton J, Hediger MA, Brenner BM, Hebert SC. Primary structure and functional expression of a cDNA encoding the thiazide-sensitive, electroneutral sodium-chloride cotransporter. Proc Natl Acad Sci U S A. 1993;90:2749–2753. doi: 10.1073/pnas.90.7.2749. [DOI] [PMC free article] [PubMed] [Google Scholar]
- Gillen CM, Brill S, Payne JA, Forbush B., 3rd Molecular cloning and functional expression of the K-Cl cotransporter from rabbit, rat, and human: a new member of the cation-chloride cotransporter family. J Biol Chem. 1996;271:16237–16244. doi: 10.1074/jbc.271.27.16237. [DOI] [PubMed] [Google Scholar]
- Hanse E, Durand GM, Garaschuk O, Konnerth A. Activity-dependent wiring of the developing hippocampal neuronal circuit. Semin Cell Dev Biol. 1997;8:35–42. doi: 10.1006/scdb.1996.0119. [DOI] [PubMed] [Google Scholar]
- Hashimoto T, Arion D, Unger T, Maldonado-Avilés JG, Morris HM, Volk DW, Mirnics K, Lewis DA. Alterations in GABA-related transcriptome in the dorsolateral prefrontal cortex of subjects with schizophrenia. Mol Psychiatry. 2008;13:147–161. doi: 10.1038/sj.mp.4002011. [DOI] [PMC free article] [PubMed] [Google Scholar]
- Hashimoto T, Nguyen QL, Rotaru D, Keenan T, Arion D, Beneyto M, Gonzalez-Burgos G, Lewis DA. Protracted developmental trajectories of GABAA receptor alpha1 and alpha2 subunit expression in primate prefrontal cortex. Biol Psychiatry. 2009;65:1015–1023. doi: 10.1016/j.biopsych.2009.01.004. [DOI] [PMC free article] [PubMed] [Google Scholar]
- Hiki K, D'Andrea RJ, Furze J, Crawford J, Woollatt E, Sutherland GR, Vadas MA, Gamble JR. Cloning, characterization, and chromosomal location of a novel human K+-Cl− cotransporter. J Biol Chem. 1999;274:10661–10667. doi: 10.1074/jbc.274.15.10661. [DOI] [PubMed] [Google Scholar]
- Hornung JP, Fritschy JM. Developmental profile of GABAA-receptors in the marmoset monkey: expression of distinct subtypes in pre- and postnatal brain. J Comp Neurol. 1996;367:413–430. doi: 10.1002/(SICI)1096-9861(19960408)367:3<413::AID-CNE7>3.0.CO;2-8. [DOI] [PubMed] [Google Scholar]
- Horvath S, Xu X, Laird NM. The family based association test method: strategies for studying general genotype–phenotype associations. Eur J Hum Genet. 2001;9:301–306. doi: 10.1038/sj.ejhg.5200625. [DOI] [PubMed] [Google Scholar]
- Hübner CA, Lorke DE, Hermans-Borgmeyer I. Expression of the Na-K-2Cl-cotransporter NKCC1 during mouse development. Mech Dev. 2001;102:267–269. doi: 10.1016/S0925-4773(01)00309-4. [DOI] [PubMed] [Google Scholar]
- Huffaker SJ, Chen J, Nicodemus KK, Sambataro F, Yang F, Mattay V, Lipska BK, Hyde TM, Song J, Rujescu D, Giegling I, Mayilyan K, Proust MJ, Soghoyan A, Caforio G, Callicott JH, Bertolino A, Meyer-Lindenberg A, Chang J, Ji Y, et al. A primate-specific, brain isoform of KCNH2 affects cortical physiology, cognition, neuronal repolarization and risk of schizophrenia. Nat Med. 2009;15:509–518. doi: 10.1038/nm.1962. [DOI] [PMC free article] [PubMed] [Google Scholar]
- Hyde TM, Lipska BK, Ali T, Mathew SV, Law AJ, Metitiri OE, Straub RE, Ye T, Colantuoni C, Herman MM, Bigelow LB, Weinberger DR, Kleinman JE. Expression of GABA signaling molecules KCC2, NKCC1, and GAD1 in cortical development and schizophrenia. J Neurosci. 2011;31:11088–11095. doi: 10.1523/JNEUROSCI.1234-11.2011. [DOI] [PMC free article] [PubMed] [Google Scholar]
- Johnson JM, Castle J, Garrett-Engele P, Kan Z, Loerch PM, Armour CD, Santos R, Schadt EE, Stoughton R, Shoemaker DD. Genome-wide survey of human alternative pre-mRNA splicing with exon junction microarrays. Science. 2003;302:2141–2144. doi: 10.1126/science.1090100. [DOI] [PubMed] [Google Scholar]
- Kahle KT, Barnett SM, Sassower KC, Staley KJ. Decreased seizure activity in a human neonate treated with bumetanide, an inhibitor of the Na(+)-K(+)-2CL(−) cotransporter NKCC1. J Child Neurol. 2009;26:657–658. doi: 10.1177/0883073809333526. [DOI] [PubMed] [Google Scholar]
- Kaila K. Ionic basis of GABAA receptor channel function in the nervous system. Prog Neurobiol. 1994;42:489–537. doi: 10.1016/0301-0082(94)90049-3. [DOI] [PubMed] [Google Scholar]
- Kanaka C, Ohno K, Okabe A, Kuriyama K, Itoh T, Fukuda A, Sato K. The differential expression patterns of messenger RNAs encoding K-Cl cotransporters (KCC1,2) and Na-K-2Cl cotransporter NKCC1 in the rat nervous system. Neuroscience. 2001;104:933–946. doi: 10.1016/S0306-4522(01)00149-X. [DOI] [PubMed] [Google Scholar]
- Kim JY, Liu CY, Zhang F, Duan X, Wen Z, Song J, Feighery E, Lu B, Rujescu D, St Clair D, Christian K, Callicott JH, Weinberger DR, Song H, Ming G. Interplay between DISC1 and GABA signaling regulates neurogenesis in mice and risk for schizophrenia. Cell. 2012;148:1051–1064. doi: 10.1016/j.cell.2011.12.037. [DOI] [PMC free article] [PubMed] [Google Scholar]
- Lander ES, Linton LM, Birren B, Nusbaum C, Zody MC, Baldwin J, Devon K, Dewar K, Doyle M, FitzHugh W, Funke R, Gage D, Harris K, Heaford A, Howland J, Kann L, Lehoczky J, LeVine R, McEwan P, McKernan K, et al. Initial sequencing and analysis of the human genome. Nature. 2001;409:860–921. doi: 10.1038/35057062. [DOI] [PubMed] [Google Scholar]
- Lee H, Chen CX, Liu YJ, Aizenman E, Kandler K. KCC2 expression in immature rat cortical neurons is sufficient to switch the polarity of GABA responses. Eur J Neurosci. 2005;21:2593–2599. doi: 10.1111/j.1460-9568.2005.04084.x. [DOI] [PMC free article] [PubMed] [Google Scholar]
- Leinekugel X, Medina I, Khalilov I, Ben-Ari Y, Khazipov R. Ca2+ oscillations mediated by the synergistic excitatory actions of GABA(A) and NMDA receptors in the neonatal hippocampus. Neuron. 1997;18:243–255. doi: 10.1016/S0896-6273(00)80265-2. [DOI] [PubMed] [Google Scholar]
- Lewis DA, Hashimoto T. Deciphering the disease process of schizophrenia: the contribution of cortical GABA neurons. Int Rev Neurobiol. 2007;78:109–131. doi: 10.1016/S0074-7742(06)78004-7. [DOI] [PubMed] [Google Scholar]
- Lewis DA, Hashimoto T, Volk DW. Cortical inhibitory neurons and schizophrenia. Nat Rev Neurosci. 2005;6:312–324. doi: 10.1038/nrn1648. [DOI] [PubMed] [Google Scholar]
- Lipska BK, Deep-Soboslay A, Weickert CS, Hyde TM, Martin CE, Herman MM, Kleinman JE. Critical factors in gene expression in postmortem human brain: focus on studies in schizophrenia. Biol Psychiatry. 2006;60:650–658. doi: 10.1016/j.biopsych.2006.06.019. [DOI] [PubMed] [Google Scholar]
- Lisman JE, Coyle JT, Green RW, Javitt DC, Benes FM, Heckers S, Grace AA. Circuit-based framework for understanding neurotransmitter and risk gene interactions in schizophrenia. Trends Neurosci. 2008;31:234–242. doi: 10.1016/j.tins.2008.02.005. [DOI] [PMC free article] [PubMed] [Google Scholar]
- Mount DB, Mercado A, Song L, Xu J, George AL, Jr, Delpire E, Gamba G. Cloning and characterization of KCC3 and KCC4, new members of the cation-chloride cotransporter gene family. J Biol Chem. 1999;274:16355–16362. doi: 10.1074/jbc.274.23.16355. [DOI] [PubMed] [Google Scholar]
- Nakata K, Lipska BK, Hyde TM, Ye T, Newburn EN, Morita Y, Vakkalanka R, Barenboim M, Sei Y, Weinberger DR, Kleinman JE. DISC1 splice variants are upregulated in schizophrenia and associated with risk polymorphisms. Proc Natl Acad Sci U S A. 2009;106:15873–15878. doi: 10.1073/pnas.0903413106. [DOI] [PMC free article] [PubMed] [Google Scholar]
- Owens DF, Kriegstein AR. Is there more to GABA than synaptic inhibition? Nat Rev Neurosci. 2002;3:715–727. doi: 10.1038/nrn919. [DOI] [PubMed] [Google Scholar]
- Payne JA, Stevenson TJ, Donaldson LF. Molecular characterization of a putative K-Cl cotransporter in rat brain: a neuronal-specific isoform. J Biol Chem. 1996;271:16245–16252. doi: 10.1074/jbc.271.27.16245. [DOI] [PubMed] [Google Scholar]
- Plotkin MD, Kaplan MR, Peterson LN, Gullans SR, Hebert SC, Delpire E. Expression of the Na(+)-K(+)-2Cl− cotransporter BSC2 in the nervous system. Am J Physiol. 1997a;272:C173–C183. doi: 10.1152/ajpcell.1997.272.1.C173. [DOI] [PubMed] [Google Scholar]
- Preston GA, Weinberger DR. Intermediate phenotypes in schizophrenia: a selective review. Dialogues Clin Neurosci. 2005;7:165–179. doi: 10.31887/DCNS.2005.7.2/gpreston. [DOI] [PMC free article] [PubMed] [Google Scholar]
- Randall J, Thorne T, Delpire E. Partial cloning and characterization of Slc12a2: the gene encoding the secretory Na+-K+-2Cl− cotransporter. Am J Physiol. 1997;273:1267–1277. doi: 10.1152/ajpcell.1997.273.4.C1267. [DOI] [PubMed] [Google Scholar]
- Ripke S, Sanders A, Kendler KS, Levinson DF, Sklar P, Holmans PA, Lin D, Duan J, Ophoff RA, Andreassen OA, Scolnick E, Cichon S, St. Clair D, Corvin A, Gurling H, Werge T, Rujescu D, Blackwood DHR, Pato CB, Malhotra AK, et al. Genome-wide association study identifies five new schizophrenia loci. Nat Genet. 2011;43:969–976. doi: 10.1038/ng.940. [DOI] [PMC free article] [PubMed] [Google Scholar]
- Sartorius N, Jablensky A, Korten A, Ernberg G, Anker M, Cooper JE, Day R. Early manifestations and first-contact incidence of schizophrenia in different cultures: a preliminary report on the initial evaluation phase of the WHO Collaborative Study on determinants of outcome of severe mental disorders. Psychol Med. 1986;16:909–928. doi: 10.1017/S0033291700011910. [DOI] [PubMed] [Google Scholar]
- Sipilä ST, Huttu K, Soltesz I, Voipio J, Kaila K. Depolarizing GABA acts on intrinsically bursting pyramidal neurons to drive giant depolarizing potentials in the immature hippocampus. J Neurosci. 2005;25:5280–5289. doi: 10.1523/JNEUROSCI.0378-05.2005. [DOI] [PMC free article] [PubMed] [Google Scholar]
- Straub RE, Lipska BK, Egan MF, Goldberg TE, Callicott JH, Mayhew MB, Vakkalanka RK, Kolachana BS, Kleinman JE, Weinberger DR. Allelic variation in GAD1 (GAD67) is associated with schizophrenia and influences cortical function and gene expression. Mol Psychiatry. 2007;12:854–869. doi: 10.1038/sj.mp.4001988. [DOI] [PubMed] [Google Scholar]
- Sung KW, Kirby M, McDonald MP, Lovinger DM, Delpire E. Abnormal GABAA receptor-mediated currents in dorsal root ganglion neurons isolated from Na-K-2Cl cotransporter null mice. J Neurosci. 2000;20:7531–7538. doi: 10.1523/JNEUROSCI.20-20-07531.2000. [DOI] [PMC free article] [PubMed] [Google Scholar]
- Tan HY, Nicodemus KK, Chen Q, Li Z, Brooke JK, Honea R, Kolachana BS, Straub RE, Meyer-Lindenberg A, Sei Y, Mattay VS, Callicott JH, Weinberger DR. Genetic variation in AKT1 is linked to dopamine-associated prefrontal cortical structure and function in humans. J Clin Invest. 2008;118:2200–2208. doi: 10.1172/JCI34725. [DOI] [PMC free article] [PubMed] [Google Scholar]
- Tao R, Li C, Newburn EN, Ye T, Lipska BK, Herman MM, Weinberger DR, Kleinman JE, Hyde TM. Transcript specific associations of SLC12A5 (KCC2) in human prefrontal cortex with development, schizophrenia and affective disorders. J Neurosci. 2012;32:5216–5222. doi: 10.1523/JNEUROSCI.4626-11.2012. [DOI] [PMC free article] [PubMed] [Google Scholar]
- Uhlhaas PJ, Haenschel C, Nikolić D, Singer W. The role of oscillations and synchrony in cortical networks and their putative relevance for the pathophysiology of schizophrenia. Schizophr Bull. 2008;34:927–943. doi: 10.1093/schbul/sbn062. [DOI] [PMC free article] [PubMed] [Google Scholar]
- Vibat CR, Holland MJ, Kang JJ, Putney LK, O'Donnell ME. Quantitation of Na+-K+-2Cl− cotransport splice variants in human tissues using kinetic polymerase chain reaction. Anal Biochem. 2001;298:218–230. doi: 10.1006/abio.2001.5398. [DOI] [PubMed] [Google Scholar]
- Volk DW, Austin MC, Pierri JN, Sampson AR, Lewis DA. Decreased glutamic acid decarboxylase67 messenger RNA expression in a subset of prefrontal cortical gamma-aminobutyric acid neurons in subjects with schizophrenia. Arch Gen Psychiatry. 2000;57:237–245. doi: 10.1001/archpsyc.57.3.237. [DOI] [PubMed] [Google Scholar]
- Wang DD, Kriegstein AR. GABA regulates excitatory synapse formation in the neocortex via NMDA receptor activation. J Neurosci. 2008;28:5547–5558. doi: 10.1523/JNEUROSCI.5599-07.2008. [DOI] [PMC free article] [PubMed] [Google Scholar]
- Yamada J, Okabe A, Toyoda H, Kilb W, Luhmann HJ, Fukuda A. Cl− uptake promoting depolarizing GABA actions in immature rat neocortical neurones is mediated by NKCC1. J Physiol. 2004;557:829–841. doi: 10.1113/jphysiol.2004.062471. [DOI] [PMC free article] [PubMed] [Google Scholar]