

Abstract
Daily injections of parathyroid hormone (PTH) are the only FDA-approved anabolic treatment for osteoporosis; however PTH is only clinically approved for treatment periods of up to 24 months. To enhance its anabolic effect, combining PTH with anti-resorptive therapy was proposed and expected to maximize the effectiveness of PTH. The current study aimed to elucidate structural mechanisms through which combination therapy can further improve bone strength over a limited treatment window of 12 days, to more closely examine the early phase of the anabolic window. We examined 30 female rats treated with either Vehicle (Veh), Alendronate (ALN), PTH, or both PTH and ALN (PTH+ALN). Standard and Individual Trabecula Segmentation (ITS)-based microstructural analyses were performed using in vivo micro computed tomography. We found an increase in BV/TV in all treatments with the highest in the PTH+ALN group. Tb.Th* increased in both PTH and PTH+ALN groups well beyond that of the Veh or ALN groups. SMI decreased in all treatments with PTH+ALN having the greatest tendency towards plate-like structures. ITS confirmed the trend towards more plate-like structures with increased plate Tb.N and increased plate-to-rod ratio that was most pronounced in the PTH+ALN group. Using image-based finite element analysis, we demonstrated that stiffness increased in all treatment groups, again with the largest increase in the PTH+ALN group, indicating the resulting structural implications of increased plate-like structure. Static and dynamic bone histomorphometry and a serum resorption marker confirmed that PTH+ALN significantly increased bone formation activities and suppressed bone resorption activities. Overall the results indicate that PTH+ALN treatment has an additive effect due to a preferential increase in plate-like structures.
Keywords: In vivo μCT, 3D image registration, parathyroid hormone, anti- resorptive treatment, trabecular bone microstructure, animal models/rodent
1. Introduction
Anti-resorptive and anabolic agents are two currently available therapeutic options for the treatment of osteoporosis. Anti-resorptive agents inhibit bone resorption and secondarily bone formation to stabilize bone structure and increase bone mass [1, 2]while anabolic agents improve bone mass and bone structure by stimulating both bone formation and bone resorption with a greater impact on formation [3–6]. Daily injections of parathyroid hormone (PTH) are currently the only FDA-approved anabolic treatment for osteoporosis.. However, PTH is only clinically approved for treatment periods of up to 24 months. Within this limited treatment window, enhancing its anabolic effect through various treatment strategies is of great clinical interest.
Since anti-resorptive therapy, such as alendronate (ALN), and anabolic therapy with PTH individually improve bone quality, combined therapy of the two was expected to exert an additive improvement on bone compared to monotherapy. However, the reported outcomes from a small number of available clinical studies were highly variable [7–16]. While some reported that concomitant use of anti-resorptive agents and PTH blunted PTH’s anabolic action [7, 13, 14], three recent studies of PTH and bisphosphonate combination therapy demonstrated a significantly greater increase in the lumbar spine and total hip areal bone mineral density (aBMD) compared with PTH monotherapy [11, 12, 15]. Increases in trabecular BMD and thickness were also noted due to combined therapy [16]. Similar to clinical studies, investigations using rodent models also yielded highly controversial conclusions. A study by Wu X. et al. [17] suggested that co-treatment with alendronate negated the anabolic action of PTH in mouse bone by inhibiting the release of active transforming growth factor (TGF)-β1 during osteoclast bone resorption. Meanwhile, others evaluated the effects of PTH in cases where osteoclasts had been either inhibited or were absent due to treatment with bisphosphonates, OPG or RANKL knockout in murine bone and all these studies still observed anabolic responses to PTH [18–25].
The controversy in clinical and animal studies of combination therapy may result from inconsistent technical assessment. In both clinical and animal studies, areal bone mineral density (aBMD) by dual-energy x-ray absorptiometry (DXA) is often used as a primary outcome of osteoporosis treatment. However, due to the two-dimensional (2D) nature of DXA measurements and its low image resolution, aBMD outcomes are often influenced by changes and variability in bone size, and fail to distinguish relative changes in cortical and trabecular bone compartments. Micro computed tomography (μCT) is available for animal studies to measure three dimensional (3D) bone microarchitecture in response to various treatments. A common study design is to scan bone specimens from euthanized animals that were subjected to a period of treatment and then to compare bone mass and microarchitecture parameters measured by μCT among different treatment groups. However, this cross-sectional design may limit the power to detect meaningful differences. Boyd et al. [26] compared the longitudinal and cross-sectional μCT imaging studies of rat bone to detect changes due to ovariectomy and sham operations. They demonstrated a substantial variation in baseline bone microstructure within the homogenous group of rats, which compromised the power of the cross-sectional study to detect temporal bone changes. Thus, in the current study, we used an in vivo, longitudinal μCT imaging technique where each animal acts as its own control to monitor the temporal and spatial changes in bone in response to treatment. We aimed to elucidate detailed microstructural mechanisms through which PTH and ALN treatments can improve bone strength.
Most studies to date have exposed animals to PTH and combined treatment for 4–12 weeks. In clinical practice, PTH treatment is limited to a period of 24 months, which corresponds to less than 4 weeks in a rodent’s life span. Combined with the more rapid bone turnover in rodents, a shorter treatment time in rats may be more clinically relevant to the short PTH treatment window in humans. Therefore, the objective of this study was to compare the changes in bone remodeling activities, bone mass, microarchitecture, and mechanical stiffness due to 12 days of PTH and combined treatment in a rat model using bone histomorphometry, in vivo μCT and finite element analysis. Moreover, for the first time, a high temporal resolution (in vivo bone scans performed every 4 days) was used to document the immediate treatment response. Based on clinical data that PTH increased surface bone formation in humans within 28 days [27], we hypothesized that 4 days of treatment by PTH would exert a significant anabolic effect on rat bone.
2. Materials and Methods
2.1 Animals
A total of 30 3-month-old, female, Sprague Dawley rats (Charles River Laboratories, Wilmington, MA) were purchased and assigned to vehicle (Veh, n=6), PTH (n=9), alendronate (ALN, n=6), and combined PTH and ALN (PTH+ALN, n=9) treatment groups. Starting from day 0, the Veh group received daily subcutaneous saline injections and the PTH group received daily subcutaneous injections of human recombinant parathyroid hormone 1–34 (PTH 1–34, 60μg/kg/day, Bachem, Bubendorf, Switzerland) for 12 days. This dose was determined based on previous work on older and younger rat models [28, 29]. The ALN group received injections of 50 μg/kg alendronate sodium trihydrate (Sigma Aldrich, St. Louis, MO) every 3 days with the first injection given 3 days prior to day 0. The PTH+ALN group received the both treatments that were given to the PTH and ALN groups. All rats were injected subcutaneously with 15 mg/kg calcein (Sigma Aldrich, St. Louis, MO) at days 3 and 10 for dynamic histomorphometric measurements. All experiments were approved by the University of Pennsylvania's Institutional Animal Care and Use Committee.
2.2 In vivo μCT Scans
In vivo μCT scans were performed for each rat at baseline (day 0) and the end of treatment (day 12) using a Scanco vivaCT 40 (Scanco Medical AG, Brüttisellen, Switzerland) at 10.5 μm nominal voxel size. Our recent work indicates that intermittent PTH treatment can protect the bone against radiation-induced bone damage, and as such, exerts a radioprotective effect [30]. Therefore, in this study the rats in the PTH and PTH+ALN groups received two additional scans at days 4 and 8 to increase the temporal resolution for detecting the earliest treatment effects. The scanner was used at 55 keV energy, 109 μA intensity and 200 ms integration time. During the scans, rats were anesthetized (4.0/1.75% isoflurane) and the right tibia was immobilized using a customized holder to ensure minimal motion. Average scan time was approximately 20 minutes. Before each scan, a 2D scout view was used to select the scan region. A total of 417 slices (corresponding to a 4.5 mm region) distal to the proximal tibial growth plate were acquired.
2.3 Image Registration between Baseline and Follow-up Scans
A landmark-initialized, mutual-information-based registration toolkit [31, 32] of an open source software (National Library of Medicine Insight Segmentation and Registration Toolkit, USA) [33] was used to register the baseline and follow-up scans of the proximal tibia. Briefly, by registering the unaltered trabecular patterns, the common region of trabecular bone volume can be located in each longitudinal μCT image so that the microstructural changes due to local bone remodeling can be quantified at each time point based on the same trabecular volume. These methods result in improved measurement reproducibility with a range of 1.0–2.5% precision errors in trabecular bone density, number, thickness, and spacing measurements and a range of 4.0–7.0% precision errors in trabecular type, connectivity, and stiffness measurements. The detailed methods have been published in our previous work [44].
The trabecular volume of interest (VOI) was defined through semi-automatic contouring of the trabecular bone compartment based on the day-12 scan. The VOI chosen was approximately 2 mm distal from the growth plate and 230 slices corresponding to a 2.4 mm thick section of the trabecular compartment. Transformation matrices from the registrations were then applied to this VOI to locate the corresponding volume of trabecular bone from images at days 0, 4, and 8 [30]. A visual inspection was also performed for each set of registered VOIs to avoid misalignment caused by local optima of the registration.
2.4 Standard Microstructural Analysis
Bone voxels of each registered image were segmented from the bone marrow and background using Gaussian filtering (sigma=1.2 and support=2.0) and a global threshold corresponding to 545 mgHA/cm3. This threshold was determined by an adaptive threshold function provided by the μCT image analysis software on a subset of baseline images, and averaged to be used for all subsequent analyses. Bone microstructural parameters including bone volume fraction (BV/TV), trabecular thickness (Tb.Th*), trabecular spacing (Tb.Sp*), trabecular number (Tb.N*), structure model index (SMI), and connectivity density (Conn.D), were evaluated for each registered VOI by 3D standard microstructural analysis provided by the μCT manufacturer.
2.5 Individual Trabecula Segmentation (ITS)-Based Morphological Analyses
The registered, thresholded trabecular bone VOI was also subjected to an individual trabecula segmentation (ITS)-based morphological analysis to evaluate trabecular bone volume, number, and thickness separately for trabecular plates and rods. First, a complete volumetric decomposition technique was applied to segment the trabecular network into individual plates and rods [35]. Based on the 3D evaluations of each individual trabecular plate and rod, plate and rod bone volume fraction (pBV/TV and rBV/TV), plate and rod number densities (pTb.N and rTb.N, 1/mm), and plate and rod thicknesses (pTb.Th and rTb.Th, mm) were quantified. Plate-to-rod ratio (P-R Ratio), a parameter of plate versus rod characteristics of trabecular bone, was defined as plate bone volume divided by rod bone volume. Detailed methods describing the complete volumetric decomposition technique and ITS-based measurements can be found in our previous publications [35, 36].
2.6 Micro Finite Element Analyses (μFEA)
Based on the registered VOI of the trabecular compartment detailed previously, in vivo μCT images of tibial trabecular bone from days 0 and 12, each bone voxel was converted to an eight-node brick element to construct Finite Element (FE) models for bone stiffness measurements [37]. Bone tissue was modeled as an isotropic, linear elastic material with a Young’s modulus (Es) of 15 GPa and a Poisson’s ratio of 0.3 [38]. A uniaxial compression test was performed to calculate the reaction force under a 0.01 mm displacement along the axial direction of the bone. A linear elastic analysis was performed on the μFE model using an element-by-element pre-conditioned conjugate gradient solver [39]. Then, the trabecular bone stiffness (Tb.Stiff) was derived as reaction force divided by the applied displacement.
2.7 Tissue Mineral Density (TMD) Analysis
After euthanasia, the left tibia of each rat was dissected and a total of 900 slices corresponding to a 3.15 mm region of the proximal tibia were scanned by Scanco microCT 35 (Scanco Medical AG, Brüttisellen, Switzerland) at 3.5 μm voxel size. Attenuation values of each voxel were converted to hydroxyapatite density (mg HA/cm3). A 1.05x1.05x1.05 mm3 cubic sub-volume was extracted from the center of the trabecular compartment and a threshold corresponding to 545 mgHA/cm3 was used to identify the voxels belonging to bone. Next, the voxel layers within 7 μm, corresponding to 2 voxel layers of the bone surface were peeled off to eliminate partial volume effects. The total density of the remaining bone volume was calculated and then normalized by the volume to derive the mean TMD for each sample.
2.8 Cortical Bone Analysis
The scans from the final day of treatment were also used for cortical analysis. The cortical bone compartment of the proximal tibia was manually isolated, and standard cortical parameters were analyzed. Cortical thickness (Ct.Th), cortical porosity (Ct.Po), cortical tissue mineral density (Ct.TMD), polar moment of inertia (pMOI), periosteal perimeter (Ct.Pe.Pm), and endosteal perimeter (Ct.En.Pm) were evaluated using manufacturer-provided software (Scanco Medical AG, Brüttisellen, Switzerland).Given the resolution of 10.5 μm, the porosity measured in vivo reflected only pores greater than approximately 20 μm.
2.9 Static and Dynamic Bone Histomorphometry
Rats were injected with calcein (15 mg/kg) at days 3 and 10 and euthanized at day 12. The scanned right tibia was harvested immediately for methylmethacrylate (MMA) embedding. Longitudinal sections were cut using a Polycut-S motorized microtome (Reichert, Heidelberg, Germany) for static (5 μm thick) and dynamic (8 μm thick) measurements. Static histomorphometry slices were stained with Goldner's trichrome to identify osteoclasts, osteoblasts, and bone surface. All histomorphometric measurements were performed in an area 2.0–5.0 mm below the growth plate using Bioquant Osteo Software (Bioquant Image Analysis, Nashville, TN) and the following parameters were derived: percent of mineralizing surface (MS/BS, %), mineral apposition rate (MAR, μm/day), bone formation rate (BFR/BS, μm3/μm2/day), osteoclast number per bone surface (Oc.N/BS, 1/mm), and the percentage of osteoclast surface (Oc.S/BS, %) [40].
2.10 Serum Biochemistry Analysis
For a subset of rats (n=3 in each treatment group), blood was collected via cardiac puncture at the time of euthanasia and left at room temperature for 30 min before centrifuging at 200×g for 10 min to separate sera. Serum TRAPCP 5b levels were determined by the RatTRAP™ Assay (Immunodiagnostic Systems, Scottsdale, AZ).
2.11 Statistical Analysis
All statistical analyses were performed using NCSS 7.1.14 (NCSS, LLC, Kaysville, UT). Mean ± standard deviation (SD) or standard error of the mean (SEM) were given for all the results. For longitudinal μCT image-based measurements of trabecular microstructure and stiffness, a two-way, repeated measures analysis of variance (ANOVA) was used to compare treatment groups over time. All the comparisons were adjusted for baseline measures. In the presence of statistically significant main effects of treatment, time, and treatment*time interaction, post-hoc comparisons of between-group differences at specific time points and within-group differences between different time points were made using a Bonferroni correction. A one-way ANOVA was also used to compare standard microstructural endpoint measures between groups to assess the power of the in vivo study design (results not shown). A one-way ANOVA with a Tukey Honestly Significance Difference (HSD) post hoc test was performed to determine the treatment effect on serum markers, cortical bone measurements, and bone dynamic parameters measured at the end of treatment. For all analyses, a two-tailed p≤0.05 was considered to indicate statistical significance.
3. Results
3.1 Standard Microstructural Analyses and Finite Element Analysis of Registered, In Vivo Trabecular Bone Images
The trabecular bone compartment was accurately registered for all longitudinal, in vivo scans (Figure 1). Clear evidence of increased bone volume via trabecular thickening can be visualized in both the PTH and PTH+ALN groups. BV/TV, Tb.Th*, Tb.Sp*, SMI, and Tb.Stiff displayed significant treatment-by-time interaction effects, indicating different responses to treatment over time. Conn.D displayed a significant reduction over time that did not differ significantly with treatment. Specifically, Conn.D in PTH and PTH+ALN group at day 12 were significantly lower than those at day 0. Tb.Sp* did not change in most treatment groups except for a small decrease over time in the PTH+ALN group that was significantly reduced from the PTH and Veh groups. No change was observed either over time or between groups for Tb.N* (Table 1). BV/TV increased in all treatment groups with the greatest increase of 45% in the PTH+ALN group, which was significantly higher than PTH (33%) or ALN (13%) treatment alone (Figure 2A, Table 1). While BV/TV displayed an additive effect of PTH+ALN treatment, further structural analysis was required to investigate the mechanism. Tb.Th* in the PTH and PTH+ALN groups increased substantially (35%) beyond that of the Veh (9%) and ALN (10%) groups (Figure 2B, Table 1). However, Tb.Th* in the PTH and PTH+ALN groups increased similarly over time, and thus did not account for the additive effect observed in BV/TV. SMI decreased over the treatment period for all treatments, with the greatest 27% reduction toward more plate-like structure observed in the PTH+ALN group (Figure 2C, Table 1). This reduction was well beyond that of PTH or ALN alone, indicating that changes in structural types may play a role in the additive effect observed. Though no significant difference in Tb.Stiff was found between PTH and PTH+ALN, the same trend was observed, where PTH+ALN displayed the largest, 103% increase in Tb.Stiff, followed by PTH (69%) , ALN (24%), then Veh (9%) groups (Figure 2D, Table 1).
Figure 1.
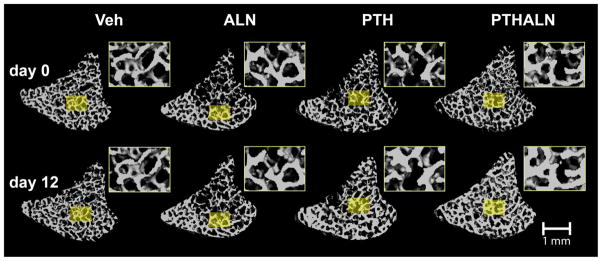
3D bone structure of registered trabecular bone VOIs in the rat proximal tibiaat day 0 and after a 12-day treatment of Veh, ALN, PTH, or PTH+ALN. For each pair of representative trabecular images, regions of similar trabecular patterns were selected from images at day 0 and day 12 and enlarged in the insets for illustrative purposes.
Table 1.
Baseline trabecular bone microstructure and stiffness measures and their % changes (mean±SD) over baseline after 12 days of treatment.
| Baseline | % Changes in 12 days over baseline | ||||
|---|---|---|---|---|---|
| VEH | ALN | PTH | PTH+ALN | ||
| BV/TV | 0.31±0.07 | 5.7±8.7 % | 12.5±3.2 % | 32.5±15.3 % | 45.1±18.5 % |
| Tb.N* (1/mm) | 5.9±0.7 | −2.2±5.5 % | 1.0±1.4 % | −2.6±8.5 % | 1.26±5.5 % |
| Tb.Th* (mm) | 0.069±0.008 | 8.5±6.3 % | 9.8±1.5 % | 35.4±9.6 % | 34.9±14.2 % |
| Tb.Sp* (mm) | 0.15±0.02 | 2.4±3.9 % | −1.9±1.4 % | 2.5±7.3 % | −6.2±3.9 % |
| SMI | 1.2±0.6 | −0.9±6.0 % | −6.4±2.6 % | −14.6±7.5 % | −26.6±9.0 % |
| Conn.D (1/mm3) | 194±46 | −8.5±12.2 % | −4.1±9.6 % | −18.6±14.4 % | −16.3±19.9 % |
| Tb.Stiff (kN/mm) | 82±42 | 9.2±24.6 % | 24.0±13.4 % | 68.5±32.5 % | 102.8±50.8 % |
Significant % changes over baseline are given in bold. Baseline measures are from pooled data of all treatment groups. All parameters were not significantly different among treatment groups at baseline.
Figure 2.

(Left) mean±SEM percent change of (A) BV/TV, (B) Tb.Th*, (C) SMI, and (D) Tb.Stiff in tibial trabecular bone in response to Veh, ALN, PTH, and PTH+ALN treatments over 12 days. a significant difference from baseline in PTH+ALN group; b significant difference from baseline in PTH group; c significant difference from baseline in ALN group; d significant difference from baseline in Veh group; (Right) comparisons between percent change at day 12, where error bars represent %SEM values in (A) BV/TV, (B) Tb.Th*, (C) SMI, and (D) Tb.Stiff of Veh, ALN, PTH, and PTH+ALN groups. * significant difference between treatment groups.
3.2 Individual Trabecula Segmentation (ITS) based Morphological Analyses of Registered, In Vivo Trabecular Bone Images
To further elucidate the structural changes indicated by SMI, ITS-based morphological analyses were completed. The ITS results confirmed that the additive effect of combined PTH+ALN therapy was largely due to plate-like structures (Figure 3, Table 2). This was highlighted by the 73% increase in pBV/TV (Figure 3A) in the PTH+ALN group and 86% increase in P-R ratio (Figure 3C) after 12 days of treatment. In comparison, PTH alone had a 42% increase in pBV/TV, and a 28% increase in P-R ratio. As was observed in the standard trabecular analysis results, similar degrees of plate and rod thickening were observed for both PTH and PTH+ALN groups (Table 2). While SMI can only indirectly measure the plate- or rod-likeness by relative concavity, P-R ratio and pTb.N directly confirmed an increase in plate-like structures due to PTH+ALN treatment (Figure 3C&D). In addition, P-R ratio did not differ between PTH and ALN groups, in contrast to the indication of greater plate-like structure in the PTH group compared to the ALN group by SMI. Though no change in overall Tb.N* was observed, a 6% increase in pTb.N and a 8% decrease in rTb.N was noted in the PTH+ALN group, further supporting the trend in SMI and P-R ratio.
Figure 3.

(Left) mean±SEM percent change of (A) pBV/TV, (B) pTb.Th, (C) P-R ratio, and (D) pTb.N in tibial trabecular bone in response to Veh, ALN, PTH, and PTH+ALN treatments over 12 days. a significant difference from baseline in PTH+ALN group; b significant difference from baseline in PTH group; c significant difference from baseline in ALN group; d significant difference from baseline in Veh group; (Right) comparisons between percent change, where error bars represent %SEM, at day 12 in (A) pBV/TV, (B) pTb.Th, (C) P-R ratio, and (D) pTb.Nof Veh, ALN, PTH, and PTH+ALN groups. * significant difference between treatment groups.
Table 2.
Baseline individual trabecular structural (ITS) analysis and their % changes (mean±SD) after 12 days of treatment over baseline.
| Baseline | % Changes in 12 days over baseline | ||||
|---|---|---|---|---|---|
| VEH | ALN | PTH | PTH+ALN | ||
| pBV/TV | 0.22±0.07 | 6.9±11.8 % | 20.8±7.8 % | 42.1±20.6 % | 73.3±33.6 % |
| rBV/TV | 0.091±0.012 | 4.0±14.8 % | −4.5±5.2 % | 10.8±7.6 % | −4.8±15.2 % |
| pTb.Th (mm) | 0.060±0.004 | 5.9±5.0 % | 5.7±1.7 % | 21.2±4.9 % | 20.5±8.6 % |
| rTb.Th (mm) | 0.051±0.003 | 3.5±3.7 % | 2.5±1.2 % | 9.0±6.0 % | 9.1±4.8 % |
| P-R Ratio | 2.4±0.8 | 5.3±24.3 % | 27.0±13.1% | 28.0±13.2 | 85.6±45.5 |
| pTb.N | 6.5±0.5 | −1.0±2.2 % | 2.4±1.4 % | 0.5±4.2 % | 5.9±5.1 % |
| rTb.N | 6.0±0.3 | −1.5±6.7 % | −3.4±2.2 % | −3.8±4.3 % | −8.4±6.0 % |
Significant % changes over baseline are given in bold. Baseline measures are from pooled data of all treatment groups. All parameters were not significantly different among treatment groups at baseline.
3.3 Tissue Mineral Density (TMD) and Cortical Bone Measurements
TMD showed no differences between treatment groups. The Veh, ALN, PTH, and PTH+ALN groups displayed TMD of 989±22 mg HA/cm3, 985±22 mg HA/cm3, 965±20 mg HA/cm3, and 989±24 mg HA/cm3, respectively.
No differences in cortical bone in the proximal tibia were found between groups (Table 3).
Table 3.
Tibial cortical bone measurements (mean±SD) after 12 days of treatment. No significant differences were found between treatments.
| VEH | ALN | PTH | PTH+ALN | |
|---|---|---|---|---|
| Ct.Th (mm) | 0.31±0.05 | 0.31±0.05 | 0.33±0.06 | 0.34±0.05 |
| Ct.Pe.Pm (mm) | 16.1±1.1 | 16.0±1.1 | 15.2±0.6 | 15.4±0.7 |
| Ct.En.Pm (mm) | 12.1±1.3 | 12.0±1.3 | 10.7±1.1 | 10.8±0.9 |
| pMOI (mm4) | 17.9±3.9 | 19.2±4.1 | 16.8±3.1 | 17.3±2.7 |
| Ct.Po | 8.4±2.1% | 9.2±1.6% | 7.0±1.0% | 7.2±2.7% |
3.4 Resorption Markers and Bone Histomorphometry
The anti-resorptive effect of ALN treatment was confirmed by quantifying serum TRAP, Oc.N/BS, and Oc.S/BS. TRAP content was 69% less in the ALN treatment group and 83% less in the PTH+ALN group compared to Veh, while the PTH-treated group was 63% greater than the Veh-treated group (Figure 4B). This was confirmed with static histomorphometry where Oc.N/BS for both ALN and PTH+ALN groups were significantly lower than that of the VEH group (by 56% and 42%) and that of the PTH group (by 59% and 46%, Figure 4C). Additionally, a trend toward a significant difference (p=0.07) was found for Oc.S/BS among groups (Figure 4D). Histological analysis indicated that MS/BS was 120% greater in the PTH group and 109% greater in the PTH+ALN group compared to Veh (Figure 4A and 4E). Similarly, MAR was 112% greater in the PTH group, and 80% greater in the PTH+ALN group compared to Veh (Figure 4F). The same trend was observed for BFR/BS, where the PTH and PTH+ALN groups had 344% and 267% greater formation compared to the Veh group (Figure 4G). In contrast, for all variables of new bone formation, MS/BS, MAR, and BFR/BS, the ALN group was not significantly different from Veh (Figure 4E-G).
Figure 4.

(A) Representative calcein labeling in the trabecular bone. (B) ELISA analysis of serum concentration of bone resorption (TRAP) marker, and histology-based measurements of (C) osteoclast number (Oc.N/BS), (D) Osteoclast surface (Oc.S/BS), (E) mineralizing surface (MS/BS), (F) mineral apposition rate (MAR), and (G) bone formation rate (BFR/BS) were compared among Veh, ALN, PTH, and PTH+ALN groups after 12 days of treatment. All bar graphs show mean+SEM. * significant difference between treatment groups; # trend difference (p<0.1) between treatment groups.
4. Discussion
This study demonstrated an additive effect of combined PTH and bisphosphonate therapy on bone, as well as the structural mechanism through which this additive effect is achieved. Despite the seemingly short duration of the current study, meaningful changes were observed in all treatment groups within 12 days, with evidence of new bone formation observed in both PTH and PTH+ALN groups after only 4 days of treatment. After 12 days of treatment, the combined therapy group displayed a higher BV/TV than PTH monotherapy, driven largely by a preferential increase in plate-like structures. Moreover, the improvement in mineralizing surface, mineral apposition rate, and bone formation rate due to PTH are consistent with clinical data [27]. In addition to these benefits, combined treatment also had the added effect of suppressed bone resorption. The current findings suggest that combined therapy should be considered as a viable treatment option for osteoporosis.
Despite the inconsistent results in the literature [7–16], four recent clinical trials confirmed the additive effect of anti-resorptives and PTH therapies [11, 12, 15, 16]. In these trials, efforts were made to vary the bisphosphonate co-treatment in ways to optimize the anabolic effects of PTH. Cosman et al., [11] utilized zoledronic acid, administered only once prior to one year of PTH treatment. They concluded that when minimizing the administration frequency of the anti-resorptives, a beneficial increase in BMD, beyond that of PTH mono-treatment, occurred at the spine and hip after 13 weeks of treatment. Similarly, Muschitz et al. [12] added alendronic acid to ongoing PTH mono-treatment, and found that this effectively re-opened the anabolic window of PTH. Tsai et al. [15] reported a clinical trial combining denosumab, a potent osteoclast inhibitor, with PTH therapy, and found an additive increase in BMD at the spine, hip, and femoral neck due to combined therapy. Schafer et al. [16] varied the dose of ibandronate with PTH(1–84) either for sequential dosing, or concurrent dosing, and saw that both treatment regimes resulted in increased trabecular BMD and thickness. In addition, many animal studies have found an additive effect of PTH and anti-resorptives from various study designs [18–21, 24, 25]. Taken together, these studies imply that PTH has the ability to induce bone formation without prior bone resorption in both rodent and clinical models.
The current study utilized new, cutting-edge technology to obtain the highest possible in vivo temporal and spatial resolution to explicitly examine the structural effects of combined therapy on trabecular bone. A strong additive effect of combined therapy beyond that of PTH and ALN mono-treatment was identified via the BV/TV. Though a similar amount of new bone formation due to thickening was observed in both PTH and PTH+ALN groups, bone formation appeared to be more directed towards plate formation in the PTH+ALN group. This was suggested by the SMI, a measure providing an indication of plate or rod-like structures via indirect measures of trabecular concavity. Additionally, ITS analysis allowed us to explicitly quantify the increase in plate number and decrease in rod number that occurred while the total Tb.N reflected no net change. Though all three treatments followed this trend, the effect was most pronounced in the combined therapy group. While rods still play a role in transverse support, plates bear the majority of the axial load, and thus, are beneficial for overall structural competence [35–37, 41, 42]. The Conn.D by standard microstructural measurements significantly decreased over time in PTH and PTH+ALN group. Such results are counterintuitive because the integrity of trabecular network, i.e., increased trabecular connectivity, is an important indication of improved bone quality. However, the traditional Conn.D measurement has its limitation: the filling of perforated trabecular plates actually decreases the Conn.D [43]. Therefore, decreased Conn.D may indicate the significant structural enhancement by thickening the ring-like trabecular rods and eventually filling the perforation, which is consistent with the conversion of rod- to plate-like structure as indicated by the ITS results.
While this study was the first to show in vivo improvements in specific microstructural components due to PTH and combined treatment, it did have several limitations. The rats used in this experiment were 3 months old, meaning that they were skeletally mature, but still growing. The active growth of these rats may have predisposed them to more new bone formation than an older or osteoporotic rat. Extended even further, this may have afforded these rats a greater capacity for resorption-independent bone formation. Since the growth plate of a rat never fully closes, this model is often criticized for inadequately modeling aging in a human population. This study is the first to detect changes, even in healthy normal bone, over only 12 days of treatment, but the results should be confirmed in a model of osteoporotic disease. Since bisphosphonate treatment is the current standard of care for osteoporosis, it is rare to encounter patients without prior bisphosphonate use. Some studies showed that PTH was unable to induce an anabolic effect on patients with prior alendronate treatment [7, 13, 14] while others reported continuous anabolic effect by either adding or switching to PTH [8–12, 15, 16]. Thus, our findings should be further tested to assess the effect of combination therapy with long-term bisphosphonate use.
Despite these limitations, the strong in vivo experimental design utilized in this study was sensitive to small changes in very precise trabecular structures, providing new insight to the microstructural mechanisms involved in each treatment. The changes observed in this study were far greater than the precision of the measure which was determined in our previous study [44], adding certainty to the observed results. Using the same data from the study end-point in a cross-sectional manner, a basic, one-way ANOVA revealed no differences between PTH mono-treatment and PTH+ALN combined treatment. Thus, the in vivo, longitudinal design of this experiment, combined with the ability to account for group differences at baseline, allowed for a much more sensitive statistical design. This study was also the first to look at the immediate changes in bone due to PTH or bisphosphonate treatment. In addition, the ITS analysis allowed a precise comparison of individual trabecular types over time. This is a critical tool for comparing the resulting mechanical function of bone due to different drug therapies.
Overall, combined PTH and ALN treatments were found to provide an additive effect beyond that of PTH or ALN mono-treatment in skeletally mature rats. This additive effect was due to a preferential increase in trabecular plates. Bone formation was observed while osteoclast action was inhibited, implying that the anabolic effect of PTH is, at least partially, independent of resorption. These preliminary findings in a rodent model suggest that the implementation of combined treatment in osteoporotic patients may help to reverse rapid skeletal degradation. This study shows the importance of well controlled in vivo study designs to elucidate the unique mechanisms associated with different drug treatments.
Acknowledgments
This study was partially supported by McCabe Pilot Award (to XSL), Penn Center for Musculoskeletal Disorders (NIH/NIAMS P30-AR050950), ASBMR Junior Faculty Osteoporosis Basic Research Award (to LQ), NIH/NIDDK R01-DK09580301 (to LQ), and NIH/NIAMS T32-AR007132 (to CMJdB).
Footnotes
Conflict of Interest:
No authors have conflicts of interest or disclosures to report
Publisher's Disclaimer: This is a PDF file of an unedited manuscript that has been accepted for publication. As a service to our customers we are providing this early version of the manuscript. The manuscript will undergo copyediting, typesetting, and review of the resulting proof before it is published in its final citable form. Please note that during the production process errors may be discovered which could affect the content, and all legal disclaimers that apply to the journal pertain.
Contributor Information
Allison R. Altman, Email: alaltman@mail.med.upenn.edu.
Wei-Ju Tseng, Email: weits@mail.med.upenn.edu.
Chantal M. J. de Bakker, Email: chantald@seas.upenn.edu.
Beom Kang Huh, Email: bhuh@seas.upenn.edu.
Abhishek Chandra, Email: abhic@mail.med.upenn.edu.
Ling Qin, Email: qinling@mail.med.upenn.edu.
X. Sherry Liu, Email: xiaoweil@mail.med.upenn.edu.
References
- 1.Liberman UA, Weiss SR, Broll J, Minne HW, Quan H, Bell NH, Rodriguez-Portales J, Downs RW, Jr, Dequeker J, Favus M. Effect of oral alendronate on bone mineral density and the incidence of fractures in postmenopausal osteoporosis. The Alendronate Phase III Osteoporosis Treatment Study Group. N Engl J Med. 1995;333:1437–43. doi: 10.1056/NEJM199511303332201. [DOI] [PubMed] [Google Scholar]
- 2.Rodan GA, Fleisch HA. Bisphosphonates: mechanisms of action. J Clin Invest. 1996;97:2692–6. doi: 10.1172/JCI118722. [DOI] [PMC free article] [PubMed] [Google Scholar]
- 3.Qin L, Raggatt LJ, Partridge NC. Parathyroid hormone: a double-edged sword for bone metabolism. Trends Endocrinol Metab. 2004;15:60–5. doi: 10.1016/j.tem.2004.01.006. [DOI] [PubMed] [Google Scholar]
- 4.Goltzman D. Studies on the mechanisms of the skeletal anabolic action of endogenous and exogenous parathyroid hormone. Arch Biochem Biophys. 2008;473:218–24. doi: 10.1016/j.abb.2008.03.003. [DOI] [PubMed] [Google Scholar]
- 5.Datta NS, Abou-Samra AB. PTH and PTHrP signaling in osteoblasts. Cell Signal. 2009;21:1245–54. doi: 10.1016/j.cellsig.2009.02.012. [DOI] [PMC free article] [PubMed] [Google Scholar]
- 6.Jilka RL. Molecular and cellular mechanisms of the anabolic effect of intermittent PTH. Bone. 2007;40:1434–46. doi: 10.1016/j.bone.2007.03.017. [DOI] [PMC free article] [PubMed] [Google Scholar]
- 7.Black DM, Greenspan SL, Ensrud KE, Palermo L, McGowan JA, Lang TF, Garnero P, Bouxsein ML, Bilezikian JP, Rosen CJ. The effects of parathyroid hormone and alendronate alone or in combination in postmenopausal osteoporosis. N Engl J Med. 2003;349:1207–15. doi: 10.1056/NEJMoa031975. [DOI] [PubMed] [Google Scholar]
- 8.Cosman F, Nieves J, Zion M, Woelfert L, Luckey M, Lindsay R. Daily and cyclic parathyroid hormone in women receiving alendronate. N Engl J Med. 2005;353:566–75. doi: 10.1056/NEJMoa050157. [DOI] [PubMed] [Google Scholar]
- 9.Cosman F, Wermers RA, Recknor C, Mauck KF, Xie L, Glass EV, Krege JH. Effects of teriparatide in postmenopausal women with osteoporosis on prior alendronate or raloxifene: differences between stopping and continuing the antiresorptive agent. J Clin Endocrinol Metab. 2009;94:3772–80. doi: 10.1210/jc.2008-2719. [DOI] [PubMed] [Google Scholar]
- 10.Cosman F, Keaveny TM, Kopperdahl D, Wermers RA, Wan X, Krohn KD, Krege JH. Hip and spine strength effects of adding versus switching to teriparatide in postmenopausal women with osteoporosis treated with prior alendronate or raloxifene. J Bone Miner Res. 2013;28:1328–36. doi: 10.1002/jbmr.1853. [DOI] [PubMed] [Google Scholar]
- 11.Cosman F, Eriksen EF, Recknor C, Miller PD, Guanabens N, Kasperk C, Papanastasiou P, Readie A, Rao H, Gasser JA, Bucci-Rechtweg C, Boonen S. Effects of intravenous zoledronic acid plus subcutaneous teriparatide [rhPTH(1–34)] in postmenopausal osteoporosis. J Bone Miner Res. 2011;26:503–11. doi: 10.1002/jbmr.238. [DOI] [PubMed] [Google Scholar]
- 12.Muschitz C, Kocijan R, Fahrleitner-Pammer A, Lung S, Resch H. Antiresorptives overlapping ongoing teriparatide treatment result in additional increases in bone mineral density. J Bone Miner Res. 2013;28:196–205. doi: 10.1002/jbmr.1716. [DOI] [PubMed] [Google Scholar]
- 13.Finkelstein JS, Hayes A, Hunzelman JL, Wyland JJ, Lee H, Neer RM. The effects of parathyroid hormone, alendronate, or both in men with osteoporosis. N Engl J Med. 2003;349:1216–26. doi: 10.1056/NEJMoa035725. [DOI] [PubMed] [Google Scholar]
- 14.Finkelstein JS, Wyland JJ, Lee H, Neer RM. Effects of teriparatide, alendronate, or both in women with postmenopausal osteoporosis. J Clin Endocrinol Metab. 2010;95:1838–45. doi: 10.1210/jc.2009-1703. [DOI] [PMC free article] [PubMed] [Google Scholar]
- 15.Tsai JN, Uihlein AV, Lee H, Kumbhani R, Siwila-Sackman E, McKay EA, Burnett-Bowie SA, Neer RM, Leder BZ. Teriparatide and denosumab, alone or combined, in women with postmenopausal osteoporosis: the DATA study randomised trial. Lancet. 2013;382:50–6. doi: 10.1016/S0140-6736(13)60856-9. [DOI] [PMC free article] [PubMed] [Google Scholar]
- 16.Schafer AL, Burghardt AJ, Sellmeyer DE, Palermo L, Shoback DM, Majumdar S, Black DM. Postmenopausal women treated with combination parathyroid hormone (1–84) and ibandronate demonstrate different microstructural changes at the radius vs. tibia: the PTH and Ibandronate Combination Study (PICS) Osteoporos Int. 2013 doi: 10.1007/s00198-013-2349-y. [DOI] [PubMed] [Google Scholar]
- 17.Wu X, Pang L, Lei W, Lu W, Li J, Li Z, Frassica FJ, Chen X, Wan M, Cao X. Inhibition of Sca-1-positive skeletal stem cell recruitment by alendronate blunts the anabolic effects of parathyroid hormone on bone remodeling. Cell Stem Cell. 2010;7:571–80. doi: 10.1016/j.stem.2010.09.012. [DOI] [PMC free article] [PubMed] [Google Scholar]
- 18.Kostenuik PJ, Capparelli C, Morony S, Adamu S, Shimamoto G, Shen V, Lacey DL, Dunstan CR. OPG and PTH-(1–34) have additive effects on bone density and mechanical strength in osteopenic ovariectomized rats. Endocrinology. 2001;142:4295–304. doi: 10.1210/endo.142.10.8437. [DOI] [PubMed] [Google Scholar]
- 19.Yang X, Muthukumaran P, DasDe S, Teoh SH, Choi H, Lim SK, Lee T. Positive alterations of viscoelastic and geometric properties in ovariectomized rat femurs with concurrent administration of ibandronate and PTH. Bone. 2013;52:308–17. doi: 10.1016/j.bone.2012.09.039. [DOI] [PubMed] [Google Scholar]
- 20.Jilka RL, O'Brien CA, Bartell SM, Weinstein RS, Manolagas SC. Continuous elevation of PTH increases the number of osteoblasts via both osteoclast-dependent and -independent mechanisms. J Bone Miner Res. 2010;25:2427–37. doi: 10.1002/jbmr.145. [DOI] [PMC free article] [PubMed] [Google Scholar]
- 21.Pierroz DD, Bonnet N, Baldock PA, Ominsky MS, Stolina M, Kostenuik PJ, Ferrari SL. Are osteoclasts needed for the bone anabolic response to parathyroid hormone? A study of intermittent parathyroid hormone with denosumab or alendronate in knock-in mice expressing humanized RANKL. J Biol Chem. 2010;285:28164–73. doi: 10.1074/jbc.M110.101964. [DOI] [PMC free article] [PubMed] [Google Scholar]
- 22.Henriksen K, Neutzsky-Wulff AV, Bonewald LF, Karsdal MA. Local communication on and within bone controls bone remodeling. Bone. 2009;44:1026–33. doi: 10.1016/j.bone.2009.03.671. [DOI] [PubMed] [Google Scholar]
- 23.Samadfam R, Xia Q, Goltzman D. Pretreatment with anticatabolic agents blunts but does not eliminate the skeletal anabolic response to parathyroid hormone in oophorectomized mice. Endocrinology. 2007;148:2778–87. doi: 10.1210/en.2006-1475. [DOI] [PubMed] [Google Scholar]
- 24.Samadfam R, Xia Q, Goltzman D. Co-treatment of PTH with osteoprotegerin or alendronate increases its anabolic effect on the skeleton of oophorectomized mice. J Bone Miner Res. 2007;22:55–63. doi: 10.1359/jbmr.060915. [DOI] [PubMed] [Google Scholar]
- 25.Campbell GM, Bernhardt R, Scharnweber D, Boyd SK. The bone architecture is enhanced with combined PTH and alendronate treatment compared to monotherapy while maintaining the state of surface mineralization in the OVX rat. Bone. 2011;49:225–32. doi: 10.1016/j.bone.2011.04.008. [DOI] [PubMed] [Google Scholar]
- 26.Boyd SK, Davison P, Muller R, Gasser JA. Monitoring individual morphological changes over time in ovariectomized rats by in vivo micro-computed tomography. Bone. 2006;39:854–62. doi: 10.1016/j.bone.2006.04.017. [DOI] [PubMed] [Google Scholar]
- 27.Lindsay R, Zhou H, Cosman F, Nieves J, Dempster DW, Hodsman AB. Effects of a one-month treatment with PTH(1–34) on bone formation on cancellous, endocortical, and periosteal surfaces of the human ilium. J Bone Miner Res. 2007;22:495–502. doi: 10.1359/jbmr.070104. [DOI] [PubMed] [Google Scholar]
- 28.Gunness-Hey M, Hock JM. Increased trabecular bone mass in rats treated with human synthetic parathyroid hormone. Metab Bone Dis Relat Res. 1984;5:177–81. doi: 10.1016/0221-8747(84)90026-2. [DOI] [PubMed] [Google Scholar]
- 29.Lane NE, Kimmel DB, Nilsson MH, Cohen FE, Newton S, Nissenson RA, Strewler GJ. Bone-selective analogs of human PTH(1–34) increase bone formation in an ovariectomized rat model. J Bone Miner Res. 1996;11:614–25. doi: 10.1002/jbmr.5650110509. [DOI] [PubMed] [Google Scholar]
- 30.Chandra A, Lan S, Zhu J, Lin T, Zhang X, Siclari VA, Altman AR, Cengel KA, Liu XS, Qin L. PTH prevents the adverse effects of focal radiation on bone architecture in young rats. Bone. 2013;55:449–57. doi: 10.1016/j.bone.2013.02.023. [DOI] [PMC free article] [PubMed] [Google Scholar]
- 31.Viola P, Wells WM., III Alignment by maximization of mutual information. Int J Comput Vis. 1997;24:137–54. [Google Scholar]
- 32.Collignon A, Maes F, Delaere D, Vandermeulen D, Suetens P, Marchal G. Automated multi-modality image registration based on information theory. In: Bizais Y, Barillot C, di Paola R, editors. Information Processing in Medical Imaging. Kluwer Academic Publishers; Dordrecht, The Netherlands: 1995. pp. 263–274. [Google Scholar]
- 33.Ibanez L, Schroeder W, Ng L, Cates J. [Accessed December 5, 2008];The ITK Software Guide. (2). 2005 Available at http://www.itk.org/ItkSoftwareGuide.pdf.
- 34.Lan S, Luo S, Huh BK, Chandra A, Altman AR, Qin L, Liu XS. 3D image registration is critical to ensure accurate detection of longitudinal changes in trabecular bone density, microstructure, and stiffness measurements in rat tibiae by in vivo microcomputed tomography (μCT) Bone. 2013;56:83–90. doi: 10.1016/j.bone.2013.05.014. [DOI] [PMC free article] [PubMed] [Google Scholar]
- 35.Liu XS, Sajda P, Saha PK, Wehrli FW, Bevill G, Keaveny TM, Guo XE. Complete volumetric decomposition of individual trabecular plates and rods and its morphological correlations with anisotropic elastic moduli in human trabecular bone. J Bone Miner Res. 2008;23:223–35. doi: 10.1359/JBMR.071009. [DOI] [PMC free article] [PubMed] [Google Scholar]
- 36.Liu XS, Sajda P, Saha PK, Wehrli FW, Guo XE. Quantification of the roles of trabecular microarchitecture and trabecular type in determining the elastic modulus of human trabecular bone. J Bone Miner Res. 2006;21:1608–17. doi: 10.1359/jbmr.060716. [DOI] [PMC free article] [PubMed] [Google Scholar]
- 37.Liu XS, Zhang XH, Sekhon KK, Adams MF, McMahon DJ, Bilezikian JP, Shane E, Guo XE. High–resolution peripheral quantitative computed tomography can assess microstructural and mechanical properties of human distal tibial bone. J Bone Miner Res. 2010;25:746–56. doi: 10.1359/jbmr.090822. [DOI] [PMC free article] [PubMed] [Google Scholar]
- 38.Guo XE, Goldstein SA. Is trabecular bone tissue different from cortical bone tissue? Forma. 1997;12:185–96. [Google Scholar]
- 39.Hollister SJ, Brennan JM, Kikuchi N. A homogenization sampling procedure for calculating trabecular bone effective stiffness and tissue level stress. J Biomech. 1994;27:433–44. doi: 10.1016/0021-9290(94)90019-1. [DOI] [PubMed] [Google Scholar]
- 40.Parfitt AM, Drezner MK, Glorieux FH, Kanis JA, Malluche H, Meunier PJ, Ott SM, Recker RR. Bone histomorphometry: standardization of nomenclature, symbols, and units. Report of the ASBMR Histomorphometry Nomenclature Committee. J Bone Miner Res. 1987;2:595–610. doi: 10.1002/jbmr.5650020617. [DOI] [PubMed] [Google Scholar]
- 41.Shi X, Liu XS, Wang X, Guo XE, Niebur GL. Type and orientation of yielded trabeculae during overloading of trabecular bone along orthogonal directions. J Biomech. 2010;43:2460–6. doi: 10.1016/j.jbiomech.2010.05.032. [DOI] [PMC free article] [PubMed] [Google Scholar]
- 42.Shi X, Liu XS, Wang X, Guo XE, Niebur GL. Effects of trabecular type and orientation on microdamage susceptibility in trabecular bone. Bone. 2010;46:1260–6. doi: 10.1016/j.bone.2010.02.005. [DOI] [PMC free article] [PubMed] [Google Scholar]
- 43.Kinney JH, Ladd AJ. The relationship between three-dimensional connectivity and the elastic properties of trabecular bone. Journal of Bone & Mineral Research. 1998;13:839–45. doi: 10.1359/jbmr.1998.13.5.839. [DOI] [PubMed] [Google Scholar]
- 44.Lan S, Luo S, Huh BK, Chandra A, Altman AR, Qin L, Liu XS. 3D image registration is critical to ensure accurate detection of longitudinal changes in trabecular bone density, microstructure, and stiffness measurements in rat tibiae by in vivo micro computed tomography (μCT) Bone. 2013;56:83–90. doi: 10.1016/j.bone.2013.05.014. [DOI] [PMC free article] [PubMed] [Google Scholar]