

Abstract
Objective
Resin-based composites are used for many applications in dentistry. They are difficult to remove without damage to the underlying enamel since they adhere strongly and are color matched to the tooth. The objective of this study was to determine if an automated laser scanning system with spectral feedback could be used for selective removal of residual orthodontic composite from tooth surfaces with minimal damage to the underlying enamel.
Materials and methods
A CO2 laser operating at a wavelength of 9.3 μm with a pulse duration of 10–15 μs and a pulse repetition rate of ~200 Hz was used to selectively remove composite from the buccal surfaces of extracted teeth. A spectral feedback system utilizing a miniature spectrometer was used to control the laser scanning system. Pulpal temperature measurements were performed during composite removal to determine if there was excessive heat accumulation. Conventional and digital microscopes were used to assess the amount of enamel lost during removal.
Results
The amount of enamel lost averaged between 20 and 25 μm for irradiation intensities from 3.8 to 4.2 J/cm2, respectively. An average maximum temperature rise of 1.9±1.5°C was recorded, with no teeth approaching the critical value of 5.5°C. The average time for composite removal from an area of 5 mm2 was 19.3±4.1 s, fast enough for clinical feasibility.
Conclusion
Residual composite can be rapidly removed from tooth surfaces using a CO2 laser with spectral feedback, with minimal temperature rise within the pulp and with minimal loss of sound enamel.
Keywords: carbon dioxide laser, composite removal, laser ablation
1 Introduction
Dental composites and glass ionomers are used as restorative materials for filling cavities and filling, shaping and covering teeth for esthetic purposes, and as adhesives. Dentists spend more time replacing existing restorations that fail due to microleakage and secondary caries than they do placing new restorations [1, 2]. Tooth-colored restorations are difficult to differentiate from the surrounding tooth structure and adhere strongly to the underlying enamel and dentin making them challenging to remove without damaging tooth structure. Hence, the clinician frequently removes excessive amounts of healthy tooth structure to ensure complete removal of the composite [3, 4]. Therefore, a system that can rapidly and selectively remove composite from tooth surfaces while minimizing the inadvertent removal of healthy tooth structure would be a significant improvement over current methods.
Composite-based resins are used to attach orthodontic brackets to tooth surfaces and it is difficult to remove the residual composite left on the tooth surface after bracket debonding. A wide variety of modalities have been recommended for the removal of residual composite, including high-speed and low-speed handpiece attachments, for example tungsten carbide burs, polishing discs and points, and rubber cups and polishers [4–7]. Iatrogenic sequelae associated with the use of high-speed and low-speed handpieces include variable enamel scratches and loss, incomplete removal of composite and excessive heat accumulation. Studies of the removal of residual composite with carbide burs are highly variable and a mean loss in excess of 50 μm has been reported [8–10]. Moreover, excessive heat accumulation during removal with the handpiece can occur [11].
One approach to debonding esthetic ceramic brackets is to use laser energy to thermally degrade the adhesive resin with the bracket still in place [12]. However, such an approach may excessively heat up the entire tooth and residual composite may still remain on tooth surfaces. Another laser-based approach is to selectively ablate residual composite from tooth surfaces. Previous studies have shown that high ablation selectivity can be achieved using laser pulses at λ=355 nm of nanosecond duration [13–15]. However, the frequency-tripled Nd:YAG laser is poorly suited for the removal of sound and demineralized dental hard tissues and utilizes UV radiation. It is safer and more economical to utilize a laser that can be used for multiple applications. Carbon dioxide (CO2) lasers, which have been used extensively for decades for soft tissue surgery, have also been advocated for use in caries removal and caries prevention due to their high absorption by carbonated apatite in dental enamel and have recently received approval of the Food and Drug Administration for use on hard tissues. Enamel absorption is 5–6 times higher at 9.3 and 9.6 μm than the more commonly used 10.6-μm wavelength which allows more efficient heating and ablation of dental hard tissues [16]. Therefore, a pulsed CO2 laser operating at 9.3 μm is well suited for caries removal. Moreover, the underlying enamel will be modified to a more acid resistant phase after composite removal [17–22].
The pulsed CO2 laser can also be used to ablate composite selectively if spectral feedback is employed [23]. During laser ablation, a luminous emission plume is produced that is unique to each tissue or material. The luminous plume generated during hard tissue ablation by the CO2 laser consists of electronically excited atoms, ions and molecules ejected from the site of ablation. The plume can be spectrally interrogated to reveal the chemical composition of the ablated material as described in previous studies [23–25]. In previous studies, we were able to show that distinctive high intensity calcium emission lines can be used to differentiate between the ablation of composite and dental hard tissues at several laser wavelengths [23–25]. Individual peaks can be identified with wavelength tables of elemental spectra [26]. Therefore, it is possible to differentiate enamel and composite spectra by their distinct component peaks. Dumore and Fried [25] showed that the plume emission spectrum acquired during the laser ablation of dental enamel possesses distinct calcium emission lines that are strong between 580 and 650 nm, giving the plume a distinct red appearance. This region is lacking in composite resin and its fillers, and can thus be used to differentiate enamel from composite.
We demonstrated that composite can be selectively removed from tooth buccal and occlusal surfaces at clinically relevant rates using a CO2 laser operating at 9.3 μm with high pulse repetition rates with minimal heat deposition [23]. The selective removal of composite from the smooth buccal surfaces is more challenging than removing composite from other tooth surfaces since it is particularly important to minimize enamel loss from these highly visible tooth surfaces for esthetic reasons. The objective of this study was to analyze the enamel surface damage produced during the removal of residual orthodontic composite from tooth buccal surfaces.
2 Materials and methods
2.1 Tooth samples
Twenty-six premolars and molars were collected from patients in the San Francisco Bay Area and sterilized with gamma radiation. Eleven teeth with the roots intact were used for the measurements of heat accumulation and the time required for removal as described in section 2.5 (Group #1). The roots were removed from the remaining 15 teeth and the crowns were sectioned into buccal and lingual halves and these 30 tooth halves were divided into Groups #2 and #3 that were used for the measurements of enamel loss and volume of composite/enamel removed as described in section 2.6.
Orthodontic brackets were bonded to the buccal or lingual surfaces of twenty of these tooth halves (Group #2) with Grengloo™ (Ormco, Orange, CA, USA) composite, Ortho Solo™ (Ormco) adhesive, and 37% phosphoric acid etchant according to the manufacturer’s instructions. Grengloo™ composite changes color and appears green below body temperature. This helps to identify any residual composite missed by the laser. It also has similar composition to other composites. The brackets were mechanically debonded leaving the residual composite.
For the remaining 10 tooth halves (Group #3), tooth surfaces were ground flat using an 800-grit polishing wheel and a thick layer of composite was applied to the flat surfaces; orthodontic brackets were not bonded to the surfaces.
2.2 Laser system
The CO2 laser used in this study was an IMPACT® 2500 (GSI Lumonics, Rugby, UK) operating at a wavelength of 9.3 μm. The laser was custom-modified to produce a Gaussian output beam (single spatial mode) and a pulse duration of between 10 and 15 μs. The laser was operated at a pulse repetition rate of ~220 Hz, with a spot size of ~750 μm and a 150-μm overlap between laser spots for the experiments described in sections 2.5 and 2.6. The tooth was cooled with a low volume/low pressure air-actuated fluid spray delivery system that provided a pulsed uniform mist at a rate of 0.5 ml/min at room temperature. The water spray was pulsed with a frequency of 0.5 Hz for a delivery rate of 10 ml/s over an area of 5 cm2. The laser irradiation intensities are indicated in the text as the fluence for single incident laser pulses (not accumulated over multiple pulses) was varied using CaF2 attenuators of thickness ranging from 1 to 20 mm.
2.3 Computer-controlled laser scanning system with spectral feedback
Computer-controlled XY galvanometers 6200HM series with MicroMax Series 671 from Cambridge Technology, Inc. were used to scan the laser beam over sample surfaces. A laser spot size of 750 μm was used with a spot-to-spot separation of 150 μm.
The plume produced from laser irradiation of each spot was captured using a USB2000+ fiber optic spectrometer (Ocean Optics, Dunedin, FL, USA) incorporating a 2048-element CCD detector that was used in conjunction with a 1-mm bare silica-fiber to acquire spectra as previously described [23]. Distinct calcium emission lines only present in enamel were used to differentiate between the ablation of enamel and composite. Both composite and enamel spectra contain the strong sodium D-emission line near 580 nm. The composite spectrum is similar to the emission spectrum of ablated glass and quartz [24]. Dental hard tissues have a very strong emission line centered at 605 nm. The ratio and intensities of the 580 and 605-nm peaks were used to differentiate between composite and enamel.
A flow chart describing the algorithm used to remove the composite is shown in Figure 1 and it is described in greater detail in [23]. The laser beam was scanned from point to point over a matrix defining a specific area. The plume emission ratio from each irradiated spot was subsequently used to determine if that spot was enamel or composite and a new matrix was generated defining the area of composite to be removed in the following scan. This process was repeated until all the composite was removed. A final “clean-up” scan was carried out along the margin of composite determined from analysis of the plume emission acquired from the initial scan to remove residual composite at the perimeter.
Figure 1.
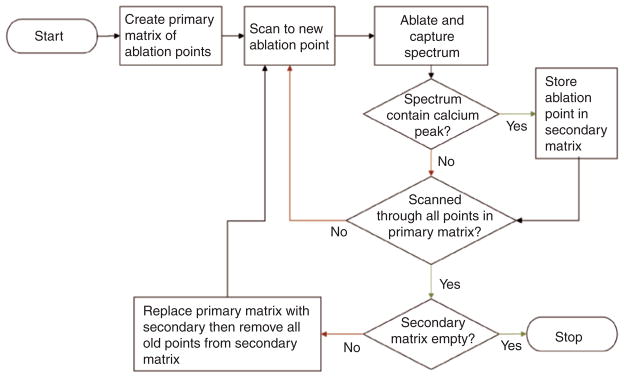
Flowchart describing the steps involved in selective ablation.
2.4 Composite ablation rate measurements
The ablation rate for Grengloo™ composite was measured and compared with previous measurements of enamel from [23] at varying irradiation intensities in order to select the optimal incident laser fluence for removal. Disks, 1–2 mm thick of cured Grengloo™ (Ormco) composite were prepared using a diamond saw (Isomet 5000; Buehler, Lake Bluff, IL, USA). The incident fluence was varied from 0 to 20 J/cm2 and the laser spot size was maintained at 450 μm. The laser beam was scanned in a rectangular pattern over an area roughly 3.6×1.5 mm with each laser spot separated by 150 μm. There were three scans for each of the 15 irradiation intensities investigated. Optical coherence tomography (OCT) was used to measure the mean depth per scan [23]. The same procedure was used previously to determine the rate of ablation of a more conventional Z250 composite (3M, Minneapolis, MN, USA) and dental enamel [23].
2.5 Measurements of heat accumulation and the time required for removal (Group #1)
Eleven extracted human premolars and molars with the roots intact were used for thermocouple measurements (Group #1). The roots were left on each tooth and a small hole was drilled into tooth mesial or distal surfaces at the level of the cement-enamel junction using a high-speed dental handpiece with a carbide bur (Model 1169L; Miltex, York, PA, USA). Microthermocouples (K type, 36 G; Omega Engineering Inc, Stamford, CT, USA) were inserted into the pulp chamber of each tooth. The laser ablation setup is shown Figure 2 indicating the relative position of the thermocouple in the tooth and the composite on the tooth buccal surface. A high thermal conductivity silicone paste (OMEGATHERM® 201, Omega) was used to ensure good thermal contact with the tooth. Digital periapical films were taken to verify the position of the thermocouple. Computer-controlled galvanometers scanned the laser beam to remove all residual orthodontic composite from the tooth surface in a 5×5 mm2 matrix. A thermocouple controller (Model SR630; Stanford Research Systems, Sunnyvale, CA, USA) was used to record the thermal data. The teeth were irradiated using a fluence of 3.8 J/cm2, and a water spray at room temperature was used. A temperature rise of >5.5°C was considered the threshold for risk of pulpal inflammation [27]. The time taken to ablate all residual composite on the tooth surface was recorded, as well as the temperature change from the initial temperature to the maximum temperature recorded before and after the removal process. Similar temporal profiles to those observed during composite removal from tooth occlusal surfaces were recorded [23], namely the temperature initially dropped a few degrees due to the cooling effect of the water spray and subsequently rose a few degrees as heat accumulated in the tooth to peak when removal was completed.
Figure 2.

The experimental setup for selective ablation is shown with (A) XY galvanometers, (B) water spray, (C) microthermocouple, (D) CO2 laser beam, (E) composite on tooth buccal surface, (F) mounted tooth, (G) ZnSe f-theta scanning lens, and (H) imaging optics for spectrometer.
2.6 Measurements of enamel loss and volume of composite/enamel removed (Groups #2 and #3)
The twenty samples (tooth halves) of Group #2 were further subdivided into two groups of 10 and irradiated at either 3.8 J/cm2 (Group #2a) or 4.2 J/cm2 (Group #2b). Two irradiation intensities were used to assess how sensitive the enamel loss is to slight variations in the incident fluence. Half of the residual composite was removed in a rectangular matrix of about 2.5×5 mm2 with the laser removal program leaving half of the residual composite intact.
After composite removal by the laser, the enamel surfaces of Group #2 were analyzed with a Leitz Secolux microscope (Leica, Solms, Germany) with a magnification of 50–1000×. Damage to the enamel surface appeared as a roughening of enamel. The greatest enamel loss appears to have occurred at the center of each crater left by individual laser pulses. Enamel loss was assessed by measuring the vertical deviation near the center of each overlapping crater by scanning the image plane of a conventional microscope. A digital micrometer was seated on the microscope platform to measure the change in platform height as the microscope was manually focused on the surface and at the base of the deeper craters. Five of the deeper crater areas were measured per sample, and the mean±standard deviation (SD) is reported.
The 20 samples of Group #2 were also visually evaluated by two observers without magnification. Teeth were categorized into four groups based on the degree of texture on the enamel surface (roughening) after laser ablation of all 20 samples (1–minimal, 2–slight, 3–moderate, 4–severe). Six of the twenty teeth were further polished after laser irradiation. Three were polished with Renew Finishing System Points #383 on a high-speed handpiece and three were polished with prophy cups and prophy paste on a slow-speed handpiece. The teeth were then evaluated under the microscope and photographed.
The 10 samples (tooth halves) of Group #3 with composite placed on the flat surfaces were irradiated with a fluence of 4.0 J/cm2. All the composite was removed by scanning a 4-mm2 area with the laser removal program. Surfaces were evaluated using the VHX-1000 optical microscopy/3D surface profilometry system. Two lenses were used, the VH-Z25 with a magnification from 25 to 175× and the VH-Z100R with a magnification of 100–1000×. 3-D images of the samples were acquired before and after ablation at 1000× and 175× magnification. Images at different focus positions are rapidly acquired by scanning the z-axis stage and algorithms are used to generate a depth composition image (fully focused images) with all points of the image in focus or a 3-D image can be generated. The Keyence 3-D shape measurement software, VHX-H3M, was used to correct the tilt of the sample and measure the variation in depth over the enamel in the post-ablated composite area. This software provided 2-D profiles of the surface variation which were used to calculate the mean vertical deviation in the surface and the surface roughness. The mean vertical deviation was calculated by measuring the mean depths of five craters. The Keyence software was also used to calculate the root mean squared (RMS) roughness of the irradiated enamel surface.
Since the Keyence microscope acquires 3-D images it is possible to determine the volume of composite removed by subtracting the 3-D images taken before and after removal of the composite. Each image was acquired at 175× magnification and contained 1437×1965 pixels, i.e., ~1.5 mm×2 mm. The non-irradiated enamel edges on the flat ground surfaces were used as a reference for each 3-D image.
2.7 Statistical analysis
All statistical analysis was carried out using Prism or Instat software (Graphpad Software, La Jolla, CA, USA). A t-test was used to compare the mean vertical deviation of the craters on the laser irradiated surfaces at the two different irradiation intensities, Groups #2a and #2b, to determine if they were significantly different (p<0.05). Linear regression was used to compare the measured vertical deviation values to the subjective visual scores (1–4) for Group #2. The Pearson correlation coefficient was calculated and a t-test was used to determine if the slope was significantly different from zero (p<0.05).
3 Results
3.1 Composite ablation rate measurements
The measured relationship between ablation rate and fluence is shown in Figure 3, and is very similar to Z250 composite [23]. The composite ablation rate increased progressively with increasing fluence, whereas the enamel ablation rate peaked at about 20 μm/scan above approximately 8 J/cm2. The ideal fluence appears to be around 4 J/cm2, where the rate of composite removal is twice that of enamel while the enamel loss is reduced to a depth of <10 μm. The use of irradiation intensities (fluence) exceeding 4–5 J/cm2 will result in the removal of greater amounts of enamel which may be more selective but the greater damage to enamel is unacceptable on tooth buccal surfaces.
Figure 3.

Mean depth±SD (n=3) for each scanned area for Grengloo™ composite (solid diamonds) and enamel (open circles) as a function of laser fluence. The enamel data is from [23].
3.2 Measurements of heat accumulation and the time required for removal (Group #1)
The maximum temperature excursions at the position of the pulp chamber wall opposite the enamel surfaces irradiated by the laser were measured using microthermocouples. An average maximum temperature rise of 1.9±1.5°C (n=11) was recorded, with none of the measurements approaching the critical value of 5.5°C. The mean time to remove all of the residual composite from the 5-mm2 area was 19.3±4.1 s (n=11).
3.3 Measurements of enamel loss and volume of composite/enamel removed (Groups #2 and #3)
Figure 4 shows teeth from Groups #2a and #2b before and after composite removal. Only half of the composite area under the bracket was irradiated by the laser leaving half the composite untouched. Five of the most severely affected areas on each tooth surface were examined using the Leitz microscope at a magnification of 200×. At a fluence of 3.8 J/cm2 (Group #2a) the maximum vertical deviation averaged 22.7±5.3 μm. The maximum vertical deviation that was measured ranged from 6 to 49 μm. At 4.2 J/cm2 (Group #2b), the maximum vertical deviation averaged 25.3±5.0 μm and the maximum ranged from 11 to 50 μm. There was no significant difference between the maximum vertical deviations for the two groups (t-test, p>0.05).
Figure 4.

Photographs of Grengloo™ composite on buccal surfaces before (A) and after composite placement (B), and after laser ablation (C) for two teeth at a fluence of 3.8 J/cm2 (Tooth#1 – Group #2a) and 4.2 J/cm2 (Tooth#2 – Group #2b).
The visual appearance of all samples in Group #2 were subjectively ranked after composite removal (1–minimal, 2–slight, 3–moderate, 4–severe) as previously described. A plot of the measured vertical deviation values vs. the subjective visual scores (1–4) showed that they were correlated; Pearson R=0.51 (p<0.05). Polishing with the Renew Finishing System Points #383 removed some of the surface texture but gave a highly glossed surface. The irradiated area was not visible after additional polishing, and microscopic evaluation with the Leitz microscope indicated that the mean vertical surface deviation decreased to 17.4±6.6 μm, from 24.8±6.9 μm immediately following laser irradiation for those samples. The use of prophy paste attached to a prophy cup lightly smoothed the surface texture while making the visual evaluation of the tooth surface more favorable. However, the surface roughness was altered less with the prophy paste than with the Renew Polishing points. The mean vertical surface deviation decreased to 19.1±3.2 μm from 21.1±2.1 μm for the samples polished with the prophy paste.
The Group #3 samples with the composite applied to ground flat surfaces (no brackets) were irradiated at a fluence of 4.0 J/cm2. These samples were imaged using the VHX-1000 microscopy/3D surface profilometry system. Both 3-D and depth composition images are presented in Figures 5–7. Figures 5 and 6 show the depth composition and 3-D images at 175× magnification of two of the samples before and after composite removal with RMS surface roughness values of approximately 13 and 20 μm. Each image represents a 1.5×2 mm2 area of the tooth surface. The depth composition image is best suited for showing the surface texture and uniformity while the 3-D image best shows that the composite is uniformly removed leaving a flat surface. Figure 7 shows higher resolution depth composition and 3-D images taken in the area where the composite has been removed.
Figure 5.

Images of one of the Group #3 tooth surfaces before and after composite removal acquired with the VHX-1000 digital microscope at 175× magnification. Images (A) and (C) show depth composition and 3-D images of the region of interest before removal of the composite and images (B) and (D) are the corresponding images after irradiation by the laser. The surface roughness (RMS) was 12.5 μm for the enamel underlying the composite.
Figure 7.

Digital depth composition and 3-D images of the underlying enamel surface at 1000× magnification for the two Group #3 samples shown in Figure 5 (A and C) and Figure 6 (B and D) after laser removal of the composite.
Figure 6.

Images of the surface of another tooth from Group #3 before and after composite removal acquired with the VHX-1000 digital microscope at 175× magnification. Images (A) and (C) show depth composition and 3-D images of the region of interest before removal of the composite and images (B) and (D) are the corresponding images after irradiation by the laser. The surface roughness (RMS) was 19.6 μm for the enamel underlying the composite.
Digital profilometric measurements were also carried out for the Group #3 samples to determine the mean vertical deviation and the roughness (RMS). The RMS was 23±7.7 μm and the mean vertical deviation was 21.4±6.3 μm which is consistent with our values measured using the Leitz microscope for the Group #2 samples. The mean volume of composite that was removed by the laser in a 1.5 mm×2 mm window was 0.23±0.1 mm3.
4 Discussion
The amount of enamel lost during the selective removal of residual orthodontic composite using a CO2 laser with spectral feedback appears to be less than for conventional means for removal using dental low-speed and high-speed handpieces. Most debonding techniques result in some loss of enamel. The degree of enamel loss varies widely in the literature [28]. The thickness of enamel is usually about 1500–2000 μm, and the loss of 60 μm is not thought to be detrimental to the tooth [29]. However, the surface fluoride layer gradient is very steep, with the highest concentration at the surface and a rapid decline in the first 20 μm of enamel [28]. Therefore, it is desirable to preserve as much of the fluoride-rich surface layer of enamel as possible. In this study, the surface roughness and mean vertical deviation (enamel loss) varied from 15 to 30 μm for irradiation intensities of 3.8–4.2 J/cm2. The irradiated enamel surface showed a morphology characteristic of surface melting with wavelike or wormlike structures, as previously described by Zuerlein et al. [30], such surfaces manifest increased resistance to acid dissolution [17–22]. It is important to point out, that it is likely that much of that roughness is caused by the repeated melting and re-crystallization of the enamel during multiple laser pulses and it is possible that very little enamel was actually vaporized and lost during the procedure. It is highly likely that most of the fluoride rich outer layer of enamel is preserved. The enamel surface texture in laser irradiated areas closely resembles the structures of melted and re-crystallized enamel observed previously [30].
The time required for the CO2 laser to remove the residual composite remaining after bracket debonding was <20 s which is less than conventional methods. Ryf et al. [5] reported a total composite removal time of 65.9±14.0 s with two steps and up to 183.5±14.1 s per tooth for four-step procedures. This time was similar to what we reported for the removal of composite from tooth occlusal surfaces in our previous study [23]. The temperature rise was also similar to the rise produced during the irradiation of the occlusal surfaces even though the thermocouples pulp chamber is closer to the tooth surface [23]. The temperature rise was well below the safe level of 5.5°C determined by Zach and Cohen [27].
The digital microscope proved to be extremely valuable for analyzing tooth surfaces before and after laser irradiation. This is the first time this new technology has been used to examine laser-treated tooth surfaces and the depth composition and 3-D images can be used to determine the amount of composite removed from the tooth surface in addition to the surface roughness induced by laser irradiation.
5 Conclusion
Residual orthodontic composite can be selectively removed from the tooth surface using a rapidly scanned CO2 laser with spectral feedback, with a minimal temperature rise within the pulp and acceptable damage to the underlying enamel surface.
Acknowledgments
The authors would like to thank Ormco Corporation for the GrenGloo™ composite, and Hobin Kang, Cynthia Darling and Arthur Miller for their contributions.
Footnotes
Conflict of interest statement: This work was supported by NIH/NIDCR grant RO1-DE19631. None of the authors have any conflict of interest to disclose.
Contributor Information
Kenneth H. Chan, Department of Preventive and Restorative Dental Sciences, University of California, San Francisco, 707 Parnassus Ave., San Francisco, CA 94143, USA
Krista Hirasuna, Department of Orofacial Sciences, University of California, San Francisco, 707 Parnassus Ave., San Francisco, CA 94143, USA.
Daniel Fried, Department of Preventive and Restorative Dental Sciences, University of California, San Francisco, 707 Parnassus Ave., San Francisco, CA 94143, USA.
References
- 1.Gordan VV, Garvan CW, Richman JS, Fellows JL, Rindal DB, Qvist V, Heft MW, Williams OD, Gilbert GH DPBRN Collaborative Group. How dentists diagnose and treat defective restorations: evidence from the dental practice-based research network. Oper Dent. 2009;34(6):664–73. doi: 10.2341/08-131-C. [DOI] [PMC free article] [PubMed] [Google Scholar]
- 2.Bernardo M, Luis H, Martin MD, Leroux BG, Rue T, Leitão J, DeRouen TA. Survival and reasons for failure of amalgam versus composite posterior restorations placed in a randomized clinical trial. J Am Dent Assoc. 2007;138(6):775–83. doi: 10.14219/jada.archive.2007.0265. [DOI] [PubMed] [Google Scholar]
- 3.Oliver RG. The effect of different methods of bracket removal on the amount of residual adhesive. Am J Orthod Dentofacial Orthop. 1988;93(3):196–200. doi: 10.1016/s0889-5406(88)80003-9. [DOI] [PubMed] [Google Scholar]
- 4.Hong YH, Lew KK. Quantitative and qualitative assessment of enamel surface following five composite removal methods after bracket debonding. Eur J Orthod. 1995;17(2):121–8. doi: 10.1093/ejo/17.2.121. [DOI] [PubMed] [Google Scholar]
- 5.Ryf S, Flury S, Palaniappan S, Lussi A, van Meerbeek B, Zimmerli B. Enamel loss and adhesive remnants following bracket removal and various clean-up procedures in vitro. Eur J Orthod. 2012;34(1):25–32. doi: 10.1093/ejo/cjq128. [DOI] [PubMed] [Google Scholar]
- 6.Oliver RG, Griffiths J. Different techniques of residual composite removal following debonding – time taken and surface enamel appearance. Br J Orthod. 1992;19(2):131–7. doi: 10.1179/bjo.19.2.131. [DOI] [PubMed] [Google Scholar]
- 7.Gwinnett AJ, Gorelick L. Microscopic evaluation of enamel after debonding: clinical application. Am J Orthod. 1977;71(6):651–65. doi: 10.1016/0002-9416(77)90281-0. [DOI] [PubMed] [Google Scholar]
- 8.Al Shamsi AH, Cunningham JL, Lamey PJ, Lynch E. Three-dimensional measurement of residual adhesive and enamel loss on teeth after debonding of orthodontic brackets: an in-vitro study. Am J Orthod. 2007;131(3):301–9. doi: 10.1016/j.ajodo.2006.01.026. [DOI] [PubMed] [Google Scholar]
- 9.Fitzpatrick DA, Way DC. The effects of wear, acid etching, and bond removal on human enamel. Am J Orthod. 1977;72(6):671–81. doi: 10.1016/0002-9416(77)90334-7. [DOI] [PubMed] [Google Scholar]
- 10.Tüfekçi E, Merrill TE, Pintado MR, Beyer JP, Brantley WA. Enamel loss associated with orthodontic adhesive removal on teeth with white spot lesions: an in vitro study. Am J Orthod Dentofacial Orthop. 2004;125(6):733–9. doi: 10.1016/j.ajodo.2003.07.009. [DOI] [PubMed] [Google Scholar]
- 11.Uysal T, Eldeniz AU, Usumez S, Usumez A. Thermal changes in the pulp chamber during different adhesive clean-up procedures. Angle Orthod. 2005;75(2):220–5. doi: 10.1043/0003-3219(2005)075<0216:TCITPC>2.0.CO;2. [DOI] [PubMed] [Google Scholar]
- 12.Azzeh E, Feldon PJ. Laser debonding of ceramic brackets: a comprehensive review. Am J Orthod Dentofacial Orthop. 2003;123(1):79–83. doi: 10.1067/mod.2003.2. [DOI] [PubMed] [Google Scholar]
- 13.Alexander R, Xie J, Fried D. Selective removal of residual composite from dental enamel surfaces using the third harmonic of a Q-switched Nd:YAG laser. Lasers Surg Med. 2002;30(3):240–5. doi: 10.1002/lsm.10018. [DOI] [PubMed] [Google Scholar]
- 14.Louie TM, Jones RS, Sarma AV, Fried D. Selective removal of composite sealants with near-ultraviolet laser pulses of nanosecond duration. J Biomed Opt. 2005;10(1):14001. doi: 10.1117/1.1854676. [DOI] [PubMed] [Google Scholar]
- 15.Wheeler CR, Fried D, Featherstone JD, Watanabe LG, Le CQ. Irradiation of dental enamel with Q-switched lambda = 355-nm laser pulses: surface morphology, fluoride adsorption, and adhesion to composite resin. Lasers Surg Med. 2003;32(4):310–7. doi: 10.1002/lsm.10162. [DOI] [PubMed] [Google Scholar]
- 16.Zuerlein MJ, Fried D, Featherstone JDB, Seka W. Optical properties of dental enamel in the mid-IR determined by pulsed photothermal radiometry. IEEE J Sel Top Quantum Electron. 1999;5(4):1083–9. [Google Scholar]
- 17.Featherstone JD, Barrett-Vespone NA, Fried D, Kantorowitz Z, Seka W. CO2 laser inhibitor of artificial caries-like lesion progression in dental enamel. J Dent Res. 1998;77(6):1397–403. doi: 10.1177/00220345980770060401. [DOI] [PubMed] [Google Scholar]
- 18.Featherstone JDB, Fried D, Bitten ER. Mechanism of laser-induced solubility reduction of dental enamel. Proc SPIE. 1997;2973:112–6. doi: 10.1117/12.273578. [DOI] [Google Scholar]
- 19.Featherstone JD, Nelson DG. Laser effects on dental hard tissues. Adv Dent Res. 1987;1(1):21–6. doi: 10.1177/08959374870010010701. [DOI] [PubMed] [Google Scholar]
- 20.Can AM, Darling CL, Ho C, Fried D. Non-destructive assessment of inhibition of demineralization in dental enamel irradiated by a lambda=9. 3-μm CO2 laser at ablative irradiation intensities with PS-OCT. Lasers Surg Med. 2008;40(5):342–9. doi: 10.1002/lsm.20633. [DOI] [PubMed] [Google Scholar]
- 21.Fried D, Featherstone JD, Le CQ, Fan K. Dissolution studies of bovine dental enamel surfaces modified by high-speed scanning ablation with a lambda = 9. 3-μm TEA CO2 laser. Lasers Surg Med. 2006;38(9):837–45. doi: 10.1002/lsm.20385. [DOI] [PubMed] [Google Scholar]
- 22.Fried D, Ragadio J, Akrivou M, Featherstone JD, Murray MW, Dickenson KM. Dental hard tissue modification and removal using sealed transverse excited atmospheric-pressure lasers operating at lambda=9.6 and 10. 6 μm. J Biomed Opt. 2001;6(2):231–8. doi: 10.1117/1.1344192. [DOI] [PubMed] [Google Scholar]
- 23.Chan KH, Hirasuna K, Fried D. Rapid and selective removal of composite from tooth surfaces with a 9. 3 μm CO2 laser using spectral feedback. Lasers Surg Med. 2011;43(8):824–32. doi: 10.1002/lsm.21111. [DOI] [PMC free article] [PubMed] [Google Scholar]
- 24.Cheng JY, Fan K, Fried D. Use of a compact fiber optic spectrometer for spectral feedback during the laser ablation of dental hard tissues and restorative materials. Proc SPIE. 2006;6137:61370F1–7. doi: 10.1117/12.661789. [DOI] [Google Scholar]
- 25.Dumore T, Fried D. Selective ablation of orthodontic composite by using sub-microsecond IR laser pulses with optical feedback. Lasers Surg Med. 2000;27(2):103–10. doi: 10.1002/1096-9101(2000)27:2<103::aid-lsm1>3.0.co;2-j. [DOI] [PubMed] [Google Scholar]
- 26.Niemz MH. Investigation and spectral analysis of the plasma-induced ablation mechanism of dental hydroxyapatite. Appl Phys B. 1994;58:273–81. [Google Scholar]
- 27.Zach L, Cohen G. Pulp response to externally applied heat. Oral Surg Oral Med Oral Pathol. 1965;19:515–30. doi: 10.1016/0030-4220(65)90015-0. [DOI] [PubMed] [Google Scholar]
- 28.Brown CR, Way DC. Enamel loss during orthodontic bonding and subsequent loss during removal of filled and unfilled adhesives. Am J Orthod. 1978;74(6):663–71. doi: 10.1016/0002-9416(78)90005-2. [DOI] [PubMed] [Google Scholar]
- 29.Thompson RE, Way DC. Enamel loss due to prophylaxis and multiple bonding/debonding of orthodontic attachments. Am J Orthod. 1981;79(3):282–95. doi: 10.1016/0002-9416(81)90076-2. [DOI] [PubMed] [Google Scholar]
- 30.Zuerlein MJ, Fried D, Featherstone JD. Modeling the modification depth of carbon dioxide laser-treated dental enamel. Lasers Surg Med. 1999;25(4):335–47. doi: 10.1002/(sici)1096-9101(1999)25:4<335::aid-lsm8>3.0.co;2-f. [DOI] [PubMed] [Google Scholar]