Abstract
The selective vasopressin V2–receptor antagonist tolvaptan is eliminated almost exclusively by non-renal mechanisms. As renal impairment can influence the pharmacokinetics of drugs even when eliminated by non-renal mechanisms, we evaluated the effect of renal insufficiency on the pharmacokinetics/pharmacodynamics of tolvaptan. Thirty-seven patients were grouped by a 24-h creatinine clearance (CrCL) and evaluated for 48 h after a single 60 mg oral dose in the fasting state. Mean tolvaptan exposure was 90% higher in the under 30-ml/min group compared with the over 60-ml/min group with individual values significantly but negatively correlated with increasing baseline CrCL. There was a greater and more rapid increase in urine output and free water clearance in the over 60-ml/min compared with the renal impaired groups, but they returned to baseline more quickly. Serum sodium increased more rapidly in the over 60 as opposed to the under 30-ml/min group, but overall maximum increases were similar across groups. Small decreases in mean CrCL and small increases in mean serum creatinine/potassium were independent of baseline CrCL. The percent fractional free water clearance with respect to CrCL was significantly but negatively correlated with increasing baseline CrCL. No unexpected adverse events were reported. Thus, renal impairment attenuated the increase in 24-h urine volume and free water clearance caused by tolvaptan, consistent with decreased nephron function in renal impairment. The delay in serum sodium increase was consistent with the longer duration needed to excrete sufficient water to cause the increase.
Keywords: pharmacodynamics, pharmacokinetics, renal impairment, tolvaptan, vasopressin antagonist
Tolvaptan is an orally active vasopressin V2–receptor antagonist, which is approved for treatment of specific forms of hyponatremia in the United States and Europe.1, 2, 3 The recommended starting dose for hyponatremia is 15 mg once daily, which can be titrated to a maximum of 60 mg once daily, as needed, to raise serum sodium.4 Tolvaptan is also used in clinical testing in subjects with autosomal dominant polycystic kidney disease.5, 6, 7, 8
The pharmacokinetics and pharmacodynamics of tolvaptan have been evaluated in multiple trials in healthy subjects. Dose-proportional increases in exposure to tolvaptan, as measured by area under the curve to infinity (AUC∞) and maximum plasma concentration (Cmax), were observed for doses of 15–60 mg.9, 10, 11 After oral administration, tolvaptan produced aquaresis characterized by increases in urine volume and free water clearance (FWC), and consequent increases in serum osmolality and serum sodium within the 24-h period after dosing.10 These effects were not accompanied by significant changes in serum potassium, creatinine clearance (CrCL), or urine electrolyte excretion. A recently published trial showed that the pharmacokinetics and pharmacodynamics of tolvaptan 30 mg were not clinically significantly affected by race or by administration with food.12
Tolvaptan is eliminated almost exclusively by non-renal routes, with <1% of the administered dose excreted unchanged in urine.10 Renal impairment can, however, influence the pharmacokinetics of drugs predominantly eliminated by non-renal mechanisms through effects on drug metabolism enzymes and the activities of drug transporters.13 Therefore, the present trial investigated whether renal impairment influences the pharmacokinetics and pharmacodynamics of tolvaptan following administration of a single 60-mg oral dose.
RESULTS
Subject disposition and characteristics
Thirty-seven subjects were enrolled and given a single 60-mg dose of tolvaptan, including 12 subjects with CrCL <30 ml/min, 12 subjects with CrCL of 30–60 ml/min, and 13 subjects with CrCL >60 ml/min. All subjects completed the trial as planned. The demographics of the CrCL <30- and >60-ml/min groups were well balanced, consistent with the protocol-specified matching of these groups by age, weight, and sex (Table 1). In comparison, the CrCL 30- to 60-ml/min group had a higher mean age, fewer women, and more Hispanic/Latino subjects than the other groups. The mean CrCL values in the CrCL <30-, 30- to 60-, and >60-ml/min groups were 20.6, 49.6, and 95.8 ml/min, respectively. As expected, higher mean cystatin C concentrations were seen in subjects with greater degrees of renal impairment. One subject in the CrCL >60-ml/min group had diabetes and was taking daily medication in violation of the eligibility criteria. This subject was excluded from the pharmacokinetic and pharmacodynamic analyses but was included in the safety analysis.
Table 1. Demographic and clinical characteristics.
| Parametera | CrCL <30 ml/min (n=12) | CrCL 30–60 ml/min (n=12) | CrCL >60 ml/min (n=13) |
|---|---|---|---|
| Age (year) | 58.3 (11.2) | 70.0 (8.2) | 58.8 (11.4) |
| Sex (n (%)) | |||
| Male | 7 (58.3) | 10 (83.3) | 8 (61.5) |
| Female | 5 (41.7) | 2 (16.7) | 5 (38.5) |
| Race (n (%)) | |||
| White | 10 (83.3) | 11 (91.7) | 13 (100) |
| Black | 2 (16.7) | 1 (8.3) | 0 (0) |
| Ethnicity (n (%)) | |||
| Hispanic/Latino | 5 (41.7) | 10 (83.3) | 5 (38.5) |
| Non-Hispanic/Latino | 7 (58.3) | 2 (16.7) | 8 (61.5) |
| Weight (kg) | 76.5 (15.1) | 71.9 (11.5) | 76.3 (11.5) |
| Height (cm) | 170.3 (7.7) | 165.5 (8.5) | 173.2 (9.9) |
| BMI (kg/m2) | 26.4 (5.3) | 26.1 (2.5) | 25.4 (3.3) |
| CrCL (ml/min) | 20.6 (6.4) | 49.6 (7.3) | 95.8 (17.5) |
| Serum sodium (mmol/l) | 138.8 (3.2) | 140.3 (2.5) | 140.5 (1.4) |
| Serum osmolality (mOsm/kg) | 315.1 (11.4) | 297.7 (8.6) | 292.6 (3.6) |
| Serum creatinine (mg/dl) | 3.5 (1.0) | 1.5 (0.3) | 0.9 (0.2) |
| Cystatin C (mg/l) | 3.4 (0.7) | 1.3 (0.3) | 0.9 (0.3) |
Abbreviations: BMI, body mass index; CrCL, creatinine clearance.
All values presented as mean (±s.d.), unless otherwise specified.
Pharmacokinetics
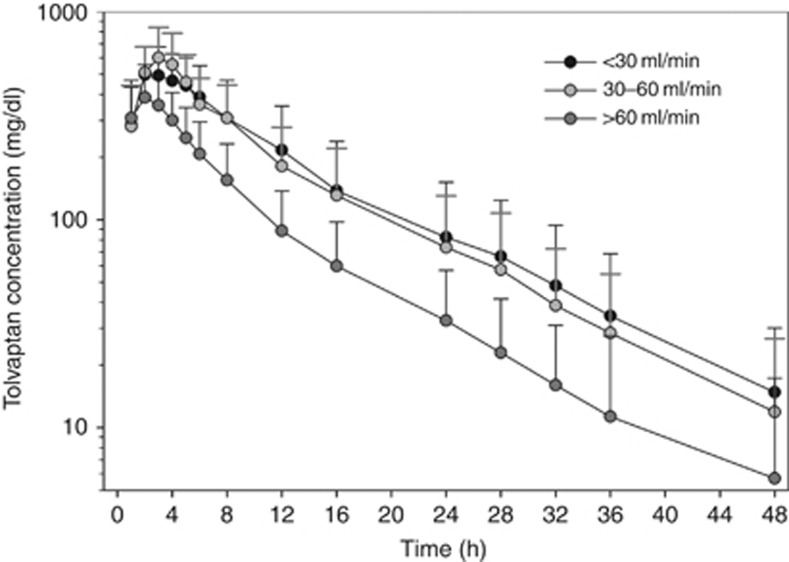
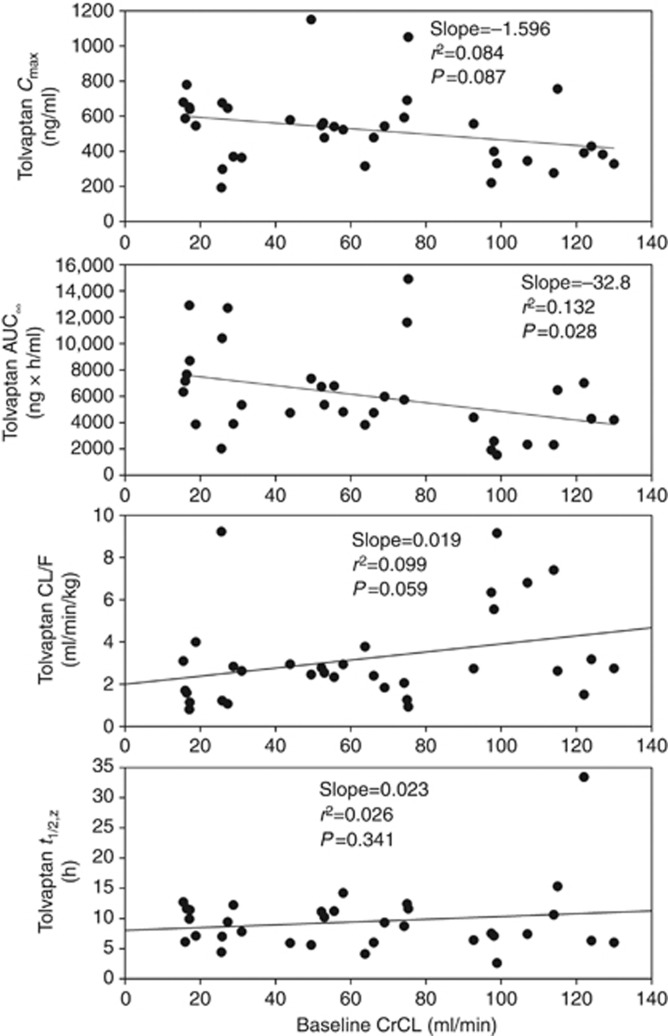
Tolvaptan plasma concentrations reached maximal levels by 2–3 h after dosing and then decreased in an exponential manner (Figure 1). Subjects with renal impairment (CrCL <30 and 30–60 ml/min) had slightly higher plasma concentrations than those with preserved renal function (CrCL >60 ml/min) throughout most of the 48-h evaluation period. When measured by AUC∞, exposure to tolvaptan, on average, was 90% higher in the CrCL <30-ml/min group and 83% higher in the CrCL 30- to 60-ml/min group than in the CrCL >60-ml/min group (Table 2). Mean Cmax values were somewhat higher and mean values for clearance (CL/F) were lower in the groups with renal impairment than in the preserved renal function group. Individual AUC∞ values were negatively correlated with increasing baseline CrCL (r2=0.132; P=0.028) (Figure 2). Individual Cmax values showed a trend for being negatively correlated with baseline CrCL (P=0.087), whereas CL/F showed a trend for being positively correlated with baseline CrCL (P=0.059). Neither terminal-phase elimination half-life nor percent fraction of unbound drug (%fu) was correlated with baseline CrCL.
Figure 1.
Mean (±s.d.) tolvaptan plasma concentration–time profiles by creatinine clearance.
Table 2. Pharmacokinetic parameters for tolvaptan by CrCL group.
| Parametera | CrCL <30 ml/min (N=12) | CrCL 30–60 ml/min (N=12) | CrCL >60 ml/min (N=12) |
|---|---|---|---|
| Total tolvaptan | |||
| Cmax (ng/ml) | 535 (183) | 621 (241) | 417 (150) |
| tmax (h) | 3.5 (2.0–6.0) | 3.0 (2.0–4.0) | 2.0 (1.0–4.0) |
| AUCt (ng h/ml) | 6690 (3550) | 6470 (3090) | 3530 (1570) |
| t1/2,z (h)b | 9.1 (2.8) | 9.2 (3.3) | 10.1 (8.3) |
| AUC∞ (ng h/ml)b | 7360 (3580) | 6980 (3360) | 3890 (1910) |
| CL/F (ml/min/kg)b | 2.65 (2.40) | 2.37 (0.80) | 4.55 (2.58) |
| Unbound tolvaptan | |||
| fu (%) | 1.2 (0.8) | 0.6 (0.1) | 1.0 (0.3) |
| Cmax,u (ng/ml) | 5.89 (2.74) | 3.35 (0.85) | 4.29 (1.92) |
| AUC∞,u (ng h/ml)b | 71.8 (37.4) | 36.4 (11.9) | 37.5 (21.2) |
| CL/Fu (ml/min/kg)b | 0.034 (0.038) | 0.014 (0.006) | 0.049 (0.036) |
Abbreviations: AUCt, area under the curve from time zero to the last sampling time; AUC∞, AUC to infinity; CL/F, clearance; Cmax, maximum plasma concentration; CrCL, creatinine clearance; fu, fraction of unbound drug; tmax, time to Cmax; t1/2,z, terminal half-life; u, unbound.
All values are mean (±s.d.), except for tmax, which is shown as median (range).
n=11 per group.
Figure 2.
Plots of individual tolvaptan pharmacokinetic parameters versus baseline creatinine clearance (CrCL). AUC∞, area under the curve to infinity; CL/F, clearance; Cmax, maximum plasma concentration; t1/2,z, terminal half-life.
Pharmacodynamics
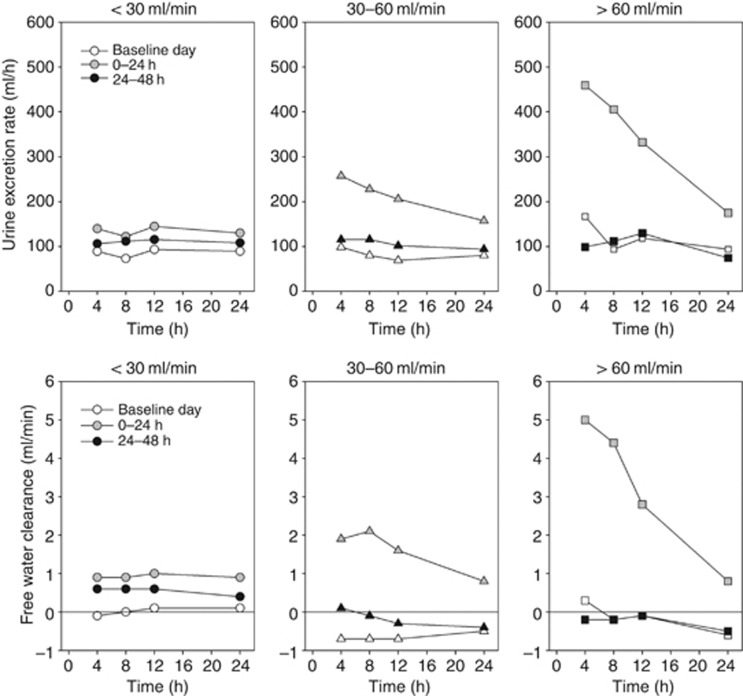
The onset of tolvaptan action was rapid as FWC was increased in all subjects in the 0- to 4-h urine collection period. The CrCL >60-ml/min group had larger and more rapid increases in urine excretion rate and FWC after tolvaptan administration, and these parameters returned to baseline more quickly (ie, within 24 h) than in the groups with renal impairment (Figure 3).
Figure 3.
Mean urine excretion rate and free water clearance plotted at the end time of the collection interval at baseline and after tolvaptan dosing.
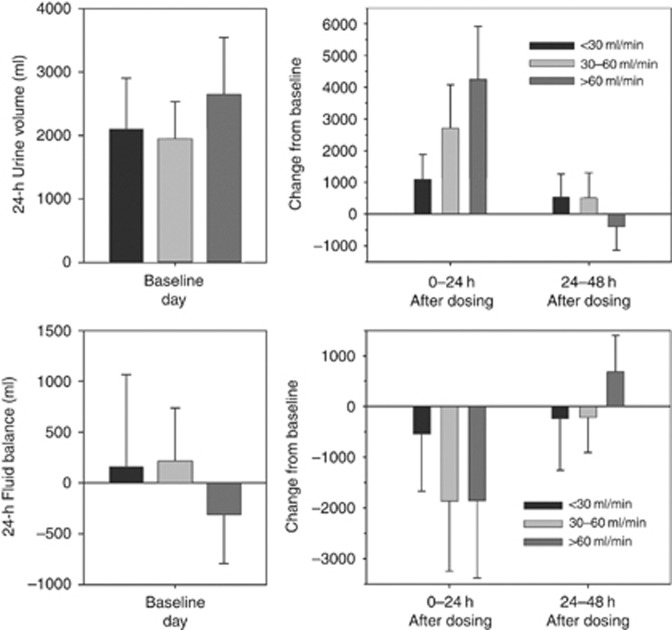
Mean fluid balances were negative for all groups on day 1. The subjects with CrCL >60 ml/min had greater increases in fluid intake in the 24-h period after tolvaptan administration such that mean fluid balance was similar to that in the CrCL 30- to 60-ml/min group (Figure 4). Fluid intake remained marginally higher on day 2 across all groups, but mean fluid balance remained negative in the CrCL 30- to 60- and <30-ml/min groups, consistent with the increased FWC on day 2 (Table 3).
Figure 4.
Mean (±s.d.) daily fluid intake and fluid balance at baseline and change from baseline after tolvaptan dosing.
Table 3. Daily urine volume, fluid intake, and free water clearance by CrCL group.
| Parametera | CrCL <30 ml/min (N=12) | CrCL 30–60 ml/min (N=12) | CrCL >60 ml/min (N=12) |
|---|---|---|---|
| Urine volume (ml) | |||
| Baseline, day 0 | 2099 (806) | 1949 (586) | 2644 (897) |
| 0–24 h after dosing | 3189 (850) | 4654 (1504) | 6891 (1571) |
| Change from baseline | 1090 (785) | 2705 (1375) | 4247 (1673) |
| 24–48 h after dosing | 2636 (850) | 2462 (1038) | 2259 (1186) |
| Change from baseline | 537 (732) | 513 (789) | −385 (755) |
| Fluid intake (ml) | |||
| Baseline, day 0 | 2254 (662) | 2162 (374) | 2332 (753) |
| 0–24 h after dosing | 2815 (682) | 2998 (578) | 4726 (1182) |
| Change from baseline | 560 (800) | 836 (416) | 2393 (1137) |
| 24–48 h after dosing | 2555 (708) | 2467 (574) | 2628 (1315) |
| Change from baseline | 300 (769) | 304 (452) | 296 (1031) |
| Free water clearance (ml/min) | |||
| Baseline, day 0 | 0.0 (0.5) | −0.6 (0.5) | −0.3 (0.7) |
| 0–24 h after dosing | 0.9 (0.5) | 1.3 (1.0) | 2.4 (0.8) |
| Change from baseline | 0.9 (0.6) | 1.9 (0.9) | 2.7 (1.0) |
| 24–48 h after dosing | 0.5 (0.4) | −0.3 (0.8) | −0.3 (0.7) |
| Change from baseline | 0.5 (0.5) | 0.4 (0.4) | 0.0 (0.6) |
Abbreviation: CrCL, creatinine clearance.
Values are mean (±s.d.).
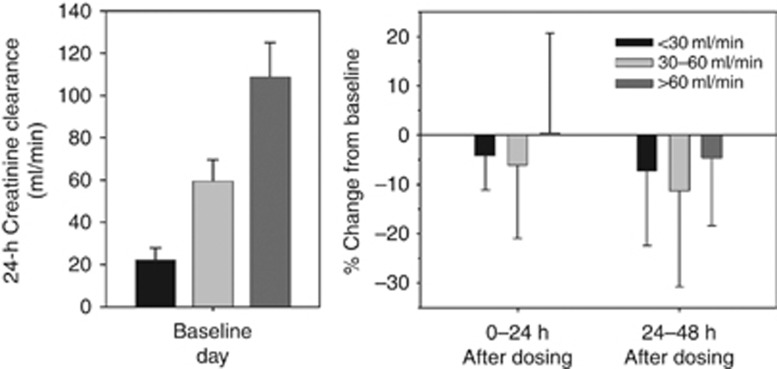
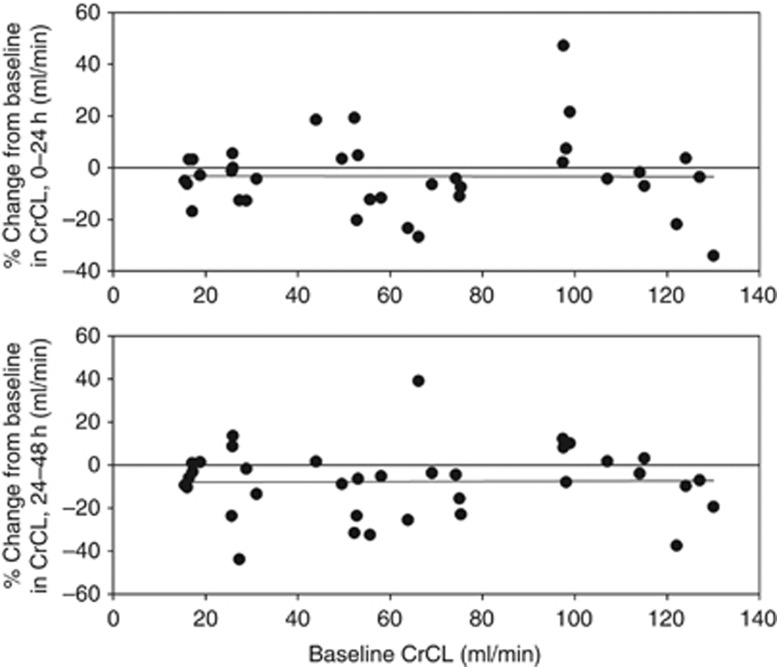
In the first 24 h after dosing, tolvaptan reduced mean CrCL by 4–7% in subjects with renal impairment, but did not change mean CrCL in the group with preserved renal function (Figure 5). On day 2, mean CrCL was reduced across all groups, ranging from 4% in the group with preserved renal function to 11% in the group with CrCL 30–60 ml/min. These mean changes were not significant, given the large intersubject variability in CrCL change. Moreover, percent changes in CrCL following tolvaptan were not correlated with baseline CrCL (Figure 6).
Figure 5.
Mean (±s.d.) daily creatinine clearance at baseline and percent change from baseline after tolvaptan dosing.
Figure 6.
Individual values of percent change from baseline in creatinine clearance (CrCL) on days 1 and 2 after tolvaptan dosing.
The percent change from baseline in fractional FWC with respect to CrCL (FWC/CrCL) for the 0- to 24-h period was negatively correlated with baseline CrCL (r2=0.144; P=0.022); mean (standard deviation (s.d.)) values for the CrCL <30-, 30- to 60-, and >60-ml/min groups were 4.1% (2.3%), 3.5% (1.5%), and 2.5% (0.9%), respectively.
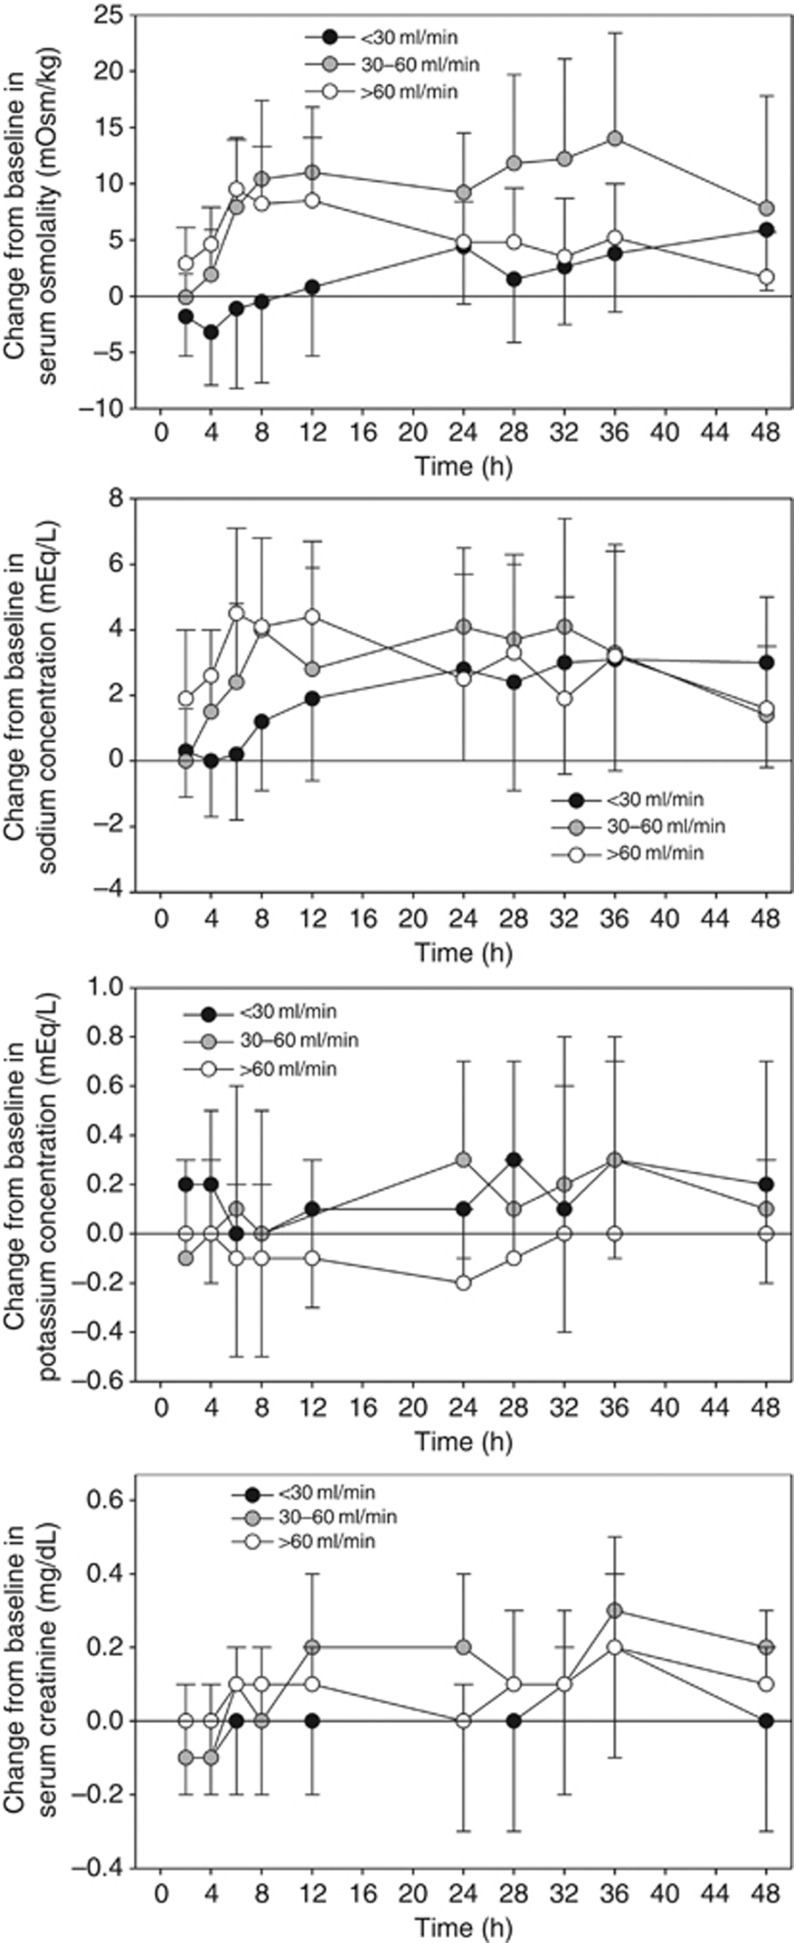
Tolvaptan increased serum osmolality and sodium more rapidly in subjects with CrCL >60 or 30–60 ml/min than in those with CrCL <30 ml/min (Figure 7). However, the serum sodium increases observed from 12 to 48 h after dosing were similar in magnitude, regardless of baseline CrCL (Table 4). Serum potassium concentrations increased minimally after tolvaptan administration: mean changes from baseline were ∼0.1–0.2 mEq/l and were independent of CrCL. Mean serum creatinine increased by ∼0.1–0.3 mg/dl after tolvaptan administration and also were independent of baseline CrCL.
Figure 7.
Mean (±s.d.) change from baseline in serum osmolality, sodium, potassium, and creatinine by creatinine clearance group after tolvaptan dosing.
Table 4. C max, maximum change from baseline, and t max of serum osmolality and sodium by CrCL group after tolvaptan dosing.
| Parameter | CrCL <30 ml/min (N=12) | CrCL 30–60 ml/min (N=12) | CrCL >60 ml/min (N=12) |
|---|---|---|---|
| Serum osmolality | |||
| Cmax (mOsm/kg)a | 324 (11) | 315 (11) | 304 (4) |
| Maximum change from BLa | 9 (4) | 18 (8) | 11 (4) |
| tmax (h)b | 36 (8–48) | 30 (6–36) | 8 (4–48) |
| Serum sodium | |||
| Cmax (mEq/l)a | 143 (4) | 146 (2) | 147 (2) |
| Maximum change from BLa | 5 (3) | 6 (2) | 6 (2) |
| tmax (h)b | 32 (2–48) | 24 (4–36) | 7 (2–36) |
Abbreviations: BL, baseline; Cmax, maximum plasma concentration; CrCL, creatinine clearance; tmax, time to Cmax.
Mean (±s.d.).
Median (range).
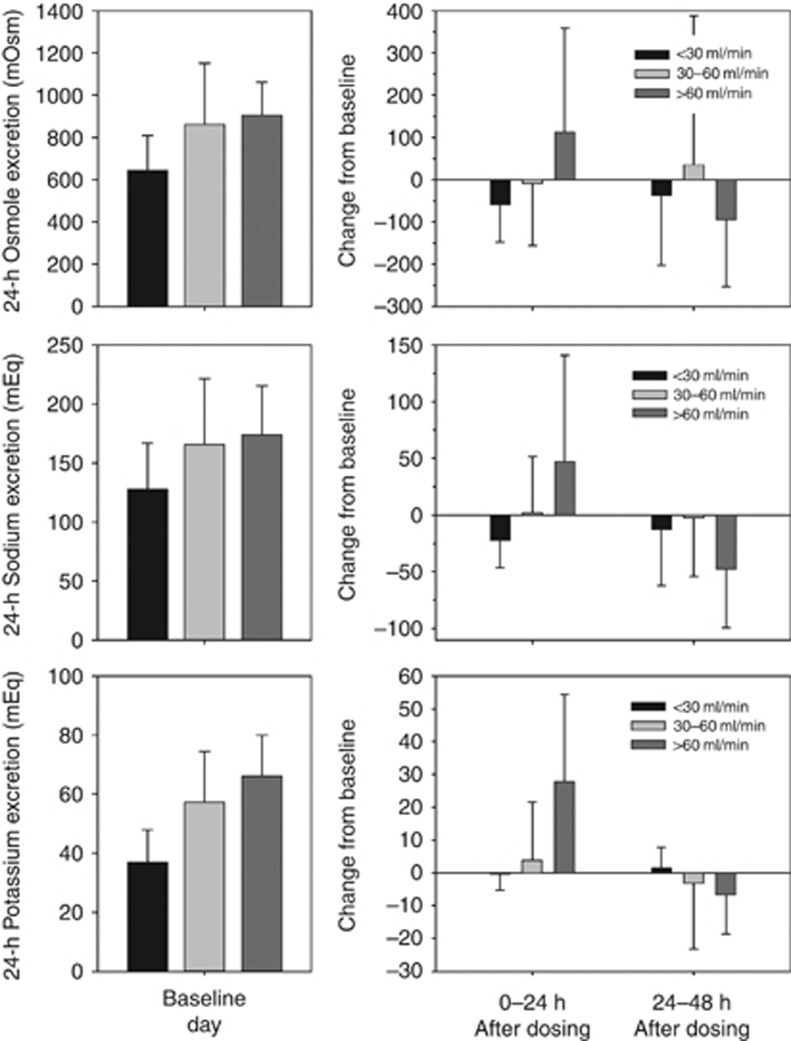
Subjects with CrCL >60 ml/min had increases in mean urinary excretion of osmoles, sodium, and potassium in the 24-h interval after tolvaptan administration, which was not seen in subjects with CrCL <30 or 30–60 ml/min (Figure 8). The increased excretion appeared to occur when FWC was >3 ml/min.
Figure 8.
Mean (±s.d.) daily urinary excretion of osmoles, sodium, and potassium at baseline, and change from baseline after tolvaptan dosing.
Pharmacokinetic/pharmacodynamic relationships
Tolvaptan plasma concentrations, as represented by Cmax or AUC∞, after the single 60-mg dose were not correlated with changes in any of the pharmacodynamic end points. Although Cmax and AUC∞ were higher in subjects with poorer renal function, the pharmacodynamic responses of increased urine output and FWC were not associated with tolvaptan concentrations and were instead associated with baseline CrCL, thereby reflecting the amount of kidney function still present. The percent changes in CrCL were similar across the range of baseline CrCL values (Figure 6).
Safety
Following treatment with a single 60-mg dose of tolvaptan, there were no unexpected treatment-emergent adverse events (TEAEs). Twenty-six subjects (70%) had TEAEs, and all were mild or moderate in severity. The most common TEAEs were thirst (overall 27% range across groups 23–33%), pollakiuria (24% 8–33%), and dry mouth (14% 8–25%). There were no clinically meaningful changes in vital signs or electrocardiographic parameters. Ten subjects (27%) had potentially clinically significant abnormalities in laboratory test values, including five with CrCL <30 ml/min and four with CrCL 30–60 ml/min. The most common of these abnormalities were elevated glucose, urea nitrogen, calcium, uric acid, and decreased hemoglobin. Hyperglycemia and hypoglycemia were reported as TEAEs by two subjects each, both with history of diabetes mellitus, and hyperkalemia was reported as a TEAE by one subject. Of these, one TEAE each of hyperglycemia and hyperkalemia were considered to be possibly related to trial medication; excursions outside the normal range have been reported in other trials.
DISCUSSION
Following oral administration of a single 60-mg dose, tolvaptan plasma concentrations were higher in the groups with renal impairment (CrCL <30 and 30–60 ml/min) than in the group with preserved renal function group (CrCL >60 ml/min). On analysis by linear regression, AUC∞ was the only pharmacokinetic parameter to show a significant relationship with baseline CrCL, with increasing AUC∞ associated with decreasing baseline CrCL. The tolvaptan Cmax increased slightly, and clearance decreased slightly with decreasing baseline CrCL, but neither trend reached statistical significance. Baseline CrCL was not correlated with tolvaptan plasma protein binding and, therefore, changes in parameters reflecting unbound tolvaptan (Cmax,u, AUC∞,u, and CL/Fu ) paralleled those for Cmax, AUC∞, and CL/F (Table 2).
The 60-mg dose used in this trial is the maximum dose for the treatment of hyponatremia and is reached when 15- and 30-mg doses do not provide sufficient increases in serum sodium. The pharmacokinetic parameters determined for the group with preserved renal function were similar to those previously reported for the 60-mg dose in the US single ascending dose trial.10 In the present trial and the earlier trial, mean Cmax values were 417 and 450 ng/ml, respectively; the corresponding mean AUC∞ values were 3.53 and 3.66 μg h/ml, and mean CL/F values were 4.55 and 4.12 ml/min/kg.
Tolvaptan Cmax and AUC∞ values did not correlate with changes in any pharmacodynamic parameter after tolvaptan dosing. This finding was not unexpected, given that exposure to tolvaptan after a single 60-mg dose was sufficient to produce a maximal increase in urine excretion rate in all subjects.10 Baseline CrCL was, however, highly positively correlated with changes in many of the pharmacodynamic end points following tolvaptan administration: increases in urine output and FWC were larger and returned to baseline more rapidly than in subjects with renal impairment. Clinically insignificant increases in mean urinary excretion of osmoles, sodium, and potassium were evident in the 24-h period after tolvaptan dosing for subjects with CrCL >60 ml/min but not those with renal impairment. This finding may reflect the more rapid rate of urine flow seen after tolvaptan administration in the CrCL >60-ml/min group, which may prevent the kidney from reabsorbing much of the filtered electrolytes. However, from 24 to 48 h after dosing, urinary electrolyte excretion dropped below baseline levels as subjects with preserved renal function started to recover electrolyte losses. In contrast, tolvaptan did not affect urinary electrolytes in subjects with renal impairment likely because they could not generate a high rate of urine flow. Increases in FWC were observed in all subjects shortly after dosing, with fractional FWC higher in subjects with lower baseline CrCL.
Consistent with the larger and more rapid increases in urine output and FWC, subjects with preserved renal function had more rapid increases in serum osmolality and serum sodium than did those with renal impairment. Nevertheless, the overall magnitude of the changes from baseline did not differ by CrCL. Thus, subjects with renal impairment achieved the same maximum levels of serum osmolality and serum sodium as did subjects with CrCL >60 ml/min; however, these levels occurred at a later time following tolvaptan dosing, consistent with the smaller increases in urine output and FWC seen after tolvaptan administration. In turn, the smaller increases in urine output and FWC with decreasing CrCL are consistent with a reduced number of functioning nephrons in subjects with renal impairment.14 Urine output and FWC following the single 60-mg dose of tolvaptan may, therefore, provide a measure of the number of functioning nephrons or of renal function in general. As the number of functioning nephrons and CrCL decline, a longer duration is needed to excrete sufficient water to affect an increase in serum sodium and osmolality.
Tolvaptan administration produced a negative fluid balance in each CrCL group on day 1, averaging 530 ml in the group with CrCL <30 ml/min and ∼1850 ml in the other two groups. The negative fluid balance indicates that subjects did not drink enough water during the first 24 h following tolvaptan administration to recover the fluid lost. It is interesting to note that subjects in the CrCL >60- and 30- to 60-ml/min groups had similar changes in fluid balance on day 1, meaning that subjects in the CrCL >60-ml/min group drank ∼1500 ml more water. The fluid balance observed in these subjects was also similar to that observed in a US clinical trial in patients with euvolemic or hypervolemic hyponatremia (serum creatinine <3.5 mg/dl) initially administered a 15-mg dose of tolvaptan, even though the mean urine output for this dose was only 3218 ml, compared with the higher urine volumes seen in this trial (Table 3).2
Results from this trial were similar to those seen in autosomal dominant polycystic kidney disease patients.6 In this report on 20 subjects with autosomal dominant polycystic kidney disease, with estimated CrCL by Cockcroft and Gault,15 of >30 ml/min and 10 subjects with >60 ml/min were administered tolvaptan as a split-dose regimen of 45 mg on awakening and 15 mg ∼8 h later for 7 days, and on day 8, they underwent renal function testing following administration of a 45-mg dose.6 For the time period of testing, 2.0–3.5 h postdose tolvaptan plasma concentrations would have been close to their peak as time to Cmax is ∼2 h and thus sufficient to produce maximal increases in urine output. Compared with testing at baseline, a statistically significant reduction of 8.6% was observed in glomerular filtration rate (as determined by iothalamate infusion) and mean fractional FWC was significantly increased by 3.5%. These results are similar to the CrCL and fractional FWC changes observed after a single dose of tolvaptan and indicate that the response to tolvaptan does not change greatly following multiple doses.
Despite the increase in exposure to tolvaptan, subjects with renal impairment had delayed pharmacodynamic responses, including increases in serum osmolality and serum sodium, compared with subjects with preserved renal function. On the basis of these findings, no adjustment to tolvaptan (Samsca) dosing for subjects with impaired renal function is recommended in labeling. Individual values of CrCL in the group with the greatest renal impairment ranged from 15 to 31 ml/min in this trial, corresponding to stage 4 chronic kidney disease.16 The effects of tolvaptan on serum sodium levels are likely lost at very low levels of renal function and, therefore the use of this agent in patients with CrCL <10 ml/min is not recommended.4
This trial has limitations. The group with CrCL 30–60 ml/min was not matched for age, race, and sex with the other two groups, as such direct comparisons were not planned or performed. Analysis between groups was addressed in the linear regression analyses that used individual baseline CrCL values. In addition, a formal sample size was not determined, but the sample sizes of 12 subjects per group and 36 in total for the pharmacokinetic and pharmacodynamic analyses were consistent with other recent trials evaluating the impact of renal impairment on a drug's pharmacokinetics and pharmacodynamics.17, 18, 19
In summary, increases in urine excretion rate and FWC following tolvaptan administration were higher in subjects with preserved renal function (greater number of intact nephrons) than in those with renal impairment (smaller number of intact nephrons); however, increases were observed in all subjects. In addition, increased serum sodium and serum osmolality were seen in all subjects. No adjustment to tolvaptan (Samsca) dosing for subjects with impaired renal function is recommended in labeling. The use of tolvaptan in patients with CrCL <10 ml/min is not recommended.
MATERIALS AND METHODS
Subjects
Men and women aged ⩾18 years, with a body mass index ⩽35 kg/m2 and an anticipated CrCL of <30 or 30–60 ml/min were evaluated for 24-h CrCL at screening and were than allocated to the appropriate group (12 subjects planned per group). Subjects were recruited for the CrCL >60-ml/min group based on those enrolled in the CrCL <30-ml/min group, matching for age, weight, and sex. Eligible subjects were in stable health despite renal dysfunction and agreed to remain abstinent or practice double-barrier forms of contraception, if of childbearing potential. All subjects provided written informed consent. Subjects with significant medical abnormalities (other than renal impairment), prior renal transplant or current dialysis, supine blood pressure >160/95 or <95/50 mm Hg, supine heart rate <40 or >90 beats per min, history of drug or alcohol abuse, mental disorders, or significant bleeding, or history or evidence of hepatitis or HIV were excluded. Consumption of products or beverages containing methylxanthines, grapefruit, or Seville oranges within 72 h, or use of prescription or over-the-counter medications or supplements within 14 days, or antibiotics within 30 days before dosing was not allowed.
Trial design
This single-dose, open-label, parallel-group trial was conducted at two sites in the United States. Subjects were screened for eligibility within 21 days before the trial, reported to the trial clinic on day −1, and had baseline pharmacodynamic assessments on day 0. Subjects received a single 60-mg oral dose of tolvaptan with 240 ml water on day 1 after fasting for ⩾10 h. Water was withheld for 2 h before and after dosing, but was otherwise allowed ad libitum. Lunch was provided on day 1 after the 4-h postdose pharmacokinetic and pharmacodynamic assessments had been completed. Pharmacokinetic and pharmacodynamic assessments were performed at prespecified times for 48 h after dosing. Subjects were discharged from the clinic on day 3 and then received a safety follow-up telephone call on day 8 (ie, 7 days after dosing).
This trial was conducted in accordance with ethical principles originating in the Declaration of Helsinki Principles, and in compliance with Good Clinical Practices and national regulatory guidelines. The protocol and informed consent form were approved by the governing institutional review board or independent ethics committee at each center before that site enrolled any subjects.
Assessments
Pharmacokinetics
Blood samples for determination of tolvaptan plasma concentrations were collected within 10 min before dosing, and then at 1, 2, 3, 4, 5, 6, 8, 12, 16, 24, 28, 32, 36, and 48 h after dosing in tubes containing sodium heparin as anticoagulant. An additional blood sample was collected within 30 min before dosing in a tube containing potassium-2 ethylene diamine tetraacetic acid for determination of the plasma protein binding of tolvaptan.
Pharmacodynamics
Blood samples for measurement of serum osmolality, sodium and potassium ion, and creatinine were collected within 30 min before, and at 2, 4, 6, 8, 12, 24, 28, 32, 36, and 48 h after dosing. Baseline samples were also collected on day 0 at times corresponding to the predose and 12-h postdose samples scheduled for day 1. Urine was collected and pooled for the intervals 0–4, 4–8, 8–12, and 12–24 h on days 0 (baseline), 1, and 2. Subjects were asked to void immediately before blood sample collections at corresponding time points. Urine volume for each interval was recorded, and an aliquot was taken for determination of urine osmolality, sodium, potassium, and creatinine.
Safety
Adverse events were recorded from days −1 to 3 at the trial center and at a follow-up telephone call on day 8, and were coded using the Medical Dictionary for Regulatory Activities. Vital signs and 12-lead electrocardiograms were collected at check-in, on days 0 and 1, and at discharge. Clinical laboratory tests and physical examinations were conducted at check-in and discharge.
Bioanalytics
Tolvaptan plasma concentrations were measured at Prevalere Life Sciences (Whitesboro, NY) using a high-performance liquid chromatography with tandem mass spectrometric detection method that had been validated over the concentration range of 5–1000 ng/ml.10 For determination of plasma protein binding, plasma samples were dialyzed for 7 h at 37 °C using a rapid equilibrium dialysis 96-well system at Covance Laboratories (Madison, WI), and then aliquots of the plasma and dialysate were analyzed by high-performance liquid chromatography with tandem mass spectrometry to allow calculation of %fu.
Pharmacokinetic analysis
For each subject, tolvaptan plasma–concentration–time data were analyzed using non-compartmental methods, with the actual blood sampling time used for pharmacokinetic calculations. Values for Cmax and time to Cmax were determined directly from the observed data, AUC from time 0 to the last sampling time was estimated using the linear trapezoidal rule, and other parameters were calculated using standard methods.20 Pharmacokinetic parameters for unbound tolvaptan were determined by multiplying the corresponding parameter by %fu. All pharmacokinetic calculations were performed with WinNonlinPro version 5.2 (Pharsight, Mountain View, CA).
Pharmacodynamic analysis
CrCL was calculated from the ratio of urine/serum creatinine concentration multiplied by urine flow rate. FWC was calculated from urine flow rate minus the product of the urine/plasma osmolality ratio and urine flow rate. Fluid intake was determined from all liquids consumed orally, including the 240 ml of water used for tolvaptan administration and any foods containing significant amounts of water. Fluid balance represented the difference between fluid intake and urine output. Calculations were performed using SAS version 9.2 (SAS Institute, Cary, NC). Fractional FWC was determined as the ratio of FWC to CrCL using Excel (Microsoft Professional Plus 2010; Microsoft, Seattle WA).
Pharmacokinetic/pharmacodynamic correlations
Potential associations between pharmacokinetic and pharmacodynamic parameters were explored graphically and by linear regression using Sigma Plot version 10 (SPSS Institute, Chicago, IL). Individual tolvaptan Cmax and AUC∞ values were compared with individual percent changes from baseline in CrCL, and changes from baseline in 24-h urine volume and FWC. In addition, individual baseline CrCL values were compared with tolvaptan pharmacokinetic parameters, and changes from baseline in serum and urine pharmacodynamic parameters.
Statistics
No formal sample size determination was carried out to determine the statistical power of this trial. The pharmacokinetic parameters were summarized by CrCL group in subjects with valid tolvaptan plasma measurements using descriptive statistics determined by S-Plus version 6.1 (Insightful, Seattle, WA). The pharmacodynamic parameters were similarly summarized using SAS version 9.2 (SAS Institute), except for fractional FWC, which was summarized using Excel.
Acknowledgments
Editorial support was provided by Barry Weichman, PhD, and Catherine Fontana of BioScience Communications, New York, NY, and was funded by Otsuka Pharmaceutical Development and Commercialization, Rockville, MD.
Each author is an employee of the trial sponsor Otsuka Pharmaceutical Development & Commercialization, Rockville, MD, USA. All the authors declared no competing interests.
Footnotes
An abstract of these data was presented at the ERA-EDTA Congress, May 2012, Paris (http://www.m-events.com/customer/2012/era-edta/data/9283.pdf; last accessed 24 June 2013).
References
- Berl T, Quittnat-Pelletier F, Verbalis JG, et al. Oral tolvaptan is safe and effective in chronic hyponatremia. J Am Soc Nephrol. 2010;21:705–712. doi: 10.1681/ASN.2009080857. [DOI] [PMC free article] [PubMed] [Google Scholar]
- Schrier RW, Gross P, Gheorghiade M, et al. Tolvaptan, a selective oral vasopressin V2-receptor antagonist, for hyponatremia. N Engl J Med. 2006;355:2099–2112. doi: 10.1056/NEJMoa065181. [DOI] [PubMed] [Google Scholar]
- Verbalis JG, Adler S, Schrier RW, et al. Efficacy and safety of oral tolvaptan therapy in patients with the syndrome of inappropriate antidiuretic hormone secretion. Eur J Endocrinol. 2011;164:725–732. doi: 10.1530/EJE-10-1078. [DOI] [PMC free article] [PubMed] [Google Scholar]
- Samsca (tolvaptan) Prescribing Information. Otsuka America Pharmaceutical: Rockville, MD, USA; 2012. [Google Scholar]
- Higashihara E, Torres VE, Chapman AB, et al. Tolvaptan in autosomal dominant polycystic kidney disease: three years' experience. Clin J Am Soc Nephrol. 2011;6:2499–2507. doi: 10.2215/CJN.03530411. [DOI] [PMC free article] [PubMed] [Google Scholar]
- Irazabal MV, Torres VE, Hogan MC, et al. Short-term effects of tolvaptan on renal function and volume in patients with autosomal dominant polycystic kidney disease. Kidney Int. 2011;80:295–301. doi: 10.1038/ki.2011.119. [DOI] [PubMed] [Google Scholar]
- Torres VE, Chapman AB, Devuyst O, et al. Tolvaptan in patients with autosomal dominant polycystic kidney disease. N Engl J Med. 2012;367:2407–2418. doi: 10.1056/NEJMoa1205511. [DOI] [PMC free article] [PubMed] [Google Scholar]
- Torres VE, Meijer E, Bae KT, et al. Rationale and design of the TEMPO (Tolvaptan Efficacy and Safety in Management of Autosomal Dominant Polycystic Kidney Disease and its Outcomes) 3–4 study. Am J Kidney Dis. 2011;57:692–699. doi: 10.1053/j.ajkd.2010.11.029. [DOI] [PubMed] [Google Scholar]
- Kim SR, Hasunuma T, Sato O, et al. Pharmacokinetics, pharmacodynamics and safety of tolvaptan, a novel, oral, selective nonpeptide AVP V2-receptor antagonist: results of single- and multiple-dose studies in healthy Japanese male volunteers. Cardiovasc Drugs Ther. 2011;25 (Suppl 1:S5–S17. doi: 10.1007/s10557-011-6299-3. [DOI] [PubMed] [Google Scholar]
- Shoaf SE, Wang Z, Bricmont P, et al. Pharmacokinetics, pharmacodynamics, and safety of tolvaptan, a nonpeptide AVP antagonist, during ascending single-dose studies in healthy subjects. J Clin Pharmacol. 2007;47:1498–1507. doi: 10.1177/0091270007307877. [DOI] [PubMed] [Google Scholar]
- Yi S, Jeon H, Yoon SH, et al. Pharmacokinetics and pharmacodynamics of oral tolvaptan administered in 15- to 60-mg single doses to healthy Korean men. J Cardiovasc Pharmacol. 2012;59:315–322. doi: 10.1097/FJC.0b013e318241e89c. [DOI] [PubMed] [Google Scholar]
- Shoaf SE, Kim SR, Bricmont P, et al. Pharmacokinetics and pharmacodynamics of single-dose oral tolvaptan in fasted and non-fasted states in healthy Caucasian and Japanese male subjects. Eur J Clin Pharmacol. 2012;68:1595–1603. doi: 10.1007/s00228-012-1295-5. [DOI] [PubMed] [Google Scholar]
- Verbeeck RK, Musuamba FT. Pharmacokinetics and dosage adjustment in patients with renal dysfunction. Eur J Clin Pharmacol. 2009;65:757–773. doi: 10.1007/s00228-009-0678-8. [DOI] [PubMed] [Google Scholar]
- Luyckx VA, Brennner BM. The clinical importance of nephron mass. J Am Soc Nephrol. 2010;21:898–910. doi: 10.1681/ASN.2009121248. [DOI] [PubMed] [Google Scholar]
- Cockcroft DW, Gault MH. Prediction of creatinine clearance from serum creatinine. Nephron. 1976;16:31–41. doi: 10.1159/000180580. [DOI] [PubMed] [Google Scholar]
- Levey AS, Coresh J, Balk E, et al. National Kidney Foundation practice guidelines for chronic kidney disease: evaluation, classification, and stratification. Ann Intern Med. 2003;139:137–147. doi: 10.7326/0003-4819-139-2-200307150-00013. [DOI] [PubMed] [Google Scholar]
- Butler K, Teng R. Pharmacokinetics, pharmacodynamics, and safety of ticagrelor in volunteers with severe renal function. J Clin Pharmacol. 2012;52:1388–1398. doi: 10.1177/0091270011415526. [DOI] [PubMed] [Google Scholar]
- Kubitza D, Becka M, Mueck E, et al. Effects of renal impairment on the pharmacokinetics, pharmacodynamics and safety of rivaroxaban, an oral, direct Factor Xa inhibitor. Br J Clin Pharmacol. 2010;70:703–712. doi: 10.1111/j.1365-2125.2010.03753.x. [DOI] [PMC free article] [PubMed] [Google Scholar]
- Nichols AI, Richards LS, Behrle JA, et al. The pharmacokinetics and safety of desvenlafaxine in subjects with chronic renal impairment. Int J Clin Pharmacol Ther. 2011;49:3–13. doi: 10.5414/cpp49003. [DOI] [PubMed] [Google Scholar]
- Jusko WJ.Guidelines for the collection and analysis of pharmacokinetic dataIn: Evans WE, Jusko WJ, Schentag JJ (eds). Applied Pharmacokinetics: Principles of Therapeutic Drug Monitoring3rd ednApplied Therapeutics: Vancouver, WA, USA; 19921–43. [Google Scholar]


