

Abstract
Familial Alzheimer’s disease (FAD) is characterized by autosomal dominant heritability and early disease onset. Mutations in the gene encoding presenilin-1 (PS1) are found in approximately 80% of cases of FAD, with some of these patients presenting cerebellar damage with amyloid plaques and ataxia with unclear pathophysiology. A Colombian kindred carrying the PS1-E280A mutation is the largest known cohort of PS1-FAD patients. Here, we investigated PS1-E280A–associated cerebellar dysfunction and found that it occurs early in PS1-E208A carriers, while cerebellar signs are highly prevalent in patients with dementia. Postmortem analysis of cerebella of PS1-E280A carrier revealed greater Purkinje cell (PC) loss and more abnormal mitochondria compared with controls. In PS1-E280A tissue, ER/mitochondria tethering was impaired, Ca2+ channels IP3Rs and CACNA1A were downregulated, and Ca2+-dependent mitochondrial transport proteins MIRO1 and KIF5C were reduced. Accordingly, expression of PS1-E280A in a neuronal cell line altered ER/mitochondria tethering and transport compared with that in cells expressing wild-type PS1. In a murine model of PS1-FAD, animals exhibited mild ataxia and reduced PC simple spike activity prior to cerebellar β-amyloid deposition. Our data suggest that impaired calcium homeostasis and mitochondrial dysfunction in PS1-FAD PCs reduces their activity and contributes to motor coordination deficits prior to Aβ aggregation and dementia. We propose that PS1-E280A affects both Ca2+ homeostasis and Aβ precursor processing, leading to FAD and neurodegeneration.
Introduction
Familial Alzheimer’s disease (FAD) is a rare variant of Alzheimer’s disease (AD), the most common form of dementia, which is characterized by early onset (<65 years old), increased severity, and autosomal dominant inheritance of mutations in amyloid precursor protein (APP), presenilin-1 (PS1), and PS2 (1). PS1 mutations, of which around 180 have been described, account for 80% of all FAD cases (2). There is wide clinical variability in PS1-FAD, including epileptic seizures and cerebellar ataxia. At the neuropathological level, brain tissue of PS1-FAD patients shows characteristic β-amyloid (Aβ) plaque morphology and localized damage such as cerebellar degeneration (3, 4). An interesting FAD mutation is PS1-E280A (E280A-FAD), which is present in a large kindred in Colombia with more than 5,000 members and around 600 affected individuals. Apart from common FAD symptoms, such as epilepsy and ataxia, E280A-FAD patients show typical clinical endophenotypes, including aphasia and variable age of onset (5). PS1 provides the catalytic core of the γ-secretase complex, which is involved in amyloidogenic processing of APP, which defines the length of the Aβ peptide (6, 7). PS1 mutations can increase the ratio of longer Aβ peptides, which are more prone to aggregation and show higher neurotoxicity (8). On the other hand, independent from its role in the γ-secretase complex, PS1 may contribute to several other functions, including protein turnover (9), autophagy (10), and ER Ca2+ regulation (11). Up to which point these functions participate in the pathogenesis of FAD remains to be elucidated.
The observation that Aβ deposits occur in the cerebellum of PS1-E280A patients showing cerebellar dysfunction raises the possibility that these two phenomena are causally related. Yet, in the early stages, cerebellar dysfunction might in principle also result from molecular changes and electrophysiological disturbances caused by early effects of the PS1-E280A mutation before its impact on Aβ deposition becomes apparent (3, 12, 13). Here, we report in a longitudinal study that the cerebellar endophenotype in PS1-E280A carriers is accompanied by specific Purkinje cell (PC) loss and mitochondrial damage. Biochemical characterization of PS1 mutants suggests that Ca2+ homeostasis and mitochondrial transport are affected. Finally, we show that these PS1 mutations can cause reduced PC activity and cerebellar motor dysfunction at an early stage, which is compatible with a potential role of altered Ca2+ influx independent of Aβ deposition.
Results
Cerebellar dysfunction in PS1-E280A carriers.
We have collected retrospectively clinical information from 135 E280A-FAD patients and 85 patients with sporadic AD (SAD) (Table 1). Cerebellar signs were highly prevalent in E280A-FAD patients (Figure 1A). Intention tremor and dysdiadochokinesia were the most common cerebellar signs in E280A-FAD patients (Figure 1B); these symptoms occurred significantly more frequently in E280A-FAD patients than in patients with SAD (P < 0.001) (Supplemental Table 1; supplemental material available online with this article; doi: 10.1172/JCI66407DS1). Thirty percent of E280A-FAD patients affected with cerebellar signs presented more than one sign. Furthermore, the presence of cerebellar signs did not correlate with age of onset of dementia or ApoE4 genotype status (Supplemental Figure 1A).
Table 1.
Clinical information from E280A-FAD patients and patients with SAD

Figure 1. Cerebellar ataxic phenotype in E280A-FAD patients.

(A) Prevalence of cerebellar signs in E280A-FAD patients (FAD, n = 135) against their prevalence in patients with SAD (n = 85). (B) Distribution of cerebellar signs among affected PS1-E280A patients (n = 64). (C) Cerebellar test performance in asymptomatic (aPS1, n = 10) and symptomatic (sPS1, n = 9) PS1-E280A carriers as well as age-matched healthy controls (Ctrl, n = 10). Bar graphs represent measurement of time to completion of 9-Hole Peg test with right hands and left hands (RH and LH). (D) PAT performances. Bar graphs for PAT shows sPS1 subjects with significantly more baseline errors. (E) sPS1 subjects showed less adaptation in PAT test than controls. Both groups of PS1-E280A carriers performed equally in the after-effect. *P < 0.05, data are mean ± SEM, 2-tailed t test. (F) Clinical progression of cerebellar dysfunction in PS1-E280A carriers. Predementia is portrayed in gray and dementia is portrayed in black alongside the timescale. Onset and duration of Aβ deposits in the cerebellum and seizures are depicted with a black arrow.
Given that PS1-E280A carriers show hippocampal and memory impairment starting in the third decade of life (5), we tested prospectively cerebellar dysfunction in both cognitive symptomatic/early stage of dementia carriers (sPS1) and asymptomatic carriers (aPS1); this categorization was clinically defined as reported earlier (ref. 14, Table 1, and Supplemental Table 2). During the 9-Hole Peg test, sPS1 subjects took significantly longer and made significantly more errors in sequence movements than both aPS1 subjects and normal controls (both P < 0.05) (Figure 1C and Supplemental Figure 1B). During the prism adaptation test (PAT), sPS1 subjects also performed worse than aPS1 subjects and controls, and they showed visible differences in horizontal displacement during throwing trials (Figure 1, D and E, and Supplemental Figure 1C), suggesting a stepwise decrement of adaptation. Since cerebellar Aβ deposition occurs in the last stage of Aβ pathology (15), in this cohort mostly from 55 years of age onward, postdating deposition in other subcortical structures (16), these data indicate that the early motor symptoms of cerebellar dysfunction start before Aβ deposition becomes prominent in the cerebellum (Figure 1F).
Cerebellar damage profile in E280A-FAD.
To assess cerebellar neurodegeneration in E280A-FAD patients, we investigated PCs in the cerebellar vermes of patients with E280A-FAD, patients with SAD, and healthy controls morphologically (Figure 2A, Table 1, and Supplemental Tables 3 and 4). There were significantly fewer PCs in patients with AD compared with those in controls (P < 0.001) and fewer PCs in patients with FAD compared with those in patients with SAD (P < 0.05) (Figure 2B). These differences remained when groups were adjusted for age (Supplemental Figure 2A). As previously described (12), both AD groups presented cerebellar Aβ plaques, but with higher Aβ1–42 levels in the E280A-FAD group, as detected by ELISA (Supplemental Figure 2, B and D), and only the E280A-FAD group showed relevant presence of hyperphosphorylated Tau (pTau) pathology in the cerebella (Supplemental Figure 2C). Finally, we performed ultrastructural analysis of PCs in E280A-FAD patients, patients with SAD, and controls. Around 800 mitochondria were assessed per patient; the presence of abnormal mitochondria was quantified according to defined criteria (see Methods). PCs from E280A-FAD patients showed substantially more abnormally condensed mitochondria. There was no spatial correlation to Aβ plaques, as they could not be observed near (≤250 μm) PCs (Supplemental Figure 2E). In SAD cases and controls, mitochondria presented only postmortem changes (Figure 2, C and D, and Supplemental Figure 2F). The abnormal morphology of mitochondria in PS1-E280A patients resembled mitophagy previously seen in the PC degeneration mouse (17). Thus, PS1-E280A carriers show a specific cerebellar endophenotype with clinical and morphological features of PC degeneration and mitochondrial damage, which may not be directly associated with Aβ plaque pathology.
Figure 2. Increased PC loss and abnormal mitochondria structure in PS1-E280A.

(A) Immunohistochemical analysis and quantification of PCs in cerebellar vermes of age-matched controls and patients with SAD and FAD (Ctrl and FAD, n = 10; SAD, n = 11) using calbindin antibody as a marker for PCs. Insets in microphotographs show high-magnification views of boxed areas. Scale bar: 100 μm. (B) There are fewer PCs in patients with AD compared with controls (P < 0.001) and fewer PCs in patients with FAD compared with patients with SAD (P < 0.05). *P < 0.05, **P < 0.01, data are mean ± SEM, Mann-Whitney U test. (C) Ultrastructural analysis of PCs of age-matched controls and patients with SAD and FAD (all groups n = 3, representative pictures) showing nuclei (outlined in light red) and surrounding mitochondria. Mitochondria of all groups show typical postmortem changes (swollen mitochondria, blurry cristae). Only E280A-FAD show pathological mitochondria filled with electron dense material resembling mitochondria undergoing mitophagy. Insets show mitochondria (arrows). Scale bar: 1 μm. (D) Percentage of abnormal mitochondria in analyzed groups. *P < 0.05, data are mean ± SEM, Mann-Whitney U test.
Decreased ER/mitochondria tethering in PCs of PS1-E280A cerebella.
Another noticeable feature in the ultrastructural analysis of PCs in PS1-E280A cerebella was that even morphologically normal mitochondria were rarely localized in close proximity to rough ER, which stands in marked contrast to their distribution in patients with SAD or controls (Figure 3A).When we performed colocalization analysis of mitochondrial marker voltage-dependent anion channel (VDAC1) with ER marker PDI (Figure 3B), only controls and patients with SAD showed significant ER/mitochondria colocalization (Figure 3, B and C; P < 0.01 for controls, P < 0.05 for SAD). Although both presenilins are present and active in mitochondria-associated membranes (18), defects in ER/mitochondria tethering were so far only linked to mutant PS2, but not to PS1, in cell culture (19).
Figure 3. Decreased ER/mitochondria interaction in PS1-E280A PCs.

(A) Ultrastructural analysis of PCs of age-matched controls and patients with SAD and FAD (all groups n = 3, representative pictures) showing nuclei (outlined in light red), mitochondria (light blue), and rough ER (light green). Boxes depict ER/mitochondria interfaces; higher magnification images of boxed areas are shown on the bottom row. E280A-FAD mitochondria show no evident direct interaction with rough ER. Scale bar: 100 nm. (B) Representative confocal fluorescent micrographs and corresponding scatter plots of PCs from controls (n = 3) and patients with SAD (n = 3) and FAD (n = 3) using mitochondrial marker VDAC1 (red) and ER marker PDI (green). Area within white boxes is shown at higher magnification for evaluated regions of interest, showing fewer labeled mitochondria and less ER colocalization in E280A-FAD. Scale bar: 20 μm. (C) Pearson’s r analysis of at least 12 PCs in 3 cases for controls and patients with SAD and FAD. Dotted line indicates Pearson’s r significance for colocalization for stated samples (n ≥ 12). *P < 0.05, **P < 0.01, data are mean ± SEM, Mann-Whitney U test.
Assessment of levels of proteins involved in mitochondrial function in the cerebella of E280A-FAD patients.
Subsequently, we assessed mitochondrial function indirectly by measuring steady-state levels of mitochondrial complexes, mitochondrial phospholipid levels, and steady-state levels of mitochondrial proteins involved in fusion, fission, and transport (Figure 4A and Supplemental Figure 3, A–C). Assembled levels of complex IV were decreased in patients with AD, with E280A-FAD patients showing lower levels than patients with SAD and controls (P < 0.05, P < 0.001). However, only SAD cases showed significantly decreased levels of complex I (P < 0.05) (Supplemental Figure 3A). These changes were not caused by gross alterations in phospholipid composition of mitochondrial membranes, as major phospholipids accumulated normally (Supplemental Figure 3B).
Figure 4. Mitochondrial dynamics and transport in cerebella of E280A-FAD patients.

(A) Representative Western blots of controls (n = 5) and patients with SAD (n = 10) and FAD (n = 10) for mitochondrial marker protein VDAC1 and proteins involved in mitochondrial fusion (OPA1 and MFN2), fission (pDRP1 and FIS1), and transport (MIRO1 and mitochondrial docking protein syntaphilin); actin is used as loading control. (B) Densitometric quantification of proteins in A normalized to actin. (C) Subcellular fractionations on Percoll density gradient and representative Western blot analyses of fractions from cerebella of controls (n = 4) and patients with SAD (n = 5) and FAD (n = 5). M, membranes; M-M, membranes and myelin; M-S, membranes and synaptosomes; S, synaptosomes; free Mito, free mitochondria. (D) Relative percentages of VDAC1, MIRO1, and KIF5C in synaptosomal-enriched and mitochondrial fractions of samples in C. *P < 0.05, **P < 0.01, data are mean ± SEM, Mann-Whitney U test.
To further examine mitochondrial function, we analyzed proteins involved in mitochondrial dynamics in cerebella of E280A-FAD patients, patients with SAD, and controls. Mitochondrial marker VDAC1 was unchanged (Figure 4, A and B). Mitochondrial fusion protein optic atrophy 1 (OPA1) was significantly lower in patients with AD than in controls (SAD P < 0.05; E280A-FAD P < 0.01). Mitochondrial fission protein 1 (FIS1) and PTEN-induced putative kinase 1 (PINK1) were significantly decreased in patients with SAD compared with E280A-FAD patients (P < 0.05). Adaptor protein mitochondrial Rho GTPase (MIRO1) was elevated in patients with SAD compared with E280A-FAD patients and controls (P < 0.05), and motor protein kinesin heavy chain isoform 5C (KIF5C) was lower in E280A-FAD patients, with some, but not all, E280A-FAD patients showing a dramatic decrease of both proteins. Neither the phosphorylated form of fission protein dynamin-related protein 1 (pDRP1), nor the mitochondrial fusion protein mitofusin 2 (MFN2) or mitochondrial anchor protein syntaphilin showed significant alterations (Figure 4, A and B).
Since KIF5C and MIRO1 interact in transport regulation of mitochondria (20) and since both proteins were significantly decreased in some E280A-FAD patients, we analyzed their presence in synapses by preparing synaptosomal fractions and fractions of mitochondria not attached to organelles (free mitochondria) from cerebella of E280A-FAD patients, patients with SAD, and controls (Supplemental Figure 4A). In synaptosomal-enriched fractions, we found higher contents of VDAC1 in controls compared with patients with AD (P < 0.05), with comparable contents of MIRO1 and elevated KIF5C in E280A-FAD patients compared with patients with SAD and controls (P < 0.05). Free mitochondria fractions showed higher contents of VDAC in patients with AD compared with controls (all P < 0.05), higher contents of MIRO1 in patients with SAD when compared with controls and E280A-FAD patients (all P < 0.05), and negligible contents of KIF5C in all groups (Figure 4, C and D). Decreased presence of mitochondria in synaptosomes of both AD groups and increased levels of MIRO1 in the free mitochondria fraction only in the SAD group suggest that MIRO1-mediated compensatory transport is only taking place in the SAD group. On the other hand, the increased presence of KIF5C in synaptosomes, together with low levels of MIRO1 in the free mitochondria fraction in E280A-FAD patients, may indicate a lack of mitochondrial trafficking. The presence of abnormal mitochondria, decreased ER/mitochondria tethering, and downregulation and redistribution of mitochondrial transport proteins in E280A-FAD patients raises the possibility that their Ca2+ homeostasis is affected
Decreased levels of Ca2+ channels in PS1-E280A carriers.
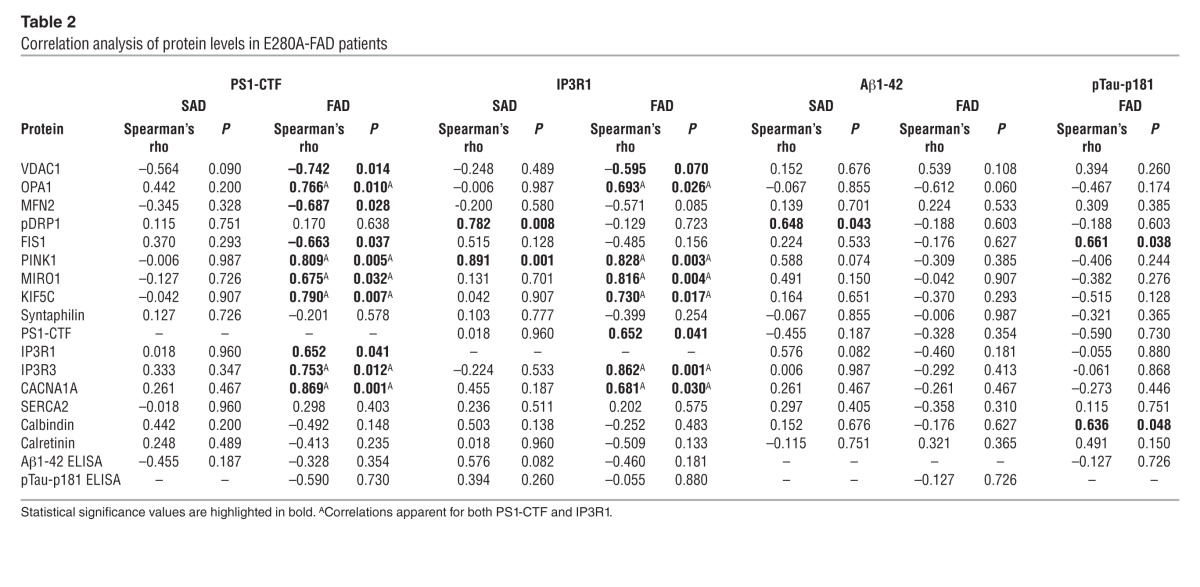
Regulation of mitochondrial transport in neurons is related with synaptic activity and depends mainly on 2 intracellular signals, ATP/ADP levels and intracellular Ca2+ concentration (21). Since MIRO1-KIF–dependent mitochondrial transport to the synapse is a Ca2+-modulated process (20) and presenilins have been shown to affect Ca2+ homeostasis in animal models (22), we measured steady-state levels of PS1 and proteins involved in Ca2+ homeostasis in the cerebella of our patients (Figure 5A). Levels of the C-terminal fragment of PS1 (PS1-CTF) were decreased and levels of Ca2+ channels, such as voltage-gated P/Q-type calcium channels (encoded by CACNA1A) and inositol 1,4,5-trisphosphate receptor type 1 and 3 (IP3R1 and IP3R3), were severely decreased in E280A-FAD patients (P < 0.05), while calbindin, a Ca2+-buffering protein, was increased (P < 0.05). Other Ca2+-related proteins, such as sarco/endoplasmic reticulum Ca2+-ATPase type 2 (SERCA2) and calretinin, were unaffected (Figure 5, A and B). Interestingly, PS1-CTF and IP3R3 levels correlated with mitochondrial transport proteins and Ca2+ channels only in E280A-FAD patients. Neither Aβ nor pTau-p181 levels correlated with decreased proteins in E280A-FAD patients (Table 2).
Figure 5. Ca2+ deregulation leads to decreased expression of Ca2+ channels together with mitochondrial abnormal redistribution in PS1-E280A.

(A) Representative Western blots of controls (n = 5) and patients with SAD (n = 10) and FAD (n = 10) for PS1-CTF and Ca2+-related proteins in cerebella, such as PS1-CTF, CACNA1A, IP3R1, IP3R3, calbindin, SERCA2, and calretinin. Actin was used as loading control. (B) Dot plots for densitometric quantification of proteins normalized to actin. IP3R3, CACNA1A, and calbindin showed statistically significant differences between patients with FAD and SAD (P < 0.05). *P < 0.05, data are mean ± SEM, Mann-Whitney U test.
Table 2.
Correlation analysis of protein levels in E280A-FAD patients
Altered mitochondrial distribution and ER tethering in a neural cell culture model of PS1-E280A.
PS1 affects modulation of Ca2+ stores (11), influencing activation of mitochondrial Ca2+ uptake and ER/mitochondria tethering (23). In addition, ER/mitochondria tethering is influenced by Ca2+ stress (24). To clarify the role of PS1 in mitochondrial distribution and transport, we expressed human wild-type PS1 (PS1WT), PS1E280A, and PS1 deletion Δ9 (PS1Δ9) in neural SH-SY5Y cells. ER/mitochondria tethering was evaluated under both basal conditions and Ca2+ overload induced by calcimycin. PS1WT cells showed ER/mitochondria colocalization under basal conditions (P < 0.05) and no colocalization after acute Ca2+ overload. Both PS1 mutations showed the opposite response, with no colocalization under basal conditions and increased colocalization after treatment (Figure 6, A and B; P < 0.05 for PS1-E280A). In addition, we evaluated mitochondrial transport under basal conditions in transfected cells. PS1-E280A showed significantly elevated mitochondrial mobility when compared with PS1WT (Figure 6, C and D; P < 0.05). This might be favored by decreased cytosolic Ca2+ levels (25) as a result of PS1-E280A–induced Ca2+ retention in Ca2+ stores. Since the disturbed Ca2+-related proteins in the PS1-E280A patients were observed at the end point of their chronic disease, these changes probably result from a long-term process. In order to assess the impact of chronic Ca2+ overload on the key proteins IP3R1 and MIRO1, we treated transfected SH-SY5Y cells with calcimycin for 16 hours. Interestingly, PS1-E280A–transfected cells showed a significant decrease of IP3R1, and both PS1 mutants showed significantly altered levels of MIRO1 (P < 0.05) (Figure 6, E and F). Thus, the PS1-E280A mutation affects cellular mitochondrial distribution and generates a differential response to Ca2+ overload (for a summary of changes see Supplemental Table 5).
Figure 6. Altered ER/mitochondria tethering and transport in SH-SY5Y cells overexpressing PS1-E280A.

(A) Representative confocal fluorescent micrographs and scatter plots of SH-SY5Y cells transiently transfected with human wild-type PS1 (PS1WT), PS1 mutation E280A (PS1-E280A), and PS1 deletion Δ9 (PS1Δ9). Cells were labeled with MitoTracker Red and ER marker KDEL and evaluated under basal conditions (vehicle = DMSO) and Ca2+ overload (calcimycin 30 minutes). Scale bar: 10 μm. (B) Pearson’s r analysis of 30 cells in 3 independent experiments (PS1WT, PS1-E280A, and PS1Δ9). Dotted line indicates Pearson’s r significance for colocalization. Only PS1WT under basal conditions and PS1-E280A treated with calcimycin for 30 minutes showed significant colocalization. (C) Representative kymographs of SH-SY5Y cells transiently transfected with PS1WT, PS1-E280A, and PS1Δ9. Cells were labeled with MitoTracker Red and recorded for 4 minutes. (D) Mitochondrial mobility analysis expressed as percentage of mobile mitochondria. At least 12 kymographs were analyzed in 3 independent experiments. PS1-E280A SH-SY5Y cells showed increased mobility when compared with PS1WT cells. (E) Representative Western blots of SH-SY5Y cells transiently transfected with PS1WT, PS1-E280A, and PS1Δ9 for IP3R1 and MIRO1 proteins. Cells were treated for 16 hours with DMSO and calcimycin. (F) Densitometric quantification of IP3R1 and MIRO1 normalized to βIII tubulin in 3 independent experiments conducted in transfected SH-SY5Y cells. For IP3R1, only PS1-E280A showed statistically significant reduction between basal conditions and chronic Ca2+ overload. MIRO1 levels showed statistically significant differences in both PS1 mutants under basal and chronic Ca2+ overload conditions. *P < 0.05, data are mean ± SEM, Mann-Whitney U test.
Cerebellar dysfunction and abnormal PC activity in APPsw/PS1Δ9 mice.
As cerebellar Aβ occurs in the final stages of AD (15), whereas E280A-FAD patients showed early motor coordination deficits, it is possible that abnormal cerebellar activity patterns occur before plaque deposition, as suggested in the time line depicted in Figure 1. To investigate this hypothesis, we subjected APPsw/PS1Δ9 mice (26) to cerebellar behavioral and in vivo electrophysiological tests starting at week 22, when Aβ deposits are absent, PC loss is not yet apparent, and there are no dystrophic mitochondria (Figure 7, A and B). In the ErasmusLadder task, APPsw/PS1Δ9 mice showed deficits in both motor performance and learning (for Methods see refs. 27, 28). APPsw/PS1Δ9 mice showed significantly longer steptime values compared with controls both before (P < 0.001) and after (P < 0.01) a perturbation was introduced (Figure 7C). Also, APPsw/PS1Δ9 mice were not able to efficiently recognize and/or react to the provided cues meant to indicate that they should leave the shelter box, as the time they spent inside the box before the cue of departure was significantly longer than that of controls (Supplemental Figure 5A) (Supplemental Figure 5A). In addition, the percentage of escapes (unauthorized departures) was significantly higher for APPsw/PS1Δ9 mice than for the control group (Supplemental Figure 5B). Thus, APPsw/PS1Δ9 mice displayed a clear motor performance and motor learning deficit. Subsequently, we performed single-unit extracellular recordings of PCs in vivo in the cerebellar lobules (I–V) involved in locomotion. The regularity (CV2 value) of simple and complex spike activities of 22-week-old APPsw/PS1Δ9 mice was unaffected. However, they showed a significantly lower simple spike firing rate (P < 0.001, unpaired Student’s t test) (Figure 7, D and E), which has been linked to affected motor performance in other diseases as well (29, 30). Thus, a murine PS1-FAD model shows a cerebellar phenotype and altered PC activity from week 22 onward. Since we did not observe Aβ pathology until week 36, these data indicate early PCs dysfunction in PS1 mutants.
Figure 7. Cerebellar phenotype characterization in APP/PS1 mouse model.

(A) Immunohistochemical analysis of cerebella from representative APPsw/PS1Δ9 mice at 24 weeks old and 36 weeks old, using 6E10 antibody for detecting Aβ plaques and calbindin antibody as a PC marker. 36-week-old C57BL/6 mice were used as control. Only 36-week-old APPsw/PS1Δ9 mice showed scarce Aβ pathology. Scale bar: 100 μm. (B) Ultrastructural analysis of mitochondria (arrows) present in PCs from representative 24- and 36-week-old APPsw/PS1Δ9 mice. Dense abnormal mitochondria were observed in 36-week-old APPsw/PS1Δ9 mice. Scale bar: 1 μm. (C) Motor performance and cue discrimination parameters in APPsw/PS1Δ9 mice. The average steptimes (± SEM) were measured in 22- to 24-week-old controls (blue; n = 12) and APPsw/PS1Δ9 mice (red; n = 8) on the ErasmusLadder before (t5pre–t8pre) and after (t5post–t8post) perturbations were introduced during sessions 5 to 8. Both before and after the perturbations the steptimes were significantly longer in the mutants (**P < 0.01, ***P < 0.001, respectively; 1-way ANOVA test). (D and E) Extracellular PC activity in awake mice was studied in the cerebellar lobules involved in locomotion (i.e., lobules I–V). Average firing frequencies of both simple spikes and complex spikes measured in APPsw/PS1Δ9 mice (22 weeks of age, n = 35 cells) compared with controls (n = 25 cells). Frequency and regularity of simple spike firing and complex spike firing were measured in PCs. Note that the simple spike firing frequency was significantly lower in APPsw/PS1Δ9 mice, but regularity and complex spike firing frequency were not affected. *P < 0.001, data are mean ± SEM, unpaired Student’s t test.
Discussion
PS1-FAD mutations show variability in age of onset and clinical/neuropathological endophenotypes (3, 31). All pathogenic PS1-FAD mutations are thought to affect the Aβ42/40 ratio, explaining the AD phenotype. Nevertheless, not all PS1 mutations modify APP processing in the same way (8), and even contiguous mutations in PS1 sequence show different endophenotypes (3). Here, we describe a cerebellar endophenotype in a large cohort of PS1-E280A carriers, characterized by abnormal mitochondria; altered levels of Ca2+-regulating proteins, associated with abnormal levels and distribution of mitochondrial transport proteins; and ultimately, PC degeneration. Furthermore, we provide mechanistic insights from cell culture and murine studies linking this endophenotype to a disturbance in Ca2+ homeostasis, PC activity, and motor coordination deficits.
The endophenotype of PS1-E280A patients appears to be largely independent from Aβ depositions, because of four observations. First, in the initial stages of the disease, PS1-E280A carriers already showed deficits in cerebellar tests before Aβ deposition was likely to occur in the cerebella (15, 16). Second, in later stages of the disease, when cerebellar Aβ depositions are present, abnormal condensation of mitochondria resembling mitophagy occurred at sites distant from Aβ deposits. Third, there was no correlation of Aβ levels with alterations in Ca2+-related proteins in E280A-FAD. Fourth, temporal and spatial segregation of symptoms in the PS1-E280A carriers were replicated in a longitudinal study of APPsw/PS1Δ9 mice. Our data agree with the lack of a consistent correlation between cerebellar dysfunction and cerebellar Aβ plaque pathology found in other PS1-FAD mutations (3); only 2 (M139V and I143T) of 5 of the PS1-FAD mutations identified with cerebellar dysfunction present with both. Recently, a family presenting with early-onset dementia, cerebellar dysfunction, and cerebellar Aβ deposits was identified. However, aside from carrying a PS1 S170F mutation, the affected patients carried variant A58V of cathepsin D (32). Furthermore, E280A-FAD has shown previously altered Tau phosphorylation in the cerebellum causing pTau deposition (12). Nevertheless, we failed to see any correlation between pTau levels and the observed changes in mitochondrial proteins or Ca2+ channels in E280A-FAD patients, in contrast to some mechanisms previously suggested to be related to AD in general (33). Our results indicate that altered Ca2+ homeostasis in the cerebella of these patients might be yet another consequence, which does not necessarily depend on Aβ- or pTau-related processes. Finally, our data are in line with a study in which FAD-derived lymphoblasts showed altered ER Ca2+ homeostasis (34). However, in this lymphoblast study, PS1 E280G mutation showed preserved ER Ca2+ leak function. Given that PS1 mutations E280A and E280G have shown differences in their clinical presentations (3) and some of their molecular effects (35), it is likely that their impact on Ca2+ homeostasis differs as well.
In principle, each of the three dysfunctions observed in our study (altered Ca2+ homeostasis, mitochondrial dysfunction, and/or PC neurodegeneration) may contribute to both cerebellar motor performance and motor learning deficits in PS1-E280A carriers (30). In this respect, it is important to note that our neuropathological and biochemical studies in E280A-FAD patients were performed at the terminal stages of the neurodegenerative process. Our patient data showed that PS1-E280A leads to an upregulation of calcium buffers and a downregulation of Ca2+ channels, which together point toward a compensatory mechanism to decrease high intracellular Ca2+ levels in PS1-E280A, as reported for other PS1 mutations (36–38). IP3Rs and calbindin findings agree with previous in vitro data on Ca2+ homeostasis in PS1 mutants (39–41). In addition, the deregulation of CACNA1A in PS1-E280A carriers provides ample cues for cerebellar motor discoordination. Patients and mouse models suffering from mutations in CACNA1A (30, 42) and IP3R1 (43) present with ataxia. In fact, exactly like APPsw/PS1Δ9 mice, CACNA1A mouse mutants can present with reduced simple spike firing of their PCs, leading to ataxia (44).
With regard to potential mitochondrial dysfunction, our data provide evidence of reduced ER/mitochondria interaction (18) and disturbed Ca2+-dependent mitochondrial transport to the synapse in E280A-FAD possibly executed by MIRO1/KIF5C (20). Similar to recent findings in amyotrophic lateral sclerosis (45), mitochondria of PCs were abnormally condensed, resembling those undergoing mitophagy. PCs in the PC degeneration mouse, an ataxic mouse model, have shown accumulation of mitochondria undergoing mitophagy, similarly to findings in E280A-FAD (17). Decreased levels of PINK1 in cerebella of E280A-FAD patients provide further evidence for mitophagy (46). Interestingly, Ca2+-induced stress is one of the known triggers for mitophagy (47), and this might be independent of the controversially discussed role of PS1 in autophagy (10, 48). Previously, it has been suggested that Aβ can induce mitophagy in AD, most likely through dysregulation of mitochondrial dynamics (49). Yet, we did not find prominent changes in mitochondrial complexes, phospholipids, or mitochondrial fusion/fission proteins, suggesting that these mitochondrial processes, which in principle might be affected by elevated Aβ (50, 51), are relatively intact. Nevertheless, altered mitochondrial dynamics have been shown to contribute to cerebellar ataxia (52), with mitochondrial transport playing a key role in PC death. ER/mitochondria tethering is affected in E280A-FAD PCs, and PS1 mutations showed specific altered Ca2+-dependent mitochondrial dynamics and decreased levels of IP3R1 and MIRO1 in vitro, supporting a role for PS1 in ER/mitochondria Ca2+ homeostasis (18) and transport, without affecting phospholipid synthesis, as recently suggested (53). ER/mitochondria tethering has been shown to be upregulated in a mutant APP mouse model and was attributed to Aβ-induced stress (54). Given that in our experiments both PS1 mutations showed decreased ER/mitochondria tethering, which was only increased under Ca2+ overload, it is likely independent of Aβ stress. Both presenilins are known to affect IP3R3 gating (39), and mutant PS2 increases mitochondria ER interactions under basal conditions (19). In our experiments, mutant PS1 showed decreased ER/mitochondria tethering under basal conditions, hinting toward a differential role for presenilins in ER/mitochondria tethering. We observed differences in vitro between PS1-E280A and PS1Δ9 in ER/mitochondria tethering, transport, and IP3R1 and MIRO1 proteins levels. These differences may be attributed to loss (in some PS1 mutants) and gain (in PS1Δ9) of ERCa2+ leak function (11). However, it is likely that long-term disturbance of Ca2+homeostasis by PS1 mutations and PS1Δ9 results in similar cerebellar phenotypes, as observed in APPsw/PS1Δ9 mice.
Regarding PC neurodegeneration, cerebellar dysfunction in E280A-FAD patients is similar to that in patients suffering from PC loss due to other diseases, such as spinocerebellar ataxia type 2 (55), which has also been related to enhanced IP3R Ca2+ signaling (56). In contrast, the SAD cases in our study showed less PC loss in absence of motor coordination deficits. However, since the motor deficits and abnormal simple spike activity in the APPsw/PS1Δ9 mutants occurred before PCs started to die, it is parsimonious to hypothesize that PC loss does not contribute to the very initial stages of the cerebellar motor deficits in PS1-E280A carriers but worsens the symptoms later on. Patients with SAD have a lesser degree of PCs loss and none of the other findings at morphological and biochemical levels seen in PS1-E280A patients. Thus, it is possible that PC loss observed in patients with SAD is compensated for by functional reserve downstream in the cerebellar nuclei (30).
Taken together, we propose that PS1-E280A leads to at least two distinct effects. First, it induces Ca2+ deregulation, which in turn affects Ca2+-related proteins, and impairs mitochondrial/ER tethering and transport (Figure 8), causing abnormal activity of PCs and concomitantly deficits in cerebellar motor coordination (30). Second, it leads to an increased Aβ42/40 ratio and ultimately neurodegeneration (12). This is in line with other models proposing dual functions of PS1 mutations involving disturbed Ca2+ regulation in FAD (34). Currently, several models have been proposed for altered Ca2+ regulation by PS1 mutants (11), with one model suggesting Ca2+ leakage from the ER by a channel formed by PS1 multimers (38) and another model suggesting IP3R-altered gating as a result of its interaction with mutant PS1 (39). Our results are in line with both models, showing that Ca2+ dysregulation is a relevant event in pathophysiology of PS1-FAD patients; however, they do not favor one model over the other. Interestingly, altered Ca2+ homeostasis has also been reported for hippocampal neurons in PS1 mutant models (22). As E280A-FAD carriers also show epileptic seizures and hippocampal sclerosis (57) associated with dystrophic mitochondria (58), the consequences of Ca2+ deregulation may not be restricted to cerebellar PCs.
Figure 8. Model illustrating how PS1-E280A mutation may affect Ca2+ homeostasis and mitochondrial transport in cerebellar PCs.

This scheme depicts how PCs are similarly affected by Aβ in familial and sporadic AD. However, altered Ca2+ homeostasis due to PS1-E280A mutation promotes mitochondrial damage and impairs mitochondrial trafficking. Thus, in E280A-FAD, Aβ pathology, mitochondrial dysfunction, and abnormal levels of Ca2+-related proteins contribute to abnormal PC activity and cerebellar ataxia. Sequence of events may include altered Ca2+ ER modulation (no. 1), ER/mitochondria tethering (no. 2), mitochondrial degeneration (no. 3), and reduced mitochondrial transport (no. 4). mtPS1, mutant PS1.
Around 40% of PS1-E280A carriers with dementia suffer from seizures (57, 59). Importantly, in the vast majority of cases, these seizures start to occur after dementia onset (Supplemental Table 4 and ref. 57). Cerebellar toxic effects for anticonvulsants have been described mainly for phenytoin and carbamazepine after long-term chronic therapy (60, 61). Only 2 of 8 E280A-FAD patients treated for seizures were taking one of these drugs. The 2 FAD patients treated with phenytoin or carbamazepine were not distinct from the other E280A-FAD patients with regard to protein levels of markers for disturbed Ca2+ regulation (Supplemental Figure 4C). These facts, together with the appearance of cerebellar dysfunction before onset of dementia and seizures, argue against the possibility that anticonvulsant therapy forms the main cause of cerebellar ataxia in E280A-FAD. Since the PS1-E280A family has been selected for a clinical trial for AD prevention with a humanized antibody against oligomeric forms of Aβ (62), it will be interesting to find out to what extent this treatment will have success in controlling all aspects of cerebellar and extra-cerebellar pathophysiology of PS1-E280A. Our data raise the possibility that non-APP processing functions of PS1 play an underestimated role in PS1-FAD.
Methods
A detailed description of the methods is provided in the Supplemental Methods.
Clinical data
Retrospective analysis of clinical records from 220 patients with AD (Table 1 and Supplemental Table 1) was performed, including all registered medical and neurological evaluations. Patients were genotyped as previously described (63). Cerebellar signs were identified and assigned as present when two or more evaluations confirmed them. Ambiguous evaluations indicating other motor disturbances were excluded.
Behavioral tests
Twenty-nine subjects were tested for cerebellar function and grouped as follows: 9 PS1-E280A carriers showing cognitive impairment were classified as symptomatic (sPS1), 10 PS1-E280A carriers without cognitive impairment were classified as asymptomatic (aPS1) following previously described parameters (14), and, finally, 10 healthy subjects belonging to the PS1-E280A genealogies, without carrying the PS1-E280A mutation, were chosen as controls.
PAT
Motor performance was tested in 29 subjects (Supplemental Table 2), who threw clay balls (weight: 10 g) at a 12 cm by 12 cm cross drawn on a large sheet of parcel paper centered at shoulder level and placed 2 meters in front of them. Subjects were instructed to make each toss overhand during the whole experiment, to use the right hand, and to throw the balls to the location where they saw the target. They were seated with the head restrained in a device in which the prism was placed, and they had an unobstructed view of the target during the entire session. No directions about trunk, shoulder, or head/neck posture were given. However, they were not allowed to look down at their hands as they collected the next ball from a tray located next to them. Subjects were asked to throw the ball at their own pace, so they were free to rest if they felt tired. If such an event occurred, they were asked to remain as still as possible with their eyes closed. The experiment had 3 conditions. Under each condition the subjects threw 26 balls. During the baseline condition (PRE) subjects did not wear prisms. After finishing the baseline condition, subjects were tested in the PRISM condition, during which they wore 20-diopter optic prisms that produce a light refraction to the right. Once that condition was finished, subjects had the prisms removed and started the POS condition, during which they continued throwing balls. The position at which the balls made an impact on or around the target was marked immediately after each throw with a marker pen by an experimenter standing outside the visual field of the subject. The location of the ball impacts was plotted sequentially by trial number (abscissa) versus horizontal displacement (in centimeters) from a vertical line passing through the target center (ordinate). Impacts to the left of the target were plotted as negative values and impacts to the right were plotted as positive values. The 3 experimental conditions were carried out consecutively after the donning or doffing of the prisms was completed. Three additional measures were calculated from the collected data of both experiments. First, a motor performance coefficient (PQ), or called variable error (55, 64), was calculated from the baseline phase. To obtain the PQ, the horizontal errors (distance from each impact location to a vertical line passing through the target) of the PRE trials were measured. The PQ is the standard deviation obtained from these errors. Second, an adaptation magnitude was obtained by subtracting the horizontal distance to the target on the final throw from that on the initial throw while wearing the prisms (PRISM condition). Third, an after-effect measurement was defined as the horizontal distance of the ball’s impact to the target on the first throw after removing the prisms (55).
Nine-hole peg-board test
A modified version of the 9-hole peg-board test was applied (65). Using the Rolyan 9-Hole Peg Test Kit, 29 subjects (Supplemental Table 2) were seated at a table with the board, which includes a small, shallow container holding 9 pegs as well as 9 empty holes. After a start command, the patients had to pick up the 9 pegs, one by one, as quickly as possible and place them in the 9 holes, using a predetermined order. Once all pegs were placed in the holes, the subjects had to remove them as quickly as possible, one by one, following the same order used when picking them up, and place them into the shallow container. Both the dominant and nondominant hands were tested. If a patient dropped a peg off of the board or violated the order of placement or removal of the pegs, the examiner stopped the timer and counted that as a performance error. Then, the patient started the test once again from the beginning. Timing began when the first peg was picked up and ended when the last peg was placed into the shallow container, which was defined as the administration time.
Human subjects and samples
Demographic data of patients involved in cerebellar performance studies are summarized in Table 1 and demographic data of donors involved in postmortem studies are summarized in Supplemental Table 3. Formalin-fixed and frozen cerebellar tissues from patients with AD and controls were handled as previously described (12) and used for experiments according to availability and sample status (Supplemental Table 3).
Histological methods
Immunohistochemistry was performed on formalin-fixed, paraffin-embedded tissue, as previously described (12), of 30 human cerebellar vermis samples (Supplemental Table 3). Sections were cut (3–5 μm), deparaffinized, pretreated for antigen retrieval, and probed with mouse monoclonal calbindin antibody and anti-Aβ antibody (see antibody data in Supplemental Table 5). Primary antibodies were visualized using a standard diaminobenzidine streptavidin-biotin horseradish peroxidase method (Sigma-Aldrich). PCs were quantified in 3 different optical fields of 3 consecutive slides. The total number of PCs was divided by total measured length of the PC layer. Immunohistochemistry in mice tissue followed similar protocols using calbindin and 6E10 primary antibodies (Supplemental Table 5). For double-labeling immunofluorescence, floating thick sections (100 μm) from formalin-fixed cerebellar vermes from 9 individuals were prepared (Supplemental Table 3). Sections were bleached with a UV light for 1 hour. Then, sections were blocked in NH4Cl for 15 minutes, followed by overnight blocking in FBS 10% in PBST. Posteriorly, sections were incubated at 4°C overnight with anti-VDAC1 and anti-PDI monoclonal antibodies as primary antibodies (Supplemental Table 6). After washing in PBS, the sections were incubated in the dark for 45 minutes at room temperature with the cocktail of secondary antibodies diluted in the same vehicle solution as the primary antibodies. Negative controls included omission of primary antibodies. After washing in PBS, the sections were stained with a saturated solution of Sudan Black B (Armin Baack) for 30 minutes to block the autofluorescence of lipofuscin granules present in nerve cell bodies, rinsed in PBS, and washed in distilled water. Finally, sections were mounted with Fluoromount G (Southern Biotech), sealed, and dried overnight. Sections were visualized with the use of a Leica Confocal System TCS-SP2.
Ultrastructural analysis
Ultrastructural analysis was performed using glutaraldehyde-fixed cerebellar tissue from 9 patients and mice as previously described (12). Cerebellar tissues were fixed with glutaraldehyde and chrome-osmium, dehydrated in ethanol, and embedded in Epon 812 (Serva Electrophoresis GmbH). After polymerization, 1-μm-thick sections were cut, stained with toluidine blue, and checked for presence of amyloid plaques. To further process them for electron microscopy, relevant specimens were cut into 60- to 80-nm-thick sections, which were contrasted with uranyl acetate and lead solution. Sections were viewed under a LEO EM 912AB electron microscope (Zeiss). Criteria for defining autolytic postmortem changes were as follows: (a) rounded and swollen mitochondria, (b) loss of matrix, (c) disrupted cristae, and (d) amorphous densities inside mitochondria. Criteria for defining abnormal mitochondria, which resembled those undergoing mitophagy, were as follows: (a) shrunken mitochondria, (b) electron dense amorphous content, and (c) compacted cristae. The PCs that were evaluated for aberrant mitochondria did not contain senile plaques or were present in the microscopy field at magnifications used.
ELISA
Sandwich ELISA for Aβ40, Aβ42, and pTau-p181 was performed as recommended by the manufacturer (Invitrogen). Briefly, 100 mg snap-frozen tissue from frontal cortices and cerebella was homogenized in 800 μl of 5 M guanidine HCl/50 mM Tris HCl for Aβ solubilization. Homogenate was mixed for 4 hours at room temperature, diluted in phosphate-buffered saline/5% bovine serum albumin/0.03% Tween 20, and centrifuged at 16,000 g for 20 minutes at 4°C. Supernatant was collected and probed with the ELISA Kit for each antigen. Samples were measured at 450 nm in a Bio-tek μQuant spectrophotometer and expressed as ng/mg of total protein.
Analysis of mitochondrial preparation from human cerebellar tissue
For mitochondrial isolation, cerebellar tissue from patients (Supplemental Table 3) was cut into small pieces and homogenized with 10 strokes at 1,000 rpm in a motor-driven homogenizer (B. Braun, Biotech International). The crude homogenate was centrifuged at 1,000 g for 10 minutes, and mitochondria were pelleted by centrifugation of the supernatant at 8,000 g for 10 minutes and resuspended in freezing buffer. Protein concentration was determined using the Bradford protein assay. For mitochondrial complex determination, Blue-Native PAGE analysis was applied to crude mitochondria (100 μg) solubilized at a concentration of 2.5 mg/ml in solvation buffer supplemented with detergent (0.8% DDM). Mitochondrial extracts were loaded onto polyacrylamide gradient gels (3%–13%), and proteins were transferred onto a PVDF membrane. Alternatively, thin layer chromatographic analysis of mitochondrial phospholipids was performed after lipid extraction from crude mitochondria, and determination of the phosphate concentration of extracted lipids was performed as described earlier (66). Briefly, 15 nmol mitochondrial phospholipids were spotted on silica plates. The plates were developed in chloroform/methanol/25% (v/v) ammonia solution (50:50:3), and phospholipid spots were visualized by immersion in CuSO4 in 8.5% o-phosphoric acid and subsequent charring at 180°C.
Whole cerebellar tissue Western blot analysis
Proteins were isolated from human cerebella (vermes) from AD cases and controls (Supplemental Table 3). For this, 500 mg tissue was cut in small pieces, poured into a glass Dounce tissue grinder type B, and homogenized in 4 ml homogenizing buffer with 10 even strokes. The homogenate was centrifuged at 1,000 g for 10 minutes at 4°C. The supernatant was diluted with lysis buffer. Protein electrophoresis and immunoblot was performed as previously described (67). Briefly, once proteins were quantified, gel electrophoresis SDS-PAGE was carried out using a miniprotean system (Bio-Rad) with a molecular weight marker of standard range (Fermentas). Proteins (50 μg) were loaded into each well with loading buffer (0.375 M Tris, pH 6.8, 50% glycerol, 10% SDS, 0.5 M DTT, and 0.002% bromophenol blue) and heated to 95κC for 3 minutes before loading on the gel. After electrophoresis, proteins were transferred to nitrocellulose membranes (Bio-Rad) using an electrophoretic transfer system (Mini Trans-blot Electrophoretic Transfer Cell, Bio-Rad) at 350 mA for 2 hours. The membranes were incubated for 1 hour in 5% nonfat milk dissolved in TTBS (20 mM Tris, pH 7.5, 500 mM NaCl, 0.02% Tween-20). Then, the membranes were incubated overnight at 4°C with primary antibody (Supplemental Table 6). The membranes were washed with TTBS and incubated with secondary antibody (anti-IgG mouse or anti-rabbit IgG 1:2500, Invitrogen) coupled to horseradish peroxidase for 1 hour at room temperature. Immunoreactive signal was developed with the ECL Western Blotting Chemiluminescence System (SuperSignal West Pico Chemiluminescent Substrate, Pierce) and detected with a ChemiDoc System (Bio-Rad). Key proteins were tested in temporal cortex biopsies homogenized fresh and after 12 hours in order to assess the stability of proteins in the range of the postmortem times for samples used in the study (Supplemental Figure 3C). The images were analyzed using the quantification software ImageJ (version 1.45, NIH). All proteins were studied at least twice; the results of each sample were normalized with respect to the values of actin and compared among groups. To minimize interassay variation, the samples from all experimental groups were processed in parallel.
Synaptosomal and mitochondrial fractioning
The preparation of synaptosomes from human cerebellar tissue was done following the protocol described by Dunkley et al. (68) with some modifications. In brief, 1 g human cerebellum (vermis) was washed with ice-cold homogenizing buffer, cut in small pieces, and homogenized in 9 ml homogenizing buffer using a tissue grinder. The homogenate was centrifuged at 1,000 g for 10 minutes at 4°C. The supernatant (S1) was collected and diluted to 5.4 ml with homogenizing buffer. The S1 fraction was pipetted over a Percoll gradient (F1: 5%, F2: 10%, F3: 15%, F4: 28%) and centrifuged at 31,000 g for 5 minutes at 4°C in a 50 Ti rotor (Beckman Coulter). All fractions were collected and diluted with lysis buffer (150 mM NaCl, 20 mM Tris, pH 7.4, 1 mM EDTA, 10% Glycerol, 1% NP40) containing phosphatase and protease inhibitors (Roche). The protein content was determined using the bicinchoninic acid method (BCA Protein Assay Kit, Pierce). Fractions F1 to F5 were identified as membranes, membranes and myelin, membranes and synaptosomes, synaptosomes, and mitochondria. Western blot was performed, loading 60 μg protein per fraction, using VDAC1, MIRO1, syntaphilin, and PSD95 primary antibodies. Densitometric analysis was performed on the fractions assigning a value of 100% to the total sum of signal from all fractions.
Plasmids and cloning
Human PS1 cDNA was purchased from GeneCopeia (GenBank: L76517.1). PS1 cDNA was extracted from the shuttle vector with Bsp119I and blunted with Klenow polymerase, and the product was digested with XhoI. The cDNA was subcloned into the pcDNA3.1+/Zeo vector with or without GFP using the XhoI and EcoRV restriction sites. After cloning, the point mutation E280A was introduced by site-directed mutagenesis (QuikChange Lightning Site-Directed Mutagenesis Kit, Stratagene) of wild-type human PS1 cDNA using the primer 5′...CAGCTCAGGAGAGAAATGCAACGCTTTTTCCAGCTCTC...3′ and its exact inverse. The PS1 variant lacking amino acids 290–319 (PS1Δ9) was generated by PCR. Two fragments were amplified, the first flanking from 200 nt before the ORF up to the beginning of the exon 9 (primers F1 5′...AACAACTCCGCCCCATTGACGCAAATGGGCGGTAGGCG...3′ and 5′...CTTGTGACTCCCTTTCTGTGCAGGAGTAAATGAGAGCTGGA...3′) and the second from the start of the exon 10 up to 200 nt after the end of the ORF (primers F2 5′...TCCAGCTCTCATTTACTCCTGCACAGAAAGGGAGTCACAAG...3′ and 5′...CAGAATAGAAATGACACCTACTCAGACAATGCGATGC...3′). The fragments were purified using a PCR Purification Kit (Fermentas), and then a new PCR was performed using the F1 forward primer and the F2 reverse primer to homologize the halves. The product was amplified using the CloneJet system (Fermentas) following the recommendation of the manufacturer. The PS1Δ9 cDNA was subcloned into the pcDNA3.1+/Zeo vector using the XhoI and EcoRI restriction sites.
Ca2+ overload assays in SH-SY5Y cell culture
SH-SY5Y human neuroblastoma cells were grown in supplemented DMEM-F12 and were transiently transfected with pcDNA3.1+/Zeo-PS1wt, pcDNA3.1+/Zeo-PS1E280A, and pcDNA3.1+/Zeo-PS1Δ9 using Lipofectamine 2000 (Invitrogen) for 24 hours. Cultured cells were treated with 7 nM calcimycin (Sigma-Aldrich) for 30 minutes or 16 hours. DMSO was used as vehicle. After treatment, cells were incubated with 250 nM MitoTracker Red CMXRos (Invitrogen) for 30 minutes, washed, fixed, and permeabilized. For chronic Ca2+ overload assay, cells were transfected for 24 hours and then treated with calcimycin (7 nM) or DMSO for 16 hours. Cells were collected and incubated for 30 minutes in lysis buffer containing proteases and phosphatases inhibitors. Lysates were centrifuged at 18,000 g for 15 minutes, and supernatant was collected for experiments. Total protein concentration was evaluated with BCA assay, and samples were prepared for Western blotting as described for tissue samples.
Immunofluorescence in transfected SH-SY5Y
After 30 minutes of treatment with calcimycin, SH-SY5Y cells were incubated for 30 minutes with MitoTracker Red CMXRos, washed with PBS 3 times, and subsequently fixed with cooled 95% ethanol and 5% glacial acetic acid for 10 minutes. Fixed cells were washed 3 times and permeabilized with PBS and 0.2% Triton X-100 for 10 minutes. The cells were washed 3 times with PBS and incubated overnight with primary antibody (KDEL mouse monoclonal antibody 1:100, Invitrogen) diluted in incubation buffer (PBS, 0.3% Triton X-100, 1% BSA) at 4°C in a wet chamber. Then, the cells were washed 3 times with PBS and incubated with Alexa Fluor 350 secondary antibody (1:2,500, Invitrogen) diluted in incubation buffer for 1 hour. After the cells were washed 4 times with PBS, they were mounted on slides using Fluoromount-G (Southern Biotech). Cells were examined under a confocal microscope (Leica TCS SP5). Confocal images were analyzed individually to confirm the transfection and to observe the mitochondrial distribution. Cells incubated only with secondary antibodies were used as negative control.
Evaluation of mitochondrial transport in SH-SY5Y
SH-SY5Y cells were plated and transfected in 3-cm glass bottom cell cultures dishes and incubated for 30 minutes with MitoTracker red CMXRos. Cells were recorded live for 4 minutes using a spinning disc microscope (Perkin Elmer Ultraview Vox). Recordings were analyzed and mitochondrial movements were evaluated in single tracks for selected cells once successful transfection was assessed with GFP-positive fluorescence. At least 10 recordings obtained in 3 independent experiments were studied, and kymographs were prepared from each track using ImageJ software and the Kymograph plug-in. Finally, the number of movable mitochondria for each group was calculated as a percentage of total visible mitochondria.
Mouse model experiments
Animals.
The experiments were carried out in 20- to 36-week-old female APPswe/PS1dE9 (APPsw/PS1Δ9) transgenic mice and B6 controls (The Jackson Laboratory). The generation of the APP/PS1 mouse line was described previously (69).
Behavioral and motor studies in APPsw/PS1Δ9 mice.
APPsw/PS1Δ9 mice were tested with the ErasmusLadder, a fully automated test for detecting motor performance, associative motor learning deficits, and cognitive phenotypes and learning deficits in mouse models. The ErasmusLadder consists of a horizontal ladder in between 2 shelter boxes, which are equipped with 2 pressurized air outlets (Pneumax, 171E2B.T.A.0009) and a bright white LED spotlight in the roof (both light and air are used as cues for departure). The air outlets are also used to control the speed of the mouse and to prevent unauthorized departures (escape). The ladder has 2 × 37 rungs for the left and right side. All rungs are equipped with pressure sensors (produced at Erasmus MC), which are continuously monitored and can be used to register and analyze the walking pattern of the mouse instantaneously. Moreover, based upon the prediction of the walking pattern, the rungs can be moved up or down by a high-speed pneumatic slide (Pneumax, 2141.52.00.36.91) with a maximum of 13 mm at any moment. The computer system (National Instruments) that runs the real-time system to record sensor data adjusts air pressure, predicts future touches, calculates interventions, repositions slides, stores data, and operates in a fixed cycle of 2 milliseconds. Details regarding the device and its operations have been published previously (27). During the first 4 days (unperturbed sessions), mice were trained with the even-numbered rungs on the left side and the odd-numbered rungs on the right side in a descended position so as to create an alternated stepping pattern with 30 mm gaps. Mice were trained to walk the ladder for 72 runs per day. We calculated the number of missteps that were sensed by the descended rungs and the steptime, which is defined as the time needed to place one of the front paws from one rung to the other. Associative motor learning trials (perturbed sessions) started on day 5 using a 15-kHz tone (Voltcraft), which gradually increased over 20 milliseconds to 100 dB and lasted up to 300 milliseconds, as the conditioned stimulus, whereas a rising rung, which ascends 12 mm, was used as the unconditioned stimulus. The interstimulus interval was fixed on 285 milliseconds. To keep this time period constant, we observed the real-time speed of the mouse and calculated which rung would rise. Typically, mice learn to avoid being hit by the rung by increasing walking speed; consequently, mice will decrease their steptimes over time. Besides motor coordination deficits, estimated in terms of motor performance and associative motor learning parameters, the ErasmusLadder is capable of detecting cognitive phenotypes. Cognition is measured, determining the capability of mice to recognize the cues of departure (light or air) and to modify their reactions to the given cues, with the purpose of reducing their exposure to a stressful situation (avoidance discrimination) on the ladder, which is created by the presence of the unconditioned and conditioned stimuli during the perturbed sessions.
In vivo PC electrophysiology in APPsw/PS1Δ9 mice.
APPsw/PS1Δ9 mice (21.9 ± 0.3 weeks old) were surgically prepared for in vivo electrophysiological recordings. In short, mice were anesthetized, and an immobilizing construct holding a small magnet (4 × 4 × 2 mm) was placed on the frontal and parietal bones using Optibond (Kerr) and Charisma (Heraeus Kulzer) (70). A craniotomy was made in the interparietal bone, and a recording chamber was placed around it, allowing in vivo electrophysiological recordings (24). After at least 24 hours of recovery, mice were head-fixed, their bodies were restrained in a custom-made tube, and the extracellular PC activity was recorded using borosilicate glass single barrel (OD 2.0 mm, ID 1.16 mm) or double barrel pipettes (Septum Theta, OD 1.5 mm, ID 1.02 mm; both WPI) filled with 2 M NaCl for recordings, with the second barrel filled with 0.1% to 0.2% Alcian Blue solution. Electrodes were advanced into cerebellar lobules I–V by a hydraulic microdrive (Narishige). PCs were identified by the firing of complex spikes and were confirmed to be from a single unit by the presence of a pause after each complex spike (not different in APP/SP1 mutant vs. control mice; data not shown). The minimum recording duration was 120 seconds, and several dye injections, followed by histochemical analysis, confirmed that the recordings were from lobules I to V. Raw recorded signals were amplified, filtered (30 Hz to 10 kHz with notch filter, CyberAmp), digitized (Power 1401, CED), and stored for off-line analysis (sampled at 25 kHz, Spike2, CED). Analysis of in vivo extracellular PC recordings was performed using the Spike Train Toolbox (Neurasmus B.V., http://www.neurasmus.com) for Matlab (Mathworks). For each cell, the mean firing rate and mean and median CV2 were determined for simple and complex spikes. The CV2 value is a measurement of the regularity of the firing from spike to spike, calculated as the mean or median of 2 • | ISI(n + 1) – ISI(n) | / ISI(n + 1) + ISI(n), where ISI stands for the interspike interval and n stands for the ISI number.
Statistics
Data were tabulated in Microsoft Excel data sheets and analyzed using SPSS 17 statistical software (SPSS Inc.) or GraphPad Prism 5 (GraphPad Software). Data were analyzed for determining normal distribution with Kolmgorov-Smirnov and Shapiro-Wilk tests. Mean comparison of parametric variables was performed with 2-tailed Student’s t test and 1-way ANOVA. Nonparametric variables were studied with the Mann-Whitney U and Kruskal-Wallis test. Intensity colocalization analysis was performed using Pearson’s coefficient, and its significance was assigned according to the number of samples analyzed per group. Binomial variable comparison was performed using χ2 test. Correlation analyses for continuous variables were performed using Spearman’s rank coefficient. Statistical significance levels of all analyses were set at P < 0.05.
Study approval
All clinical records for retrospective analyses were obtained under signed consent from the patients or their families for participation in the follow-up of the E280A-FAD study. All living participants of the study signed informed consent for clinical examination, clinical data handling, and functional tests. Postmortem tissue was obtained after donor consent according to pertaining laws in Colombia, The Netherlands, and Germany and approved by local ethical boards, if appropriate, at the University of Antioquia in Medellin (Colombia) and the Netherlands Brain Bank in Amsterdam (The Netherlands). Animals used for this study were maintained under standard animal housing conditions in a 12-hour-dark/light cycle with free access to food and water. Animal care was in accordance with ethical guidelines (European Communities Council Directive 86/609/EEC) and approved by the local ethical committee (Erasmus).
Supplementary Material
Acknowledgments
This work was supported by ERA-Net Neuron (to D. Sepulveda-Falla, A. Barrera-Ocampo, I. Ferrer, and M. Glatzel); Landesexzellenzinitiative Hamburg — Neurodapt! (to D. Sepulveda-Falla and M. Glatzel); German Research Foundation grants FG885 and GRK1459 (to M. Glatzel) and SFB635 and FOR885 (to T. Langer); the European Research Council advanced grant 233078 (to T. Langer); the Dutch Organization for Medical Sciences (ZonMw; to C.I. De Zeeuw) and Life Sciences (to C.I. De Zeeuw); Erasmus University Rotterdam Fellowship (to M. Schonewille); Senter (Neuro-Bsik; to C.I. De Zeeuw); Prinses Beatrix Fonds (to C.I. De Zeeuw); ERC Advanced (to C.I. De Zeeuw); the SENSOPAC, CEREBNET, and C7 programs of the European Community (to C.I. De Zeeuw); BESAD-P – Spanish Ministry of Health (to I. Ferrer); and the Colombian COLCIENCIAS grant 111549326133 (to L. Velazquez-Perez, R. Rodriguez-Labrada, A. Villegas, and F. Lopera). Special thanks go to the Mouse Pathology Core Facility of the University Medical Center Hamburg-Eppendorf (Melanie Neumann), the University Medical Center Hamburg-Eppendorf Microscopic Imaging Facility, Paul Saftig for the modified MEF cells, Carlos Tobón for cerebellar behavioral tests assistance, Natalia Acosta-Baena for clinical data collection for patients with FAD, and Juan Fernández-Ruiz (Universidad Nacional Autónoma de México, Mexico) for PAT facilitation.
Footnotes
Conflict of interest: The authors have declared that no conflict of interest exists.
Citation for this article:J Clin Invest. 2014;124(4):1552–1567. doi:10.1172/JCI66407.
References
- 1.Querfurth HW, LaFerla FM. Alzheimer’s disease. N Engl J Med. 2010;362(14):329–344. doi: 10.1056/NEJMra0909142. [DOI] [PubMed] [Google Scholar]
- 2.van der Flier WM, Pijnenburg YA, Fox NC, Scheltens P. Early-onset versus late-onset Alzheimer’s disease: the case of the missing APOE varepsilon4 allele. Lancet Neurol. 2011;10(3):280–288. doi: 10.1016/S1474-4422(10)70306-9. [DOI] [PubMed] [Google Scholar]
- 3.Larner AJ, Doran M. Clinical phenotypic heterogeneity of Alzheimer’s disease associated with mutations of the presenilin-1 gene. J Neurol. 2006;253(2):139–158. doi: 10.1007/s00415-005-0019-5. [DOI] [PubMed] [Google Scholar]
- 4.Shepherd C, McCann H, Halliday GM. Variations in the neuropathology of familial Alzheimer’s disease. Acta Neuropathol. 2009;118(1):37–52. doi: 10.1007/s00401-009-0521-4. [DOI] [PubMed] [Google Scholar]
- 5.Sepulveda-Falla D, Glatzel M, Lopera F. Phenotypic profile of early-onset familial Alzheimer’s disease caused by presenilin-1 E280A mutation. J Alzheimers Dis. 2012;32(1):1–12. doi: 10.3233/JAD-2012-120907. [DOI] [PubMed] [Google Scholar]
- 6.De Strooper B, et al. A presenilin-1-dependent γ-secretase-like protease mediates release of Notch intracellular domain. Nature. 1999;398(6727):518–522. doi: 10.1038/19083. [DOI] [PubMed] [Google Scholar]
- 7.Wolfe MS, Xia W, Ostaszewski BL, Diehl TS, Kimberly WT, Selkoe DJ. Two transmembrane aspartates in presenilin-1 required for presenilin endoproteolysis and γ-secretase activity. Nature. 1999;398(6727):513–517. doi: 10.1038/19077. [DOI] [PubMed] [Google Scholar]
- 8.Chavez-Gutierrez L, et al. The mechanism of γ-secretase dysfunction in familial Alzheimer disease. EMBO J. 2012;31(10):2261–2274. doi: 10.1038/emboj.2012.79. [DOI] [PMC free article] [PubMed] [Google Scholar]
- 9.Wilson CA, Murphy DD, Giasson BI, Zhang B, Trojanowski JQ, Lee VM. Degradative organelles containing mislocalized alpha-and beta-synuclein proliferate in presenilin-1 null neurons. J Cell Biol. 2004;165(3):335–346. doi: 10.1083/jcb.200403061. [DOI] [PMC free article] [PubMed] [Google Scholar]
- 10.Lee JH, et al. Lysosomal proteolysis and autophagy require presenilin 1 and are disrupted by Alzheimer-related PS1 mutations. Cell. 2010;141(7):1146–1158. doi: 10.1016/j.cell.2010.05.008. [DOI] [PMC free article] [PubMed] [Google Scholar]
- 11.Bezprozvanny I, Mattson MP. Neuronal calcium mishandling and the pathogenesis of Alzheimer’s disease. Trends Neurosci. 2008;31(9):454–463. doi: 10.1016/j.tins.2008.06.005. [DOI] [PMC free article] [PubMed] [Google Scholar]
- 12.Sepulveda-Falla D, et al. Deposition of hyperphosphorylated tau in cerebellum of PS1 E280A Alzheimer’s disease. Brain Pathol. 2011;21(4):452–463. doi: 10.1111/j.1750-3639.2010.00469.x. [DOI] [PMC free article] [PubMed] [Google Scholar]
- 13.Matilla-Duenas A, Corral-Juan M, Volpini V, Sanchez I. The spinocerebellar ataxias: clinical aspects and molecular genetics. Adv Exp Med Biol. 2012;724:351–374. doi: 10.1007/978-1-4614-0653-2_27. [DOI] [PubMed] [Google Scholar]
- 14.Acosta-Baena N, et al. Pre-dementia clinical stages in presenilin 1 E280A familial early-onset Alzheimer’s disease: a retrospective cohort study. Lancet Neurol. 2011;10(3):213–220. doi: 10.1016/S1474-4422(10)70323-9. [DOI] [PubMed] [Google Scholar]
- 15.Thal DR, Rüb U, Orantes M, Braak H. Phases of Aβ-deposition in the human brain and its relevance for the development of AD. Neurology. 2002;58(12):1791–1800. doi: 10.1212/WNL.58.12.1791. [DOI] [PubMed] [Google Scholar]
- 16.Fleisher AS, et al. Florbetapir PET analysis of amyloid-β deposition in the presenilin 1 E280A autosomal dominant Alzheimer’s disease kindred: a cross-sectional study. Lancet Neurol. 2012;11(12):1057–1065. doi: 10.1016/S1474-4422(12)70227-2. [DOI] [PMC free article] [PubMed] [Google Scholar]
- 17.Chakrabarti L, Eng J, Ivanov N, Garden GA, La Spada AR. Autophagy activation and enhanced mitophagy characterize the Purkinje cells of pcd mice prior to neuronal death. Mol Brain. 2009;2:24. doi: 10.1186/1756-6606-2-24. [DOI] [PMC free article] [PubMed] [Google Scholar]
- 18.Area-Gomez E, et al. Presenilins are enriched in endoplasmic reticulum membranes associated with mitochondria. Am J Pathol. 2009;175(5):1810–1816. doi: 10.2353/ajpath.2009.090219. [DOI] [PMC free article] [PubMed] [Google Scholar]
- 19.Zampese E, Fasolato C, Kipanyula MJ, Bortolozzi M, Pozzan T, Pizzo P. Presenilin 2 modulates endoplasmic reticulum (ER)-mitochondria interactions and Ca2+ cross-talk. Proc Natl Acad Sci U S A. 2011;108(7):2777–2782. doi: 10.1073/pnas.1100735108. [DOI] [PMC free article] [PubMed] [Google Scholar]
- 20.MacAskill AF, et al. Miro1 is a calcium sensor for glutamate receptor-dependent localization of mitochondria at synapses. Neuron. 2009;61(4):541–555. doi: 10.1016/j.neuron.2009.01.030. [DOI] [PMC free article] [PubMed] [Google Scholar]
- 21.Sheng ZH, Cai Q. Mitochondrial transport in neurons: impact on synaptic homeostasis and neurodegeneration. Nat Rev Neurosci. 2012;13(2):77–93. doi: 10.1038/nrn3156. [DOI] [PMC free article] [PubMed] [Google Scholar]
- 22.Zhang H, Sun S, Herreman A, De Strooper B, Bezprozvanny I. Role of presenilins in neuronal calcium homeostasis. J Neurosci. 2010;30(25):8566–8580. doi: 10.1523/JNEUROSCI.1554-10.2010. [DOI] [PMC free article] [PubMed] [Google Scholar]
- 23.Rizzuto R, De Stefani D, Raffaello A, Mammucari C. Mitochondria as sensors and regulators of calcium signalling. Nat Rev Mol Cell Biol. 2012;13(9):566–78. doi: 10.1038/nrm3412. [DOI] [PubMed] [Google Scholar]
- 24.Bravo R, et al. Increased ER-mitochondrial coupling promotes mitochondrial respiration and bioenergetics during early phases of ER stress. J Cell Sci. 2011;124(pt 13):2143–2152. doi: 10.1242/jcs.080762. [DOI] [PMC free article] [PubMed] [Google Scholar]
- 25.Wang X, Schwarz TL. The mechanism of Ca2+-dependent regulation of kinesin-mediated mitochondrial motility. Cell. 2009;136(1):163–174. doi: 10.1016/j.cell.2008.11.046. [DOI] [PMC free article] [PubMed] [Google Scholar]
- 26.Duyckaerts C, Potier MC, Delatour B. Alzheimer disease models and human neuropathology: similarities and differences. Acta Neuropathol. 2008;115(1):5–38. doi: 10.1007/s00401-007-0312-8. [DOI] [PMC free article] [PubMed] [Google Scholar]
- 27.Van Der Giessen RS, et al. Role of olivary electrical coupling in cerebellar motor learning. Neuron. 2008;58(4):599–612. doi: 10.1016/j.neuron.2008.03.016. [DOI] [PubMed] [Google Scholar]
- 28.Vinueza Veloz MF, et al. The effect of an mGluR5 inhibitor on procedural memory and avoidance discrimination impairments in Fmr1 KO mice. Genes Brain Behav. 2012;11(3):325–331. doi: 10.1111/j.1601-183X.2011.00763.x. [DOI] [PMC free article] [PubMed] [Google Scholar]
- 29.Coesmans M, et al. Mechanisms underlying cerebellar motor deficits due to mGluR1-autoantibodies. Ann Neurol. 2003;53(3):325–336. doi: 10.1002/ana.10451. [DOI] [PubMed] [Google Scholar]
- 30.De Zeeuw CI, Hoebeek FE, Bosman LW, Schonewille M, Witter L, Koekkoek SK. Spatiotemporal firing patterns in the cerebellum. Nat Rev Neurosci. 2011;12(6):327–344. doi: 10.1038/nrn3011. [DOI] [PubMed] [Google Scholar]
- 31.Ryan NS, Rossor MN. Correlating familial Alzheimer’s disease gene mutations with clinical phenotype. Biomark Med. 2010;4(1):99–112. doi: 10.2217/bmm.09.92. [DOI] [PMC free article] [PubMed] [Google Scholar]
- 32.Ehling R, et al. Cerebellar dysfunction in a family harboring the PSEN1 mutation co-segregating with a Cathepsin D variant p.A58V. J Neurol Sci. 2013;326(1–2):75–82. doi: 10.1016/j.jns.2013.01.017. [DOI] [PubMed] [Google Scholar]
- 33.Yu JT, Chang RC, Tan L. Calcium dysregulation in Alzheimer’s disease: from mechanisms to therapeutic opportunities. Prog Neurobiol. 2009;89(3):240–255. doi: 10.1016/j.pneurobio.2009.07.009. [DOI] [PubMed] [Google Scholar]
- 34.Nelson O, Supnet C, Liu H, Bezprozvanny I. Familial Alzheimer’s disease mutations in presenilins: effects on endoplasmic reticulum calcium homeostasis and correlation with clinical phenotypes. J Alzheimers Dis. 2010;21(3):781–793. doi: 10.3233/JAD-2010-100159. [DOI] [PMC free article] [PubMed] [Google Scholar]
- 35.Marambaud P, et al. A CBP binding transcriptional repressor produced by the PS1/epsilon-cleavage of N-cadherin is inhibited by PS1 FAD mutations. Cell. 2003;114(5):635–645. doi: 10.1016/j.cell.2003.08.008. [DOI] [PubMed] [Google Scholar]
- 36.Cheung K, et al. Mechanism of Ca2+ disruption in Alzheimer’s disease by presenilin regulation of InsP3 receptor channel gating. . Neuron. 2008;58(6):871–883. doi: 10.1016/j.neuron.2008.04.015. [DOI] [PMC free article] [PubMed] [Google Scholar]
- 37.Green KN, et al. SERCA pump activity is physiologically regulated by presenilin and regulates amyloid beta production. J Cell Biol. 2008;181(7):1107–1116. doi: 10.1083/jcb.200706171. [DOI] [PMC free article] [PubMed] [Google Scholar]
- 38.Tu H, et al. Presenilins form ER Ca2+ leak channels, a function disrupted by familial Alzheimer’s disease-linked mutations. Cell. 2006;126(5):981–993. doi: 10.1016/j.cell.2006.06.059. [DOI] [PMC free article] [PubMed] [Google Scholar]
- 39.Cheung K, et al. Gain-of-function enhancement of IP3 receptor modal gating by familial Alzheimer’s disease-linked presenilin mutants in human cells and mouse neurons. Sci Signal. 2010;3(114):ra22. doi: 10.1126/scisignal.2000818. [DOI] [PMC free article] [PubMed] [Google Scholar]
- 40.Annaert W. Novel research horizons for presenilins and gamma-secretases in cell biology and disease. Annu Rev Cell Dev Biol. 2010;26:235–260. doi: 10.1146/annurev-cellbio-100109-104117. [DOI] [PubMed] [Google Scholar]
- 41.Odero GL, et al. Evidence for the involvement of calbindin D28k in the presenilin 1 model of Alzheimer’s disease. Neuroscience. 2010;169(1):532–543. doi: 10.1016/j.neuroscience.2010.04.004. [DOI] [PubMed] [Google Scholar]
- 42.Hoebeek FE, et al. Increased noise level of purkinje cell activities minimizes impact of their modulation during sensorimotor control. Neuron. 2005;45(6):953–965. doi: 10.1016/j.neuron.2005.02.012. [DOI] [PubMed] [Google Scholar]
- 43.Bezprozvanny I. Role of inositol 1,4,5-trisphosphate receptors in pathogenesis of Huntington’s disease and spinocerebellar ataxias. Neurochem Res. 2011;36(7):1186–1197. doi: 10.1007/s11064-010-0393-y. [DOI] [PMC free article] [PubMed] [Google Scholar]
- 44.Gao Z, et al. Cerebellar ataxia by enhanced Ca(V)2.1 currents is alleviated by Ca2+-dependent K+-channel activators in Cacna1a(S218L) mutant mice. J Neurosci. 2012;32(44):15533–15546. doi: 10.1523/JNEUROSCI.2454-12.2012. [DOI] [PMC free article] [PubMed] [Google Scholar]
- 45.Morotz GM, De Vos KJ, Vagnoni A, Ackerley S, Shaw CE, Miller CC. Amyotrophic lateral sclerosis-associated mutant VAPBP56S perturbs calcium homeostasis to disrupt axonal transport of mitochondria. Hum Mol Genet. 2012;21(9):1979–1988. doi: 10.1093/hmg/dds011. [DOI] [PMC free article] [PubMed] [Google Scholar]
- 46.Dagda RK, Kulich SM, Tandon A, Park D, Chu CT. Loss of PINK1 function promotes mitophagy through effects on oxidative stress and mitochondrial fission. J Biol Chem. 2009;284(20):13843–13855. doi: 10.1074/jbc.M808515200. [DOI] [PMC free article] [PubMed] [Google Scholar]
- 47.Gottlieb RA, Carreira RS. Autophagy in health and disease. 5. Mitophagy as a way of life. Am J Physiol Cell. 2010;299(2):C203–C210. doi: 10.1152/ajpcell.00097.2010. [DOI] [PMC free article] [PubMed] [Google Scholar]
- 48.Zhang X, et al. A role for presenilins in autophagy revisited: Normal acidification of lysosomes in cells lacking PSEN1 and PSEN2. J Neurosci. 2012;32(25):8633–8648. doi: 10.1523/JNEUROSCI.0556-12.2012. [DOI] [PMC free article] [PubMed] [Google Scholar]
- 49.Santos RX, et al. Alzheimer’s disease: diverse aspects of mitochondrial malfunctioning. Int J Clin Exp Pathol. 2010;3(6):570–581. [PMC free article] [PubMed] [Google Scholar]
- 50.Rhein V, et al. Amyloid-beta and tau synergistically impair the oxidative phosphorylation system in triple transgenic Alzheimer’s disease mice. Proc Natl Acad Sci U S A. 2009;106(47):20057–20062. doi: 10.1073/pnas.0905529106. [DOI] [PMC free article] [PubMed] [Google Scholar]
- 51.Wang X, et al. Impaired balance of mitochondrial fission and fusion in Alzheimer’s disease. J Neurosci. 2009;29(28):9090–9103. doi: 10.1523/JNEUROSCI.1357-09.2009. [DOI] [PMC free article] [PubMed] [Google Scholar]
- 52.Girard M, et al. Mitochondrial dysfunction and Purkinje cell loss in autosomal recessive spastic ataxia of Charlevoix-Saguenay (ARSACS). Proc Natl Acad Sci U S A. 2012;109(5):1661–1666. doi: 10.1073/pnas.1113166109. [DOI] [PMC free article] [PubMed] [Google Scholar]
- 53.Area-Gomez E, et al. Upregulated function of mitochondria-associated ER membranes in Alzheimer disease. EMBO J. 2012;31(21):4106–4123. doi: 10.1038/emboj.2012.202. [DOI] [PMC free article] [PubMed] [Google Scholar]
- 54.Hedskog L, et al. Modulation of the endoplasmic reticulum-mitochondria interface in Alzheimer’s disease and related models. Proc Natl Acad Sci U S A. 2013;110(19):7916–7921. doi: 10.1073/pnas.1300677110. [DOI] [PMC free article] [PubMed] [Google Scholar]
- 55.Fernandez-Ruiz J, et al. Prism adaptation in spinocerebellar ataxia type 2. Neuropsychologia. 2007;45(12):2692–2698. doi: 10.1016/j.neuropsychologia.2007.04.006. [DOI] [PubMed] [Google Scholar]
- 56.Kasumu AW, Liang X, Egorova P, Vorontsova D, Bezprozvanny I. Chronic suppression of inositol 1,4,5-triphosphate receptor-mediated calcium signaling in cerebellar purkinje cells alleviates pathological phenotype in spinocerebellar ataxia 2 mice. J Neurosci. 2012;32(37):12786–12796. doi: 10.1523/JNEUROSCI.1643-12.2012. [DOI] [PMC free article] [PubMed] [Google Scholar]
- 57.Velez-Pardo C, Arellano JI, Cardona-Gomez P, Jimenez DR, Lopera F, De Felipe J. CA1 hippocampal neuronal loss in familial Alzheimer’s disease presenilin-1 E280A mutation is related to epilepsy. Epilepsia. 2004;45(7):751–756. doi: 10.1111/j.0013-9580.2004.55403.x. [DOI] [PubMed] [Google Scholar]
- 58.Velez-Pardo C, Arroyave ST, Lopera F, Castano AD, Jimenez DR. Ultrastructure evidence of necrotic neural cell death in familial Alzheimer’s disease brains bearing presenilin-1 E280A mutation. J Alzheimers Dis. 2001;3(4):409–415. doi: 10.3233/jad-2001-3408. [DOI] [PubMed] [Google Scholar]
- 59.Lopera F, et al. Clinical features of early-onset Alzheimer disease in a large kindred with an E280A presenilin-1 mutation. JAMA. 1997;277(10):793–799. doi: 10.1001/jama.1997.03540340027028. [DOI] [PubMed] [Google Scholar]
- 60.Manto M, Marmolino D. Cerebellar ataxias. Curr Opin Neurol. 2009;22(4):419–429. doi: 10.1097/WCO.0b013e32832b9897. [DOI] [PubMed] [Google Scholar]
- 61.Shanmugarajah P, et al. Phenytoin and cerebellar ataxia: not all down to toxicity? J Neurol Neurosurg Psychiatry. 2013;84:e2. [Google Scholar]
- 62.Wadman M. US government sets out Alzheimer’s plan. Nature. 2012;485(7399):426–427. doi: 10.1038/485426a. [DOI] [PubMed] [Google Scholar]
- 63.Pastor P, et al. Apolipoprotein Eepsilon4 modifies Alzheimer’s disease onset in an E280A PS1 kindred. Ann Neurol. 2003;54(2):163–169. doi: 10.1002/ana.10636. [DOI] [PubMed] [Google Scholar]
- 64.Velazquez-Perez L, et al. Motor decline in clinically presymptomatic spinocerebellar ataxia type 2 gene carriers. PLoS One. 2009;4(4):e5398. doi: 10.1371/journal.pone.0005398. [DOI] [PMC free article] [PubMed] [Google Scholar]
- 65.Oxford GK, Vogel KA, Le V, Mitchell A, Muniz S, Vollmer MA. Adult norms for a commercially available Nine Hole Peg Test for finger dexterity. Am J Occup Ther. 2003;57(5):570–573. doi: 10.5014/ajot.57.5.570. [DOI] [PubMed] [Google Scholar]
- 66.Rouser G, Fkeischer S, Yamamoto A. Two dimensional then layer chromatographic separation of polar lipids and determination of phospholipids by phosphorus analysis of spots. Lipids. 1970;5(5):494–496. doi: 10.1007/BF02531316. [DOI] [PubMed] [Google Scholar]
- 67.Altmeppen HC, et al. Lack of a-disintegrin-and-metalloproteinase ADAM10 leads to intracellular accumulation and loss of shedding of the cellular prion protein in vivo. Mol Neurodegener. 2011;6:36. doi: 10.1186/1750-1326-6-36. [DOI] [PMC free article] [PubMed] [Google Scholar]
- 68.Dunkley PR, Jarvie PE, Robinson PJ. A rapid Percoll gradient procedure for preparation of synaptosomes. Nat Protoc. 2008;3(11):1718–1728. doi: 10.1038/nprot.2008.171. [DOI] [PubMed] [Google Scholar]
- 69.Jankowsky JL, Slunt HH, Gonzales V, Jenkins NA, Copeland NG, Borchelt DR. APP processing and amyloid deposition in mice haplo-insufficient for presenilin 1. Neurobiol. 2004;25(7):885–892. doi: 10.1016/j.neurobiolaging.2003.09.008. [DOI] [PubMed] [Google Scholar]
- 70.Schonewille M, et al. Purkinje cell-specific knockout of the protein phosphatase PP2B impairs potentiation and cerebellar motor learning. Neuron. 2010;67(4):618–628. doi: 10.1016/j.neuron.2010.07.009. [DOI] [PMC free article] [PubMed] [Google Scholar]
Associated Data
This section collects any data citations, data availability statements, or supplementary materials included in this article.