

Abstract
Genetic studies have identified common variants within the intergenic region (HBS1L-MYB) between GTP-binding elongation factor HBS1L and myeloblastosis oncogene MYB on chromosome 6q that are associated with elevated fetal hemoglobin (HbF) levels and alterations of other clinically important human erythroid traits. It is unclear how these noncoding sequence variants affect multiple erythrocyte characteristics. Here, we determined that several HBS1L-MYB intergenic variants affect regulatory elements that are occupied by key erythroid transcription factors within this region. These elements interact with MYB, a critical regulator of erythroid development and HbF levels. We found that several HBS1L-MYB intergenic variants reduce transcription factor binding, affecting long-range interactions with MYB and MYB expression levels. These data provide a functional explanation for the genetic association of HBS1L-MYB intergenic polymorphisms with human erythroid traits and HbF levels. Our results further designate MYB as a target for therapeutic induction of HbF to ameliorate sickle cell and β-thalassemia disease severity.
Introduction
Approximately half of our blood volume is made up of erythrocytes, providing the oxygen and carbon dioxide transport necessary for cellular respiration throughout the body. Erythroid parameters (e.g., red blood cell count [RBC], mean cell volume [MCV], and mean cell hemoglobin [MCH] content) are routinely used for the diagnosis and monitoring of a wide range of disorders as well as overall human health. Significant variation in these parameters, which is highly heritable, occurs among humans (1, 2). Genome-wide association studies (GWAS) and other studies have investigated the genetic basis of variation in erythroid and other hematological traits within different ethnic populations. As observed in the majority of association studies, some genome-wide, sequence variants modulating human traits are predominantly located in noncoding regions of the genome (3), complicating the functional interpretation of their effects. A set of common intergenic SNPs at chromosome 6q23 has been consistently identified as highly associated with clinically important human erythroid traits (4–13) (Table 1). Prominent among these traits is the persistence of fetal hemoglobin (Hb) in adults (HbF, measured as %HbF of total Hb or as proportion of red blood cells carrying HbF [%F cells] (4, 14, 15)). General diagnostic erythroid parameters such as RBC, MCV, MCH, and others (5, 7, 8, 10, 13) have also been found to be highly associated with the presence of the 6q23 variants. Traits with weaker, but significant association are packed blood cell volume (PCV, also referred to as hematocrit) (7, 10, 13), total Hb (13), HbA2 (12), and even nonerythroid traits (i.e., monocyte and platelet counts) (5, 10). The genetic regulation of HbF levels is of particular therapeutic interest, as increased HbF levels significantly ameliorate disease severity of the 2 main β-hemoglobinopathies — β-thalassemias and sickle cell disease (16, 17) — which represent some of the most common human genetic disorders (18). Erythroid-trait associated SNPs (Table 1) reside within a 126-kb intergenic region between the HBS1L and MYB genes (Figure 1A). As originally reported in studies investigating the genetic basis of variation in HbF levels (4, 15), a small number of these SNPs were shown to display an especially strong association; these observations were largely confirmed for the other erythroid phenotypes investigated (7, 8, 10, 13). These SNPs are closely linked with each other and span a region of about 24 kb (originally termed HBS1L-MYB intergenic polymorphism block 2 [HMIP-2]) (4, 7, 11). Association of these HMIP-2 SNPs with the erythroid traits has been replicated and validated in populations from diverse ethnic backgrounds (6–8, 10). Despite extensive genetic evidence, a clear mechanistic basis for the association between the intergenic SNPs and erythroid biology has remained elusive, although the 2 flanking genes (HBS1L and MYB) are candidate target genes (4, 19–22).
Table 1.
Human erythroid phenotypes associated with HBS1L-MYB intergenic variants
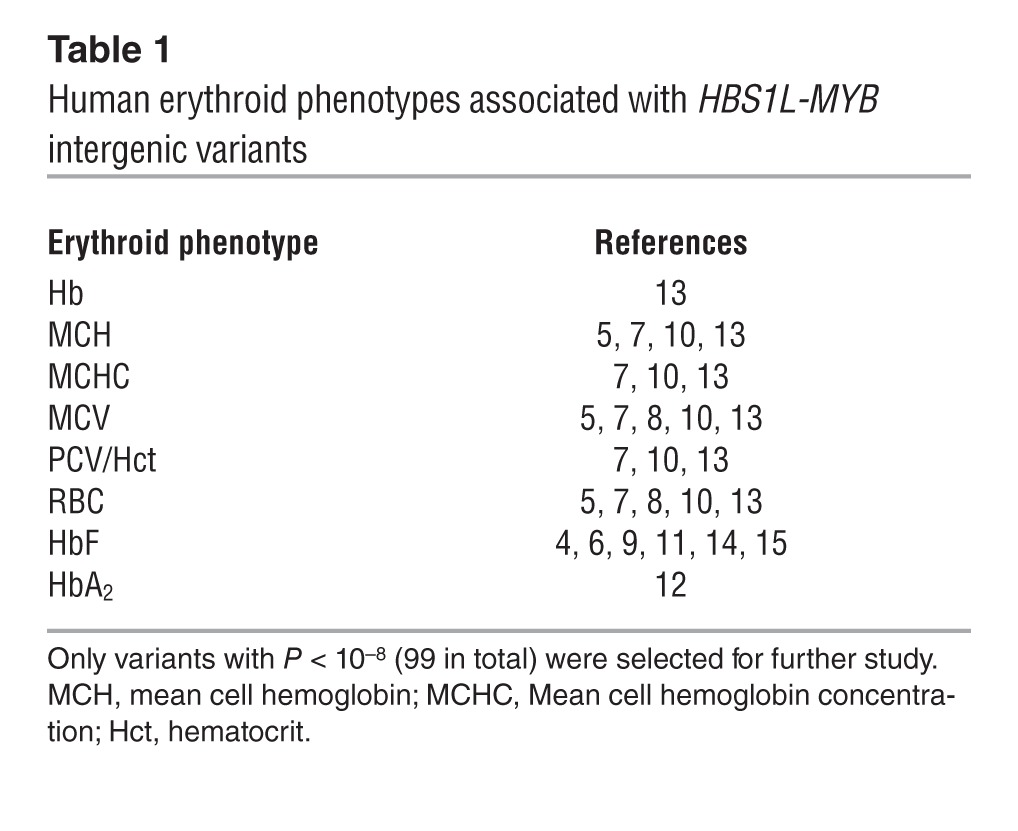
Figure 1. The erythroid/hematopoietic-specific regulatory signature of the HBS1L-MYB intergenic region associated with HbF levels and other human erythroid traits.

(A) Intergenic SNPs associated (P < 10–8) with different erythroid phenotypes (listed in Table 1) as reported by published GWAS (Table 1) are plotted below the HBS1L-MYB locus. (B) Locus-wide expression, DNaseI hypersensitivity, and enhancer chromatin signature data for 4 different cell types representing erythrocytes (K562), lymphocytes (Gm12878), endothelial cells (HUVEC) and keratinocytes (NHEK). The y axis represents sequence tag density. (C) Locus-wide digital genomic footprinting data shown for an erythroid cell line (K562) expressing both MYB and HBS1L (HBS1L pos/MYB pos) and for a liver cell line (HepG2) expressing only HBS1L (HBS1L pos/MYB neg). The y axis represents sequence tag density. Genome-wide data sets were obtained from the ENCODE consortium and accessed through the UCSC Genome Browser ( http://genome.ucsc.edu/). DNaseI-HS, DNaseI hypersensitivity.
Whereas the function of HBS1L in red blood cell development is uncharacterized, the MYB gene (encoding the c-MYB transcription factor [TF]) is a key regulator of hematopoiesis and erythropoiesis (23, 24). c-MYB plays an essential role in controlling the erythroid cellular proliferation/differentiation balance (25) and regulates HbF levels through an undefined mechanism (19, 20). The functional importance of the intergenic region was first observed when transgene insertion within the murine Hbs1l-Myb intergenic region almost completely abolished Myb transcription and resulted in severe anemia (22). A recently reported follow-up investigation mapped the location of transgene insertion to the HMIP-2 orthologous region and showed elevated levels of embryonic globin genes in splenic erythroid cells of these transgenic mice (21), confirming the importance of the intergenic region for globin gene regulation in the mouse. We previously identified several distal regulatory elements in the mouse Hbs1l-Myb intergenic region that regulate Myb transcription by physically interacting with the Myb promoter and first intron in erythroid progenitors via chromatin looping (26, 27). In humans, microarray-based experiments have demonstrated the presence of erythroid-specific transcription and active histone modifications in this region (28). We therefore set out to characterize the regulatory potential of the human HBS1L-MYB intergenic region in detail and to investigate the functional impact of the erythroid phenotype–associated variants.
Results
Regulatory activity at the human HBS1L-MYB intergenic region strictly correlates with MYB expression levels.
Genome-wide data sets generated by the ENCODE consortium (29) were inspected to explore gene expression and intergenic regulatory potential within the HBS1L-MYB region for a number of cell lines representing a variety of tissues. This showed that high-level MYB expression was restricted to hematopoietic cells (erythroid K562 and lymphoid GM12878 cells), while HBS1L was expressed at similar levels in all cell types (Figure 1B and Supplemental Figure 1; supplemental material available online with this article; doi: 10.1172/JCI71520DS1), confirming previous observations (28). Next, intergenic regulatory activity was assessed using a combination of genome-wide histone modification, DNaseI hypersensitivity, and genomic footprinting data sets (30–32). A strong positive correlation between MYB expression levels and intergenic regulatory activity emerged (Figure 1, B and C, and Supplemental Figure 1). In erythroid K562 cells, which express the highest levels of MYB, the intergenic interval contains numerous enhancer chromatin signatures. Lymphoid Gm12878 cells expressing lower levels of MYB display fewer areas of regulatory activity. Finally, cell types not expressing MYB (i.e., HUVEC, NHEK, HepG2) display heterochromatinized or polycomb-repressed intergenic regions with an absence of DNAseI-hypersensitivity while still expressing HBS1L at high levels (Figure 1, B and C, and Supplemental Figure 1). These observations suggest that the HBS1L-MYB intergenic region is likely to contain MYB-specific regulatory elements.
Erythroid TF complexes occupy regulatory sequences in the HBS1L-MYB intergenic region and are required for MYB expression.
To identify regulatory elements controlling MYB expression more precisely, we profiled chromatin occupancy of the key erythroid LDB1 TF complex (33) in primary human erythroid progenitors (HEPs) using ChIP coupled to high-throughput sequencing (ChIP-Seq) and quantitative PCR (ChIP-qPCR). We detected an intergenic cluster containing 7 binding sites for the LDB1 complex, characterized by strong binding and co-occupancy of core complex proteins LDB1, GATA1, TAL1, and ETO2 (Figure 2, A and B, marked by their distance from the MYB transcriptional start site (TSS). Furthermore, we found one of these sites to be co-occupied by the erythroid-specific TF KLF1 (Figure 2C), a protein that was found to bind the murine intergenic region (26, 34). These TFs are critical regulators of erythroid development (33, 35, 36), are positive regulators of murine Myb expression (26), and have been implicated in establishing long-range promoter-enhancer communication (37–40).
Figure 2. The HBS1L-MYB intergenic region contains regulatory elements bound by erythroid TFs.

(A) LDB1 ChIP-Seq data from primary HEPs. LDB1 peaks were marked by their distance to the MYB TSS. (B and C) ChIP-qPCR data (HEPs) showing enrichment (n = 3) for LDB1 complex members (B) and KLF1 (C) at the intergenic binding sites. IgG serum was used as control (IgG); the HBG1/2 promoter for normalization. (D) Comparison of mouse and human LDB1 ChIP-Seq data from erythroid progenitors. Binding sites not conserved are marked (*). The region containing the 4 conserved sites (conserved core) is highlighted in purple. Error bars display SEM. FL E13.5, 13.5 dpc fetal liver erythroid progenitors.
The emerging TF-binding profile is reminiscent of the one observed in mouse erythroid cells (26). When LDB1 ChIP-Seq profiles from mouse and HEPs were compared, a core region of 4 highly conserved binding sites emerged, which included the single LDB1/KLF1 co-occupied site 84 kb upstream of the MYB TSS (Figure 2D). Interestingly, as previously observed in mouse erythroid cells (26), these 4 conserved core sites (at positions –87, –84, –71 and –63) displayed strong enhancer signatures (41) in K562 and HEPs (Figure 3, A–C, Supplemental Figure 2). Furthermore, several of these putative regulatory elements showed enhancer activity in luciferase reporter assays (Figure 3D). These data suggest that the HBS1L-MYB intergenic interval contains enhancer elements bound by erythroid TFs.
Figure 3. Erythroid TFs bind intergenic enhancer regions and are required for MYB expression.

(A) Alignment of LDB1-binding sites (HEPs) to enhancer chromatin signature, DNaseI-HS, and footprinting data from erythroid (K562) and endothelial (HUVEC) cell lines. (B) Table summarizing the comparison between LDB1 sites (HEPs) and enhancer marks (K562). Arrowheads denote conserved sites with highly enriched enhancer signatures. (C) H3K27 acetylation as measured by ChIP-qPCR in HEPs for indicated LDB1-binding sites (n = 2). Enrichments were corrected for total H3 levels and normalized to the AMY2A promoter (AMY prom.). (D) Luciferase reporter assays in MEL cells measuring (n = 3) enhancer activity of the –84-kb and –71-kb elements. Promoter activity without enhancer (empty) was set to 1. (E and F) Gene expression analysis (n = 3) on K562 cells depleted for the indicated TFs by RNAi. A scrambled shRNA was used as control (Ctrl). Error bars display SEM.
Depletion of LDB1, TAL1 and KLF1 in K562 cells using RNA interference (RNAi) resulted in a specific downregulation of MYB expression while leaving HBS1L levels unaffected (Figure 3, E and F), demonstrating that the erythroid TFs occupying the intergenic enhancers are required for MYB expression.
Intergenic TF-bound regulatory elements spatially cluster around the MYB gene in primary erythroid cells.
To test whether the intergenic regulatory elements indeed act as long-range enhancers to regulate MYB in primary human cells, we analyzed the in vivo 3D chromatin structure of the locus using chromosome conformation capture (3C) coupled to high-throughput sequencing (3C-Seq) (42). We also profiled CTCF occupancy within the locus, a protein known to be important for chromatin looping (43, 44) that has recently been implicated in regulating Myb expression in mouse erythroid cells (26). Several strong chromatin coassociations between the MYB promoter and intergenic sequences were detected, almost all of which correlated with TF-binding events (Figure 4A). Importantly, the highest interaction density was observed within the conserved core region, further strengthening the importance of the TF-bound regulatory elements within this region. Performing 3C-Seq using the –84 LDB1 complex/KLF1–binding site as a viewpoint produced a similar pattern of long-range chromatin interactions within the intergenic region and around the MYB promoter (Figure 4A). 3C-qPCR analysis on HEP and K562 cells confirmed the nuclear proximity between MYB, the –84 regulatory element, and a CTCF site in between (Figure 4B and Supplemental Figure 3), which was not observed in cells expressing very low levels of MYB (HeLa, Figure 4, B and C) Thus, in vivo, the intergenic regulatory elements cluster in the nuclear space and are involved in long-range interactions with the active MYB gene.
Figure 4. 3C analysis of the HBS1L-MYB locus reveals long-range interactions between intergenic elements and the MYB gene.

(A) 3C-Seq analysis performed on primary HEPs from 3 different donors using the MYB promoter (green bar) or the –84 regulatory element (blue bar) as a viewpoint (VP). LDB1 and CTCF ChIP-Seq results from primary HEPs and gene locations are shown at the top. Gray shading highlights regions of coinciding protein binding and chromatin looping. The y axis represents relative crosslinking frequencies per BglII fragment as measured by sequence tag density. (B) 3C-qPCR experiments on primary HEPs (red, n = 5) and HeLa cells (gray, n = 3) using the same viewpoints as in A. The locus is plotted on top, with the different 3C restriction fragments (BglII) used for PCR indicated. A schematic depicting the location of the primers on the chosen restriction fragments is shown. Interaction frequencies between 2 fragments within the ERCC3 locus were used for normalization. (C) Gene expression analysis (n = 3) of MYB transcript levels in the different cell types used for the 3C analysis. ACTB levels were used for normalization. Error bars display SEM.
Common variants modulating human erythroid traits colocalize with TF-bound intergenic regulatory elements.
Next, we set out to compare the locations of the TF-bound regulatory sequences with those of the SNPs reported to be associated with erythroid phenotypes. This trait-associated variation involves more than 100 SNPs and small deletions spanning the entire interval between HBS1L and MYB (Figure 5). The locus was first identified as associated with HbF persistence (4). It was subsequently shown (5, 7, 8, 13) that an analogous pattern of association exists with routine diagnostic hematological parameters, especially MCV, MCH, and RBC, but also other erythroid and hematological nonerythroid parameters. A distinct small subset of these variants is set apart by their particularly strong association with these traits and with each other (linkage disequilibrium [LD]) in individuals of European and Asian descent. This LD block of SNPs (termed HMIP-2; ref. 4) is distributed over a physical area of 24 kb (Figure 5).
Figure 5. Intergenic polymorphisms associated with HbF and other erythroid parameters localize to the intergenic regulatory elements.

All published intergenic SNPs associated with human erythroid traits (P < 10–8; blue) and the most highly associated (P < 10–65 and 3 or more major erythroid parameters [%HbF, MCV, MCH and RBC]; red) variants are shown directly under MYB and HBS1L gene locations. Below, a zoom-in picture of the LDB1 binding-site cluster and its regulatory signature is further compared with the location of the conserved core (gray), HMIP-2 block (dark blue) and the 17 highly associated candidate SNPs. Chromatin looping with the MYB promoter (Figure 4A) is depicted on a white (no interaction) to red (strong interaction) color gradient. Two additional zoom-in pictures display the locations of the SNPs relative to the TF-binding motifs (identified by JASPAR) within the –84 and –71 sites. Within the –84 element, rs66650371 is the actual associated variant (in red; see Results for details).
From published GWAS (Table 1), we identified 17 common HMIP-2 variants (15 SNPs and a 3-bp deletion/SNP combination, detailed in Methods) that showed an exceptionally strong genetic association across the erythroid traits. These 17 variants, or a subset of them, are most likely functionally involved in modulating erythroid biology. We subsequently investigated the physical and functional relationship of these candidate variants to key sequences of TF-binding and regulatory activity within the HBS1L-MYB intergenic interval.
Strikingly, the sequence area spanned by our candidate variants (analogous to the HMIP-2 block) is largely identical to the conserved core region containing the TF-bound regulatory elements (Figure 5). Of our 17 candidate variants, 5 were located within sequences showing both enhancer signatures and protein-binding features (Figures 2, 3, and 5). Four of these 5 variants are positioned directly under LDB1 complex ChIP-Seq peaks: 2 are located within the –84 LDB1 complex/KLF1–binding site (rs66650371, a 3-bp deletion and rs7775698, a SNP located inside its nondeleted allele) and 2 within the highly enriched –71 LDB1 complex binding site (SNPs rs6920211 and rs9494142) (Figure 5). Both these conserved TF-binding sites displayed typical active enhancer signatures (Figures 2 and 3) and showed high-interaction frequencies with the MYB gene in 3C assays (Figures 4 and 5). The 2 overlapping variants at the center of the –84 LDB1 complex–binding site (rs66650371/rs7775698) are located in the immediate vicinity of a TAL1 and GATA1 motif, as noted before (11). In individuals of European descent, these 2 polymorphisms are in complete LD (4) and therefore the association cannot be distinguished. Observations in individuals of African descent showed that of the 2 variants, the 3-bp deletion is the actual associated one (ref. 11 and discussed below). Additionally, one of the SNPs in the –71 binding site (rs9494142) is located directly adjacent to a GATA1 motif. These observations suggest that the variants falling in these regions may affect long-range MYB regulation and through this mechanism exert their influence on human erythroid blood parameters.
In individuals of African descent, the link between the HMIP-2 variants is less rigid, and the block breaks down into 2 independently associated groups of variants (6). Interestingly, the “upstream” group is located at and immediately next to the –84 LDB1 complex–binding site (including rs9399137 and the rs66650371 3-bp deletion, while the overlapping rs7775698 SNP is not associated with erythroid traits). The “downstream” HMIP-2 association signal in African-descended populations was found to be strongest in the middle of the conserved region of regulatory elements (rs4895441 and rs9402686; refs. 6, 9), but extended across the region to include the –71 LDB1 complex–binding site with SNPs rs6920211 and rs9494142 (S. Menzel et al., unpublished observations).
rs66650371 affects TF binding, enhancer activity, and promoter-enhancer communication in erythroid cells.
To begin probing the functional impact of one of the most prominent variants, the rs66650371 3-bp deletion (Figure 5 and ref. 11), we designed allele-specific assays (see Methods and Supplemental Figure 4) using K562 cells, which are heterozygous for this –84 variant (Supplemental Figure 4A and ref. 11), but not informative for rs9494142 (data not shown). First, using allele-specific ChIP, we observed diminished (25%–50%) binding of LDB1, GATA1, TAL1, and KLF1 to the rs66650371 allele carrying the deletion (as compared with the nondeleted reference allele, Figure 6A), showing that rs66650371 affects local TF binding. Allele-specific mapping of K562 TAL1 ChIP-Seq reads further confirmed the detrimental effect of this 3-bp deletion on TF binding (Figure 6B). Second, using an allele-specific 3C analysis (see Methods and Supplemental Figure 4), we showed reduced interactions between the rs66650371-deleted –84 allele and MYB compared with the nondeleted –84 allele (Figure 6C). Finally, we measured the impact of the rs66650371 deletion on –84 enhancer activity in erythroid (murine erythroleukemia [MEL]) and nonerythroid (human embryonic kidney [HEK]) cells using luciferase reporter assays. In MEL cells, a significant reduction in promoter activation was observed when the rs66650371 minor allele was present in the –84 enhancer element (Figure 6D). In contrast, the –84 region did not show any enhancer activity in HEK cells, regardless of which rs66650371 allele was present (Figure 6D). Together, these results suggest that the minor allele of a highly associated intergenic variant negatively affects enhancer function and MYB regulation in erythroid cells.
Figure 6. rs66650371 affects protein binding, chromatin looping, and enhancer activity within the erythroid HBS1L-MYB locus.

(A) Allele-specific ChIP experiments for the rs66650371 alleles in K562 cells heterozygous for this variant. Occupancy of rs66650371 (within the –84 element) by LDB1, GATA1, TAL1, and KLF1 was measured by ChIP-qPCR (n = 2, normalized against AMY2A promoter values), followed by an allele-specific read-out using MaeIII digestion (n = 2, see Methods and Supplemental Figure 4). Allelic abundance was expressed as a rs66650371 (minor)/reference (major) ratio, which was set to 1 for genomic DNA (gDNA). A ratio of less than 1 is the result of a relative lower abundance of the rs66650371 minor allele in the ChIP samples. (B) TAL1 ChIP-Seq was performed in K562 cells, and sequence reads were mapped against the reference and rs66650371 (containing the minor 3-bp deletion allele) genomes. K562 input genomic DNA was PCR amplified (amplicon spanning rs66650371) and cloned into a plasmid; colonies were sequenced (n = 20). (C) Allele-specific quantification (n = 3) of chromatin looping between the –84 element and the MYB promoter in K562 cells. A long-range PCR approach was combined with an MaeIII digestion-based read-out for quantification (see Methods). (D) Luciferase reporter assays measuring enhancer activity of the reference (ref.) and rs66650371 minor –84 enhancer alleles in erythroid (MEL) and nonerythroid (HEK) cells. Error bars display SEM. Statistical significance was determined using Student’s t test. *P < 0.05; **P < 0.01; ***P < 0.001.
Trait-associated intergenic variants affect TF binding, chromatin looping, and MYB expression in humans.
To validate and further expand our observations made in erythroid cell lines, we obtained primary erythroid cells from high HbF individuals homozygous for all minor alleles of the phenotype-associated HMIP-2 block (SNP/SNP, containing the –84-kb and –71-kb intergenic variants in the conserved core), and normal HbF individuals homozygous for the absence of the phenotype-associated HMIP-2 variants (WT/WT). Cells cultured ex vivo from SNP/SNP individuals showed consistently lower MYB levels throughout phase II of the culture as compared with WT/WT control cells (37% lower MYB on average; Figure 7A). To further strengthen the observed negative correlation between the presence of the enhancer variants and MYB expression, we measured MYB expression in HEPs from a larger cohort of healthy individuals with different genotypes (4 SNP/SNP, 9 WT/SNP, and 8 WT/WT; Figure 7B). Linear regression analysis revealed a highly significant correlation between the presence of the variants and reduced MYB levels (P = 0.005, allelic effect size = –0.113). Moreover, we observed accelerated differentiation kinetics in late-stage SNP/SNP cultures as well as an increased percentage of CD14+ monocytes (Supplemental Figure 5). This is in agreement with the phenotype observed in HEPs depleted for MYB by RNAi (20). ChIP experiments carried out in primary erythroid progenitors harvested at day 7 showed reduced binding of GATA1 and KLF1 at the –84 and –71 regulatory elements (containing the associated variants) in SNP/SNP compared with WT/WT individuals (Figure 7C). Similar results were obtained using erythroid progenitors harvested at later stages of differentiation (i.e., day 11; Supplemental Figure 6 and data not shown). Because of the reduced cell numbers (data not shown), reduced intergenic TF enrichments (Supplemental Figure 6A), and accelerated differentiation of SNP/SNP cultures (Supplemental Figure 5), we decided to perform further experiments on cells harvested at day 7. Allele-specific ChIP assays using SNaPshot analysis (45) showed reduced GATA1 binding to the minor rs9494142 C allele in erythroid cells cultured from healthy heterozygous donors (SNP/WT; Figure 7D), confirming the ChIP results on erythroid chromatin from HEPs of SNP/SNP and WT/WT individuals. 3C-qPCR assays on cultured SNP/SNP and WT/WT cells demonstrated diminished looping between the –84 element and the MYB promoter in SNP/SNP individuals (Figure 7E). Finally, we determined whether the allele-specific effects observed at the regulatory elements resulted in an allelic imbalance of MYB transcripts. HEPs from several healthy unrelated individuals heterozygous for the –84 and –71 intergenic variants were used as test samples, while cells from individuals homozygous (WT/WT and SNP/SNP) for the variants were used as controls. We utilized the intronic rs210796 MYB variant (heterozygous in all test and control individuals) to assess allele-specific MYB expression levels. Transcript levels in HEPs heterozygous for the phenotype-associated variants indeed showed an allelic imbalance that was not observed in homozygous control cells, which showed a 1:1 allelic ratio (Figure 7F). A correlation between allelic expression imbalance and the presence of the intergenic variants was not detected for HBS1L (data not shown), further confirming the specific effect of the intergenic variants on MYB regulation. Taken together, these data show that HBS1L-MYB intergenic variants affect MYB expression by reducing TF binding to its regulatory elements and disrupting long-range enhancer gene communication.
Figure 7. Intergenic variants affect TF binding, chromatin looping, and MYB expression in primary HEPs.

(A) HEPs from individuals homozygous for the minor allele of the phenotype-associated variants (HMIP-2 LD block variants; SNP/SNP) and WT control individuals (WT/WT) were cultured and assayed for MYB expression at indicated days (left: representative experiment, right: n = 4). (B) Correlation between intergenic genotype and MYB expression was determined using HEPs from 21 individuals (WT/WT, WT/SNP, and SNP/SNP intergenic genotypes; see Methods). Circle represents single data point considered to be an outlier. (C) ChIP-qPCR (n = 3) for GATA1/KLF1 using SNP/SNP and WT/WT HEPs. Enrichments were normalized to IgG and α-globin HS40 values (WT/WT set to 1). (D) Allele-specific measurement of GATA1 binding to rs9494142 (T/C) alleles using SNaPshot on heterozygous individuals (n = 4). rs9494142 C is the phenotype-associated minor allele. (C-allele set to 1). (E) Interaction frequencies between the –84 element and MYB promoter were measured (n = 5) using 3C-qPCR in SNP/SNP and WT/WT HEPs. (F) Allele-specific expression measured by SNaPshot in HEPs from individuals heterozygous (n = 5) or homozygous (n = 5) for the intergenic SNPs; rs210796 SNP (T/A) was used for quantification. (G) Proposed model explaining the effect of trait-associated intergenic SNPs on MYB regulation. Transcription factor-bound regulatory elements cluster around MYB to form an ACH, stimulating transcription (left). Intergenic SNPs reduce TF binding and chromatin looping, partially destabilizing the ACH and reducing MYB transcription (right). Lower MYB levels subsequently affect red cell traits. Error bars display SEM. Statistical significance was determined using linear regression analysis or Student’s t test. *P < 0.05; **P < 0.01.
Discussion
Features of red blood cells, such as their number, size, and Hb content, are subtly different among healthy human individuals. Mapping of the underlying genetic variability has identified candidate genes and loci affecting iron metabolism, cytoskeleton function, globin regulation, and other critical processes controlling erythropoiesis and red cell function. However, direct mechanistic interpretation of the effects of the identified variants is often obscured by their nongenic localization, implying that the majority of the associated genetic variation affects noncoding regulatory sequences (3). Detailed investigations of these loci are thus required to fully understand the genetic basis of human trait variation and disease risk (46), as exemplified by the in-depth studies of GWAS-identified SNPs at the MYC (47, 48) and OCA2 (49) loci. Several GWAS (4–13) have identified a cluster of common variants in the interval between HBS1L and MYB that modulate a broad spectrum of hematological traits, in particular erythroid phenotypes, suggesting that this locus may have a key role in the regulation of erythropoiesis. However, molecular insight into how these intergenic polymorphisms could affect erythroid parameters remains elusive.
Here we have characterized the regulatory potential of the HBS1L-MYB intergenic region in detail and identified a cluster of erythroid-specific enhancers controlling the expression of MYB (Figures 1–4), a critical regulator of erythropoiesis (23, 25). Common variants affecting human erythroid traits were found to cluster close to or within the enhancers (Figure 5), where they disrupt enhancer activity through the attenuation of TF binding and enhancer-promoter looping, resulting in reduced MYB expression levels (Figures 6 and 7). These experiments provide what we believe is the first causal link among the intergenic variants, MYB regulation, and their influence on erythroid traits.
Regulatory control of the MYB gene in erythroid cells has thus far remained incompletely defined, although it involves regulation via its proximal promoter region (50, 51) and microRNAs (20, 52, 53). Our experiments show that MYB is additionally controlled distally by enhancer elements more than 80 kb upstream of its promoter, illustrating the high degree of regulatory complexity that governs MYB expression. It has been postulated that enhancers cluster in the nuclear space to form active chromatin hubs (ACH) to stimulate target-gene transcription (54), a process likely to involve the concerted action of TFs. Our observations of in vivo clustering of enhancers around MYB suggest the presence of a MYB ACH (Figure 7G), similar to that observed in murine erythroid progenitors (26). Intergenic polymorphisms, through their detrimental effect on TF recruitment to the enhancers, could partially destabilize the MYB ACH, in turn resulting in decreased transcriptional output and a subsequent modulation of erythroid traits (Figure 7G).
The most significantly associated variants (Figure 5) cluster within a discrete 24-kb region that appears to function as an erythroid-specific long-range MYB enhancer. In this core regulatory region, 5 of the polymorphisms are located within 2 regulatory elements 84 and 71 kb upstream of the MYB TSS. There they alter nucleotides adjacent to or within E-Box/GATA TF binding motifs used to recruit the LDB1 complex (35, 55) and affect the spacing between these motifs. Spacing between TF-binding motifs within enhancer sequences has been reported to be a constraint for optimal binding (56, 57), and reduction of E-box/GATA motif spacing by the rs66650371 3-bp deletion in the –84 element could underlie the diminished TF binding and enhancer activity of the deleted rs66650371 allele (Figures 6 and 7). In addition, sequences flanking core binding motifs are known to be important for optimal TF binding (57). For example, a stretch of A or T residues adjacent to core motifs was observed as a specificity determinant (57). The rs9494142 minor allele (C) disrupts a stretch of 3 A/T residues adjacent to the “TATC” core GATA1 motif, providing a possible explanation for the reduced observed GATA1 binding to the rs9494142 minor allele (Figure 7, C–D). Alternatively, the variants might affect TF binding indirectly, for example, through local changes in chromatin structure (58) or by creating a new TF-binding site that might affect LDB1 complex–binding through competition (59). Even though the individual effects of the enhancer variants on TF binding and chromatin looping were modest, it is likely that several of the most significantly associated enhancer variants (which are in strong LD, i.e., rs66650371 and rs9494142) act in concert to cause the observed significant reduction in MYB expression levels (Figure 7B). Indeed, a recent study (60) showed that such an “additive enhancer variant mechanism” takes place at several other loci identified in GWAS.
Exactly how c-MYB controls HbF levels and the many other erythroid traits is not yet fully understood. A clear anticorrelation between MYB and HbF levels has emerged (19, 20), which was further confirmed by the reduced MYB expression we observed in erythroid cells from high HbF individuals (Figure 7A). Studies investigating the effects of lower MYB levels in mouse and human erythroid cells reported that cell-cycle progression was slower and accelerated differentiation kinetics were observed in later stages of erythroid development (19, 20, 61). In accordance with these results, ChIP-Seq experiments (29) detected c-Myb binding to key cell-cycle regulators (i.e., Bcl2, Cdk6, Myc) in murine erythroid progenitors (Supplemental Figure 7B). Furthermore, several of these genes were found to be misregulated in an analysis of published MYB loss-of-function studies (20, 21, 61) in HEPs (Supplemental Figure 7C). Accelerated differentiation in an environment of lower MYB levels could favor premature cell-cycle termination during the proliferation cycles of adult erythropoiesis, producing more erythroid cells that synthesize predominantly HbF (“F-cells”) before the switch to adult Hb synthesis occurs (Supplemental Figure 7D) (62). In this context, lower MYB levels will lead to lower RBC (resulting from the reduced number of proliferation cycles) and higher MCV as the erythrocytes are younger red cells (Supplemental Figure 7D) (5, 63); indeed, these traits are genetically associated with the minor alleles of the intergenic SNPs (5).
Alternatively, recent studies suggest that the c-MYB TF plays an important role in the emerging TF network governing γ-globin expression, in which the BCL11A and KLF1 proteins play key repressive roles (17, 64–67). Remarkably, we noticed that c-Myb in murine erythroid progenitors occupied the β-globin locus and many of the established γ-globin repressor genes, including Bcl11a and Klf1 (Supplemental Figure 7A). Analysis of previous c-MYB loss-of-function studies (20, 21, 61) indeed showed that several of the c-Myb–bound γ-globin repressor genes (i.e., Bcl11a, Klf1) are downregulated upon MYB depletion (Supplemental Figure 7C). These observations suggest that c-MYB directly activates key γ-globin repressor genes and thus fulfills an important role within the established molecular HbF repression mechanisms (Supplemental Figure 7D).
Direct targeting of TFs that regulate γ-globin expression to induce HbF production in adults has remained challenging, as conventional TFs not highly signal dependent (such as BCL11A or c-MYB) have been very difficult drug targets (68). However, the ongoing revolution in genome engineering methods (e.g., custom-made zinc-finger or TALE-mediated targeting; ref. 69) has made it possible to specifically target genomic sites of interest. Two recent studies (70, 71) have provided examples of how to exploit genome-editing technology to modulate gene expression by interfering with enhancer function. Such strategies could also be applied to the erythroid-specific MYB enhancers described in our current work. Targeted repression (or perhaps even deletion) of the –84 and/or –71 MYB enhancers could reduce MYB expression specifically in erythrocytes (analogous to the effect of the high-HbF–associated variants), resulting in elevated HbF levels. Although MYB is essential for proper erythroid development, moderately reduced MYB levels seem to be well tolerated by the erythroid system (19, 24, 72).
As elevated HbF levels ameliorate the severity of β-thalassemia and sickle cell anemia, induction of HbF in adults has been a major focus of research in the past decades (16, 17). Our work provides the essential mechanistic basis and enhancer characterization that are necessary for the potential future development of therapeutic strategies aimed at inducing HbF by reducing MYB levels via its intergenic regulatory elements.
Methods
Subjects and analyses of blood samples.
A total of 50 healthy unrelated adults of diverse ethnic backgrounds were recruited as well as selected members of the Asian-Indian kindred (73). HbF levels were measured using high-performance liquid chromatography (BioRad Variant; BioRad) and F cells as previously described (19), using blood in EDTA. Genomic DNA was isolated from peripheral blood of these individuals and genotyped for the relevant HBS1L-MYB intergenic variants and for the intronic rs210796 SNP on chromosome 6q23. Individuals with the appropriate intergenic and MYB intron 4 genotypes were selected for culture studies. HEPs were cultured from 21 individuals with certain combinations of the trait-associated HBS1L-MYB intergenic variants (8 homozygous for the reference alleles WT/WT, 9 heterozygous WT/SNP, and 4 homozygous for the minor alleles SNP/SNP), as appropriate for allele-specific ChIP and allele-specific expression studies.
Cell culture.
HEPs were cultured from buffy coats or whole blood in EDTA (as previously described; refs. 19, 74) using a 2-phase culture system. K562, MEL, HEK, and HeLa cells were maintained in DMEM supplemented with 10% fetal calf serum and penicillin/streptomycin. Cells were counted with an electronic cell counter (CASY-1; Schärfe System).
ENCODE and expression microarray data mining.
A detailed description of ENCODE project and expression microarray data mining can be found in the Supplemental Methods.
Intergenic SNP selection and TF motif prediction.
HBS1L-MYB intergenic common DNA variants associated with erythroid traits (Figure 1) were identified from published data (Table 1). A more detailed analysis of SNP selection and TF motif prediction can be found in the Supplemental Methods.
ChIP and ChIP-Seq.
ChIP experiments were carried out according to procedures described before (35). Antibodies used have been described before (26). KLF1 antibody was provided by Sjaak Philipsen (Department of Cell Biology, Erasmus Medical Centre). High-throughput sequencing of ChIP DNA libraries was performed on the Illumina GAII or HiSeq2000 platforms and analyzed using the NARWHAL (75) pipeline. Data were visualized using a local mirror of the UCSC genome browser (hg18).
Luciferase reporter assays, RNAi, and gene-expression analysis.
Details on reporter assays, RNAi, and expression analysis can be found in the Supplemental Methods. Primer sequences can be found in Supplemental Table 1.
3C and 3C-Seq.
3C and 3C-Seq experiments were essentially carried out as described (26, 42). For all experiments, BglII was used as the primary restriction enzyme. See Supplemental Methods for additional information on data normalization. For 3C-Seq library preparations, we used NlaIII as a secondary restriction enzyme. Initial 3C-Seq data processing was performed as described elsewhere (42). Detailed analysis and visualization was carried out using r3Cseq software (76). Primer sequences can be found in Supplemental Table 1.
Allele-specific ChIP, ChIP-Seq, 3C, and SNaPshot analysis.
Allele-specific ChIP, ChIP-Seq, 3C, and SNaPshot strategies are further described in the Supplemental Methods. Primer sequences can be found in Supplemental Table 1.
FACS analysis.
FACS analysis was performed as previously described (19).
Accession codes.
ChIP-Seq and 3C-Seq data sets were deposited in the GEO repository (GSE52637).
Statistics.
Statistical significance was determined using an unpaired, 2-tailed Student’s t test unless stated otherwise. Linear regression analysis was performed using SPSS Statistics software (IBM), including an ANOVA test for statistical significance. MYB expression measurements used for regression analysis were performed in 2 batches, and the systematic differences between them were corrected for in the statistical analysis (and in Figure 7B). P < 0.05 was considered significant.
Study approval.
Investigations using human blood samples conformed to the principles outlined in the Helsinki Declaration of the World Medical Association. Written informed consent was received from participants prior to inclusion in the study. This study was approved by the Local Ethical Committee (LREC no 10/H0808/035) of King’s College Hospital, London.
Supplementary Material
Acknowledgments
We thank members of the Grosveld, Thein, and Soler labs for helpful discussions and Biomics department personnel for excellent technical assistance. We are grateful to Sjaak Philipsen (Department of Cell Biology, Erasmus Medical Centre) for providing the KLF1 antibody. We are also grateful to Nicholas J. Bray and Matthew Hill (Department of Neurosciences, Institute of Psychiatry, King’s College London) for help and advice with snapshot, and to Emil Van den Akker (Department of Hematopoiesis, Sanquin Research, Amsterdam, The Netherlands) and Jackie Sloan-Stanley (Weatherall Institute of Molecular Medicine) for help and advice with the erythroid cultures. This work was supported by the EU-FP7 EuTRACC consortium (to F. Grosveld), the Royal Netherlands Academy of Arts and Sciences (KNAW) (to R. Stadhouders), the Dutch Cancer Genomics Center (to E. Soler and F. Grosveld), the Netherlands Genomics Initiative (to E. Soler and F. Grosveld), the Norwegian Research Council (to B. Lenhard), the Bergen Research Foundation (to B. Lenhard), the French Alternative Energies and Atomic Energy Commission (CEA) and the Atip-Avenir Program (to E. Soler), and the Medical Council Research, United Kingdom (to S.L. Thein).
Footnotes
Conflict of interest: The authors have declared that no conflict of interest exists.
Citation for this article:J Clin Invest. 2014;124(4):1699–1710. doi:10.1172/JCI71520.
References
- 1.Evans DM, Frazer IH, Martin NG. Genetic and environmental causes of variation in basal levels of blood cells. Twin Res. 1999;2(4):250–257. doi: 10.1375/twin.2.4.250. [DOI] [PubMed] [Google Scholar]
- 2.Garner C, et al. Genetic influences on F cells and other hematologic variables: a twin heritability study. Blood. 2000;95(1):342–346. [PubMed] [Google Scholar]
- 3.Maurano MT, et al. Systematic localization of common disease-associated variation in regulatory DNA. Science. 2012;337(6099):1190–1195. doi: 10.1126/science.1222794. [DOI] [PMC free article] [PubMed] [Google Scholar]
- 4.Thein SL, et al. Intergenic variants of HBS1L-MYB are responsible for a major quantitative trait locus on chromosome 6q23 influencing fetal hemoglobin levels in adults. Proc Natl Acad Sci U S A. 2007;104(27):11346–11351. doi: 10.1073/pnas.0611393104. [DOI] [PMC free article] [PubMed] [Google Scholar]
- 5.Menzel S, et al. The HBS1L-MYB intergenic region on chromosome 6q23.3 influences erythrocyte, platelet, and monocyte counts in humans. Blood. 2007;110(10):3624–3626. doi: 10.1182/blood-2007-05-093419. [DOI] [PubMed] [Google Scholar]
- 6.Lettre G, et al. DNA polymorphisms at the BCL11A, HBS1L-MYB, and beta-globin loci associate with fetal hemoglobin levels and pain crises in sickle cell disease. Proc Natl Acad Sci U S A. 2008;105(33):11869–11874. doi: 10.1073/pnas.0804799105. [DOI] [PMC free article] [PubMed] [Google Scholar]
- 7.Ganesh SK, et al. Multiple loci influence erythrocyte phenotypes in the CHARGE Consortium. Nat Genet. 2009;41(11):1191–1198. doi: 10.1038/ng.466. [DOI] [PMC free article] [PubMed] [Google Scholar]
- 8.Soranzo N, et al. A genome-wide meta-analysis identifies 22 loci associated with eight hematological parameters in the HaemGen consortium. Nat Genet. 2009;41(11):1182–1190. doi: 10.1038/ng.467. [DOI] [PMC free article] [PubMed] [Google Scholar]
- 9.Galarneau G, et al. Fine-mapping at three loci known to affect fetal hemoglobin levels explains additional genetic variation. Nat Genet. 2010;42(12):1049–1051. doi: 10.1038/ng.707. [DOI] [PMC free article] [PubMed] [Google Scholar]
- 10.Kamatani Y, et al. Genome-wide association study of hematological and biochemical traits in a Japanese population. Nat Genet. 2010;42(3):210–215. doi: 10.1038/ng.531. [DOI] [PubMed] [Google Scholar]
- 11.Farrell JJ, et al. A 3-bp deletion in the HBS1L-MYB intergenic region on chromosome 6q23 is associated with HbF expression. Blood. 2011;117(18):4935–4945. doi: 10.1182/blood-2010-11-317081. [DOI] [PMC free article] [PubMed] [Google Scholar]
- 12.Menzel S, et al. HbA2 levels in normal adults are influenced by two distinct genetic mechanisms. Br J Haematol. 2013;160(1):101–105. doi: 10.1111/bjh.12084. [DOI] [PubMed] [Google Scholar]
- 13.van der Harst P, et al. Seventy-five genetic loci influencing the human red blood cell. Nature. 2012;492(7429):369–375. doi: 10.1038/nature11677. [DOI] [PMC free article] [PubMed] [Google Scholar]
- 14.Menzel S, et al. A QTL influencing F cell production maps to a gene encoding a zinc-finger protein on chromosome 2p15. Nat Genet. 2007;39(10):1197–1199. doi: 10.1038/ng2108. [DOI] [PubMed] [Google Scholar]
- 15.Uda M, et al. Genome-wide association study shows BCL11A associated with persistent fetal hemoglobin and amelioration of the phenotype of beta-thalassemia. Proc Natl Acad Sci U S A. 2008;105(5):1620–1625. doi: 10.1073/pnas.0711566105. [DOI] [PMC free article] [PubMed] [Google Scholar]
- 16.Thein SL, et al. Control of fetal hemoglobin: new insights emerging from genomics and clinical implications. Hum Mol Genet. 2009;18(R2):R216–223. doi: 10.1093/hmg/ddp401. [DOI] [PMC free article] [PubMed] [Google Scholar]
- 17.Sankaran VG, Orkin SH. The switch from fetal to adult hemoglobin. Cold Spring Harb Perspect Med. 2013;3(1):a011643. doi: 10.1101/cshperspect.a011643. [DOI] [PMC free article] [PubMed] [Google Scholar]
- 18.Williams TN, Weatherall DJ. World distribution, population genetics, and health burden of the hemoglobinopathies. Cold Spring Harb Perspect Med. 2012;2(9):a011692. doi: 10.1101/cshperspect.a011692. [DOI] [PMC free article] [PubMed] [Google Scholar]
- 19.Jiang J, et al. cMYB is involved in the regulation of fetal hemoglobin production in adults. Blood. 2006;108(3):1077–1083. doi: 10.1182/blood-2006-01-008912. [DOI] [PubMed] [Google Scholar]
- 20.Sankaran VG, et al. MicroRNA-15a and -16-1 act via MYB to elevate fetal hemoglobin expression in human trisomy 13. Proc Natl Acad Sci U S A. 2011;108(4):1519–1524. doi: 10.1073/pnas.1018384108. [DOI] [PMC free article] [PubMed] [Google Scholar]
- 21.Suzuki M, et al. Disruption of the Hbs1l-Myb locus causes hereditary persistence of fetal hemoglobin in a mouse model. Mol Cell Biol. 2013;33(8):1687–1695. doi: 10.1128/MCB.01617-12. [DOI] [PMC free article] [PubMed] [Google Scholar]
- 22.Mukai HY, et al. Transgene insertion in proximity to the c-myb gene disrupts erythroid-megakaryocytic lineage bifurcation. Mol Cell Biol. 2006;26(21):7953–7965. doi: 10.1128/MCB.00718-06. [DOI] [PMC free article] [PubMed] [Google Scholar]
- 23.Ramsay RG, Gonda TJ. MYB function in normal and cancer cells. Nat Rev Cancer. 2008;8(7):523–534. doi: 10.1038/nrc2439. [DOI] [PubMed] [Google Scholar]
- 24.Mucenski ML, et al. A functional c-myb gene is required for normal murine fetal hepatic hematopoiesis. Cell. 1991;65(4):677–689. doi: 10.1016/0092-8674(91)90099-K. [DOI] [PubMed] [Google Scholar]
- 25.Vegiopoulos A, et al. Coordination of erythropoiesis by the transcription factor c-Myb. Blood. 2006;107(12):4703–4710. doi: 10.1182/blood-2005-07-2968. [DOI] [PMC free article] [PubMed] [Google Scholar]
- 26.Stadhouders R, et al. Dynamic long-range chromatin interactions control Myb proto-oncogene transcription during erythroid development. EMBO J. 2012;31(4):986–999. doi: 10.1038/emboj.2011.450. [DOI] [PMC free article] [PubMed] [Google Scholar]
- 27.Stadhouders R, et al. Transcription regulation by distal enhancers: who’s in the loop? Transcription. 2012;3(4):181–186. doi: 10.4161/trns.20720. [DOI] [PMC free article] [PubMed] [Google Scholar]
- 28.Wahlberg K, et al. The HBS1L-MYB intergenic interval associated with elevated HbF levels shows characteristics of a distal regulatory region in erythroid cells. Blood. 2009;114(6):1254–1262. doi: 10.1182/blood-2009-03-210146. [DOI] [PubMed] [Google Scholar]
- 29.Dunham I, et al. An integrated encyclopedia of DNA elements in the human genome. Nature. 2012;489(7414):57–74. doi: 10.1038/nature11247. [DOI] [PMC free article] [PubMed] [Google Scholar]
- 30.Ernst J, et al. Mapping and analysis of chromatin state dynamics in nine human cell types. Nature. 2011;473(7345):43–49. doi: 10.1038/nature09906. [DOI] [PMC free article] [PubMed] [Google Scholar]
- 31.Thurman RE, et al. The accessible chromatin landscape of the human genome. Nature. 2012;489(7414):75–82. doi: 10.1038/nature11232. [DOI] [PMC free article] [PubMed] [Google Scholar]
- 32.Neph S, et al. An expansive human regulatory lexicon encoded in transcription factor footprints. Nature. 2012;489(7414):83–90. doi: 10.1038/nature11212. [DOI] [PMC free article] [PubMed] [Google Scholar]
- 33.Cantor AB, Orkin SH. Transcriptional regulation of erythropoiesis: an affair involving multiple partners. Oncogene. 2002;21(21):3368–3376. doi: 10.1038/sj.onc.1205326. [DOI] [PubMed] [Google Scholar]
- 34.Tallack MR, et al. A global role for KLF1 in erythropoiesis revealed by ChIP-seq in primary erythroid cells. Genome Res. 2010;20(8):1052–1063. doi: 10.1101/gr.106575.110. [DOI] [PMC free article] [PubMed] [Google Scholar]
- 35.Soler E, et al. The genome-wide dynamics of the binding of Ldb1 complexes during erythroid differentiation. Genes Dev. 2010;24(3):277–289. doi: 10.1101/gad.551810. [DOI] [PMC free article] [PubMed] [Google Scholar]
- 36.Tsiftsoglou AS, Vizirianakis IS, Strouboulis J. Erythropoiesis: model systems, molecular regulators, and developmental programs. IUBMB Life. 2009;61(8):800–830. doi: 10.1002/iub.226. [DOI] [PubMed] [Google Scholar]
- 37.Song SH, Hou C, Dean A. A positive role for NLI/Ldb1 in long-range beta-globin locus control region function. Mol Cell. 2007;28(5):810–822. doi: 10.1016/j.molcel.2007.09.025. [DOI] [PMC free article] [PubMed] [Google Scholar]
- 38.Drissen R, et al. The active spatial organization of the beta-globin locus requires the transcription factor EKLF. Genes Dev. 2004;18(20):2485–2490. doi: 10.1101/gad.317004. [DOI] [PMC free article] [PubMed] [Google Scholar]
- 39.Vakoc CR, et al. Proximity among distant regulatory elements at the beta-globin locus requires GATA-1 and FOG-1. Mol Cell. 2005;17(3):453–462. doi: 10.1016/j.molcel.2004.12.028. [DOI] [PubMed] [Google Scholar]
- 40.Deng W, et al. Controlling long-range genomic interactions at a native locus by targeted tethering of a looping factor. Cell. 2012;149(6):1233–1244. doi: 10.1016/j.cell.2012.03.051. [DOI] [PMC free article] [PubMed] [Google Scholar]
- 41.Bulger M, Groudine M. Functional and mechanistic diversity of distal transcription enhancers. Cell. 2011;144(3):327–339. doi: 10.1016/j.cell.2011.01.024. [DOI] [PMC free article] [PubMed] [Google Scholar]
- 42.Stadhouders R, et al. Multiplexed chromosome conformation capture sequencing for rapid genome-scale high-resolution detection of long-range chromatin interactions. Nat Protoc. 2013;8(3):509–524. doi: 10.1038/nprot.2013.018. [DOI] [PubMed] [Google Scholar]
- 43.Splinter E, et al. CTCF mediates long-range chromatin looping and local histone modification in the beta-globin locus. Genes Dev. 2006;20(17):2349–2354. doi: 10.1101/gad.399506. [DOI] [PMC free article] [PubMed] [Google Scholar]
- 44.Ribeiro de Almeida C, et al. The DNA-binding protein CTCF limits proximal Vkappa recombination and restricts kappa enhancer interactions to the immunoglobulin kappa light chain locus. Immunity. 2011;35(4):501–513. doi: 10.1016/j.immuni.2011.07.014. [DOI] [PubMed] [Google Scholar]
- 45.Norton N, et al. Universal, robust, highly quantitative SNP allele frequency measurement in DNA pools. Hum Genet. 2002;110(5):471–478. doi: 10.1007/s00439-002-0706-6. [DOI] [PubMed] [Google Scholar]
- 46.Freedman ML, et al. Principles for the post-GWAS functional characterization of cancer risk loci. Nat Genet. 2011;43(6):513–518. doi: 10.1038/ng.840. [DOI] [PMC free article] [PubMed] [Google Scholar]
- 47.Tuupanen S, et al. The common colorectal cancer predisposition SNP rs6983267 at chromosome 8q24 confers potential to enhanced Wnt signaling. Nat Genet. 2009;41(8):885–890. doi: 10.1038/ng.406. [DOI] [PubMed] [Google Scholar]
- 48.Pomerantz MM, et al. The 8q24 cancer risk variant rs6983267 shows long-range interaction with MYC in colorectal cancer. Nat Genet. 2009;41(8):882–884. doi: 10.1038/ng.403. [DOI] [PMC free article] [PubMed] [Google Scholar]
- 49.Visser M, Kayser M, Palstra RJ. HERC2 rs12913832 modulates human pigmentation by attenuating chromatin-loop formation between a long-range enhancer and the OCA2 promoter. Genome Res. 2012;22(3):446–455. doi: 10.1101/gr.128652.111. [DOI] [PMC free article] [PubMed] [Google Scholar]
- 50.Saleque S, et al. Epigenetic regulation of hematopoietic differentiation by Gfi-1 and Gfi-1b is mediated by the cofactors CoREST and LSD1. Mol Cell. 2007;27(4):562–572. doi: 10.1016/j.molcel.2007.06.039. [DOI] [PubMed] [Google Scholar]
- 51.Sullivan J, et al. Identification of the major positive regulators of c-myb expression in hematopoietic cells of different lineages. J Biol Chem. 1997;272(3):1943–1949. doi: 10.1074/jbc.272.3.1943. [DOI] [PubMed] [Google Scholar]
- 52.Lu J, et al. MicroRNA-mediated control of cell fate in megakaryocyte-erythrocyte progenitors. Dev Cell. 2008;14(6):843–853. doi: 10.1016/j.devcel.2008.03.012. [DOI] [PMC free article] [PubMed] [Google Scholar]
- 53.Zhao H, et al. The c-myb proto-oncogene and microRNA-15a comprise an active autoregulatory feedback loop in human hematopoietic cells. Blood. 2009;113(3):505–516. doi: 10.1182/blood-2008-01-136218. [DOI] [PMC free article] [PubMed] [Google Scholar]
- 54.de Laat W, Grosveld F. Spatial organization of gene expression: the active chromatin hub. Chromosome Res. 2003;11(5):447–459. doi: 10.1023/A:1024922626726. [DOI] [PubMed] [Google Scholar]
- 55.Fujiwara T, et al. Discovering hematopoietic mechanisms through genome-wide analysis of GATA factor chromatin occupancy. Mol Cell. 2009;36(4):667–681. doi: 10.1016/j.molcel.2009.11.001. [DOI] [PMC free article] [PubMed] [Google Scholar]
- 56.Spitz F, Furlong EE. Transcription factors: from enhancer binding to developmental control. Nat Rev Genet. 2012;13(9):613–626. doi: 10.1038/nrg3207. [DOI] [PubMed] [Google Scholar]
- 57.Jolma A, et al. DNA-binding specificities of human transcription factors. Cell. 2013;152(1–2):327–339. doi: 10.1016/j.cell.2012.12.009. [DOI] [PubMed] [Google Scholar]
- 58.Valouev A, et al. Determinants of nucleosome organization in primary human cells. Nature. 2011;474(7352):516–520. doi: 10.1038/nature10002. [DOI] [PMC free article] [PubMed] [Google Scholar]
- 59.Lower KM, et al. Analysis of sequence variation underlying tissue-specific transcription factor binding and gene expression. Human Mutat. 2013;34(8):1140–1148. doi: 10.1002/humu.22343. [DOI] [PubMed] [Google Scholar]
- 60.Corradin O, et al. Combinatorial effects of multiple enhancer variants in linkage disequilibrium dictate levels of gene expression to confer susceptibility to common traits. Genome Res. 2014;24(1):1–13. doi: 10.1101/gr.164079.113. [DOI] [PMC free article] [PubMed] [Google Scholar]
- 61.Bianchi E, et al. c-Myb supports erythropoiesis through the transactivation of KLF1 and LMO2 expression. Blood. 2010;116(22):e99–110. doi: 10.1182/blood-2009-08-238311. [DOI] [PubMed] [Google Scholar]
- 62.Stamatoyannopoulos G. Control of globin gene expression during development and erythroid differentiation. Exp Hematol. 2005;33(3):259–271. doi: 10.1016/j.exphem.2004.11.007. [DOI] [PMC free article] [PubMed] [Google Scholar]
- 63.Sankaran VG, et al. Cyclin D3 coordinates the cell cycle during differentiation to regulate erythrocyte size and number. Genes Dev. 2012;26(18):2075–2087. doi: 10.1101/gad.197020.112. [DOI] [PMC free article] [PubMed] [Google Scholar]
- 64.Borg J, et al. Haploinsufficiency for the erythroid transcription factor KLF1 causes hereditary persistence of fetal hemoglobin. Nat Genet. 2010;42(9):801–805. doi: 10.1038/ng.630. [DOI] [PMC free article] [PubMed] [Google Scholar]
- 65.Sankaran VG, et al. Human fetal hemoglobin expression is regulated by the developmental stage-specific repressor BCL11A. Science. 2008;322(5909):1839–1842. doi: 10.1126/science.1165409. [DOI] [PubMed] [Google Scholar]
- 66.Tallack MR, Perkins AC. Three fingers on the switch: Kruppel-like factor 1 regulation of gamma-globin to beta-globin gene switching. Curr Opin Hematol. 2013;20(3):193–200. doi: 10.1097/MOH.0b013e32835f59ba. [DOI] [PubMed] [Google Scholar]
- 67.Zhou D, et al. KLF1 regulates BCL11A expression and gamma- to beta-globin gene switching. Nat Genet. 2010;42(9):742–744. doi: 10.1038/ng.637. [DOI] [PubMed] [Google Scholar]
- 68.Koehler AN. A complex task? Direct modulation of transcription factors with small molecules. Curr Opin Chem Biol. 2010;14(3):331–340. doi: 10.1016/j.cbpa.2010.03.022. [DOI] [PMC free article] [PubMed] [Google Scholar]
- 69.Gaj T, Gersbach CA, Barbas CF., 3rd ZFN, TALEN, and CRISPR/Cas-based methods for genome engineering. Trends Biotechnol. 2013;31(7):397–405. doi: 10.1016/j.tibtech.2013.04.004. [DOI] [PMC free article] [PubMed] [Google Scholar]
- 70.Bauer DE, et al. An erythroid enhancer of BCL11A subject to genetic variation determines fetal hemoglobin level. Science. 2013;342(6155):253–257. doi: 10.1126/science.1242088. [DOI] [PMC free article] [PubMed] [Google Scholar]
- 71.Mendenhall EM, et al. Locus-specific editing of histone modifications at endogenous enhancers. Nat Biotechnol. 2013;31(12):1133–1136. doi: 10.1038/nbt.2701. [DOI] [PMC free article] [PubMed] [Google Scholar]
- 72.Zuber J, et al. An integrated approach to dissecting oncogene addiction implicates a Myb-coordinated self-renewal program as essential for leukemia maintenance. Genes Dev. 2011;25(15):1628–1640. doi: 10.1101/gad.17269211. [DOI] [PMC free article] [PubMed] [Google Scholar]
- 73.Craig JE, et al. Dissecting the loci controlling fetal haemoglobin production on chromosomes 11p and 6q by the regressive approach. Nature Genetics. 1996;12(1):58–64. doi: 10.1038/ng0196-58. [DOI] [PubMed] [Google Scholar]
- 74.van den Akker E, et al. The majority of the in vitro erythroid expansion potential resides in CD34(-) cells, outweighing the contribution of CD34(+) cells and significantly increasing the erythroblast yield from peripheral blood samples. Haematologica. 2010;95(9):1594–1598. doi: 10.3324/haematol.2009.019828. [DOI] [PMC free article] [PubMed] [Google Scholar]
- 75.Brouwer RW, et al. NARWHAL, a primary analysis pipeline for NGS data. Bioinformatics. 2012;28(2):284–285. doi: 10.1093/bioinformatics/btr613. [DOI] [PubMed] [Google Scholar]
- 76.Thongjuea S, et al. r3Cseq: an R/Bioconductor package for the discovery of long-range genomic interactions from chromosome conformation capture and next-generation sequencing data. Nucleic Acids Res. 2013;41(13):e132. doi: 10.1093/nar/gkt373. [DOI] [PMC free article] [PubMed] [Google Scholar]
Associated Data
This section collects any data citations, data availability statements, or supplementary materials included in this article.