

Abstract
Insulin signaling in osteoblasts has been shown recently to contribute to whole-body glucose homeostasis in animals fed a normal diet; however, it is unknown whether bone contributes to the insulin resistance that develops in animals challenged by a high-fat diet (HFD). Here, we evaluated the consequences of osteoblast-specific overexpression of or loss of insulin receptor in HFD-fed mice. We determined that the severity of glucose intolerance and insulin resistance that mice develop when fed a HFD is in part a consequence of osteoblast-dependent insulin resistance. Insulin resistance in osteoblasts led to a decrease in circulating levels of the active form of osteocalcin, thereby decreasing insulin sensitivity in skeletal muscle. Insulin resistance developed in osteoblasts as the result of increased levels of free saturated fatty acids, which promote insulin receptor ubiquitination and subsequent degradation. Together, these results underscore the involvement of bone, among other tissues, in the disruption of whole-body glucose homeostasis resulting from a HFD and the involvement of insulin and osteocalcin cross-talk in glucose intolerance. Furthermore, our data indicate that insulin resistance develops in bone as the result of lipotoxicity-associated loss of insulin receptors.
Introduction
The regulation of glucose metabolism is a complex physiological process that relies on the interplay of multiple hormones that themselves act in many target organs (1–3). Among all the hormones involved in this process, insulin is the one with the broadest array of functions. Once released by pancreatic β cells, insulin favors glucose uptake in white adipose tissue (WAT) and muscle and suppresses gluconeogenesis in liver (4–6); the end result of all its actions is to decrease blood glucose levels. To fulfill its functions, insulin must bind first to its cognate receptor, a receptor tyrosine kinase expressed in hepatocytes, adipocytes, and myoblasts, but also many other cell types (7, 8). This latter observation raised the prospect that insulin signaling in additional target cells may contribute to whole-body glucose homeostasis.
In support of this hypothesis, we and others have shown that insulin signals in osteoblasts (9, 10), the bone-forming cells, to promote whole-body glucose homeostasis in two steps in mice fed a normal diet. By inhibiting the expression of an inhibitor of osteoclast differentiation, osteoprotegerin (Opg), insulin signaling in osteoblasts favors the differentiation of osteoclasts, the bone-resorbing cells (11). As a result, insulin signaling in osteoblasts favors the formation of resorption lacunae, and the low pH existing within these lacunae promotes decarboxylation, i.e., activation of osteocalcin (9), a bone-derived hormone that favors insulin secretion in pancreas and insulin sensitivity in liver, muscle, and WAT through yet unknown pathways (12, 13).
The demonstration that the osteoblast is an insulin target cell contributing in vivo to the maintenance of whole-body glucose homeostasis in animals fed a normal diet raises novel questions. The first one is to determine the contribution, if any, of insulin signaling in osteoblasts to the progression of type 2 diabetes. This can begin to be addressed by asking whether moderately increasing or decreasing insulin signaling in osteoblasts would affect the severity of the glucose intolerance and insulin resistance induced by a high-fat diet (HFD) in mice. If this is the case, a second question will then be to determine whether bone is a tissue in which insulin resistance develops in animals fed a HFD and the molecular bases of such a resistance if it exists.
The present study aimed to address these questions in the mouse. It shows that increasing or decreasing insulin signaling in osteoblasts improves or further compromises whole-body glucose homeostasis in mice that had been fed a HFD. It also shows that bone is a site of insulin resistance, which leads to a decrease in osteocalcin activity and thereby to a decrease in insulin sensitivity in WAT and muscle. This decrease in insulin signaling in osteoblasts seen in mice fed a HFD is caused in part by free saturated fatty acids (sFAs) that induce the ubiquitination of the insulin receptor in osteoblasts through a mechanism that is not shared with other classical insulin-sensitive cell types, such as hepatocytes.
Results
Increasing insulin signaling in osteoblasts weakens glucose intolerance in mice fed a HFD.
The fact that insulin signaling in osteoblasts is necessary for whole-body glucose homeostasis in animals fed a normal diet (9, 10) implies that mice harboring an increase in insulin signaling in osteoblasts may be partly protected from the deleterious consequences that a long-term HFD has on glucose tolerance and insulin sensitivity.
To test this hypothesis, we generated mice overexpressing the human insulin receptor (INSR) in osteoblasts only (Col1a1-INSRTg mice) through the use of a fragment of the mouse α1(I) collagen (Col1a1) promoter, which is active specifically in osteoblasts (14). One line of transgenic mice demonstrating a 1.5-fold increase in the expression of the insulin receptor in bones but not in other insulin target tissues, such as livers, muscles, and WAT, was used for further studies (Figure 1A). When fed a normal diet, Col1a1-INSRTg mice did not display any change in body weight or adiposity, as determined by gonadal fat pad weight (Figure 1, B and C). Likewise, glucose metabolism was normal in Col1a1-INSRTg mice fed a normal diet. Specifically, blood glucose levels and circulating insulin levels measured after feeding were indistinguishable between transgenic and WT littermates (Figure 1, D and E). The same was true for glucose tolerance measured by a glucose tolerance test (GTT) and insulin sensitivity measured by an insulin tolerance test (ITT) (Figure 1, F and G). Bone formation and bone resorption were also normal in Col1a1-INSRTg mice fed a normal diet, as were osteocalcin circulating levels (Supplemental Figure 1, A–C; supplemental material available online with this article; doi: 10.1172/JCI72323DS1). These results indicate that a 1.5-fold increase in expression of the insulin receptor in osteoblasts is not enough to affect bone remodeling and therefore glucose homeostasis in a measurable manner in mice fed a normal chow. Expression of Glut1, Glut3, and Glut4, 3 glucose transporter genes, was not elevated in bones of the Col1a1-INSRTg mice fed a normal chow or a HFD (Supplemental Figure 1D).
Figure 1. Increasing insulin signaling in osteoblasts weakens glucose intolerance in mice fed a HFD.

(A) Western blot analysis of INSR in calvaria bones and RT-PCR analysis of the expression of the Insr transgene in bones, livers, muscles, and WAT of WT and Col1a1-INSRTg mice. (B) Body weight and (C) gonadal fat pad weight in WT and Col1a1-INSRTg mice fed a normal diet (ND) or HFD (n = 8). (D) Random glucose levels in WT and Col1a1-INSRTg mice fed a normal diet or HFD (n = 8). (E) Random insulin levels in WT and Col1a1-INSRTg mice fed a normal diet or HFD (n = 8). (F) GTT and (G) ITT in WT and Col1a1-INSRTg mice fed a normal diet or HFD (n = 8). (H) Western blot analysis of the phosphorylation levels of INSR and AKT in muscles of WT and Col1a1-INSRTg mice fed a normal diet or a HFD. All Western blot experiments were repeated at least 3 times. *P < 0.05.
We next asked what would be the consequence of this overexpression of INSR when mice are fed a HFD. Col1a1-INSRTg and WT mice were fed from 6 to 14 weeks of age with a diet containing 58% kcal fat. As anticipated, this HFD resulted in obesity, hyperglycemia, hyperinsulinemia, glucose intolerance, and insulin insensitivity in WT mice (Figure 1, B–G). Col1a1-INSRTg mice also demonstrated evidence of obesity and insulin resistance; however, the weight of their gonadal fat pads was significantly lower than that of WT mice fed the same diet (Figure 1, B and C). Likewise, their circulating glucose and insulin levels measured after feeding were significantly lower than those seen in WT mice fed a HFD (Figure 1, D and E). As a matter of fact, a GTT performed in Col1a1-INSRTg mice fed a HFD revealed that they were not glucose intolerant (Figure 1F), while an ITT showed that Col1a1-INSRTg mice fed a HFD were significantly more sensitive to insulin than WT mice fed the same diet (Figure 1G). Consistent with the improved systemic insulin sensitivity, insulin signaling, as revealed by the levels of phosphorylation of AKT at S473, were restored in muscles but not in livers or WAT of Col1a1-INSRTg mice fed a HFD (Figure 1H and Supplemental Figure 1E). These results indicate that increasing insulin signaling in osteoblasts can protect mice from glucose intolerance and insulin resistance that otherwise develop with a HFD.
Compromising insulin signaling in osteoblasts worsens glucose intolerance in mice fed a HFD.
In view of the results presented above, we next asked whether, conversely, a moderate decrease of insulin signaling in osteoblasts would worsen the glucose intolerance and/or insulin resistance that otherwise develops in mice fed a HFD (15). For that purpose, we used mice lacking one allele of Insr in osteoblasts (Col1a1-Insr+/– mice) (9). The decrease in the Insr expression in bones of these mice is modest, about 32%, and no change of the expression of this gene could be detected in other insulin target tissues, such as livers, muscles, and WAT (Figure 2A). As was the case in mice overexpressing Insr in osteoblasts, when fed a normal diet, Col1a1-Insr+/– mice were indistinguishable from Insrfl/+ mice in terms of body weight, adiposity, circulating glucose and insulin levels after feeding, glucose tolerance, and insulin sensitivity (Figure 2, B–G). Bone formation and bone resorption parameters were normal in Col1a1-Insr+/– mice fed a normal diet, as were circulating osteocalcin levels (Supplemental Figure 2, A–C). Expression of Glut1, Glut3, and Glut4, 3 glucose transporter genes, was not different between Insrfl/+ and Col1a1-Insr+/– mice regardless of their diet (Supplemental Figure 2D).
Figure 2. Compromising insulin signaling in osteoblasts worsens glucose intolerance in mice fed a HFD.

(A) qPCR analysis of the expression of Insr in bones, livers, muscles, and WAT of Insrfl/+ and Col1a1-Insr+/– mice (n = 6). (B) Body weight and (C) gonadal fat pad weight in Insrfl/+ and Col1a1-Insr+/– mice fed a normal diet or HFD (n = 8). (D) Random glucose levels in Insrfl/+ and Col1a1-Insr+/– mice fed a normal diet or HFD (n = 8). (E) Random insulin levels in Insrfl/+ and Col1a1-Insr+/– mice fed a normal diet or HFD (n = 8). (F) GTT and (G) ITT in Insrfl/+ and Col1a1-Insr+/– mice fed a normal diet or HFD (n = 8). (H) Western blot analysis of the phosphorylation levels of INSR and AKT in muscles of WT and Col1a1-INSRTg mice fed a normal diet or a HFD. All Western blot experiments were repeated at least 3 times.*P < 0.05.
The situation was different, however, in 14-week-old Col1a1-Insr+/– mice fed a HFD for 8 weeks. Indeed, in these conditions, although Col1a1-Insr+/– mice became obese to a similar extent as Insrfl/+ mice fed the same diet (Figure 2, B and C), they developed metabolic abnormalities that were significantly more severe than what was seen in Insrfl/+ mice fed the same diet. Blood glucose levels and circulating insulin levels after feeding were both higher in Col1a1-Insr+/– mice fed a HFD than in Insrfl/+ mice fed the same diet (Figure 2, D and E). Glucose tolerance, as measured by a GTT, and insulin tolerance, as measured by an ITT, were also more severely impaired in Col1a1-Insr+/– mice fed a HFD than in Insrfl/+ mice fed the same HFD (Figure 2, F and G). Consistent with the more severe systemic insulin resistance, insulin signaling, as measured by the phosphorylation of INSR at Tyr 1150/1151 and AKT at S473, was further impaired in muscles but not in livers or WAT of Col1a1-Insr+/– mice fed a HFD (Figure 2H and Supplemental Figure 2E).
Taken together, results gathered through the analyses of these gain- and loss-of-function models of insulin signaling in osteoblasts support the notion that the degree of insulin signaling in osteoblasts is one determinant of the severity of the whole-body glucose intolerance and insulin resistance that develop upon long-term feeding with a HFD.
Insulin resistance develops in bone of mice fed a HFD.
In order to understand how modulating insulin signaling in osteoblasts could affect whole-body glucose homeostasis in animals fed a HFD, we asked whether bone was a site of insulin resistance. To that end, we compared insulin signaling in bones, muscles, WAT, and livers of WT mice fed a HFD from 6 to 14 weeks of age. Before starting this analysis, we verified that this nutritional manipulation had resulted in glucose intolerance and insulin resistance, as demonstrated by measurements of circulating levels of glucose and insulin, GTT, and ITT (Supplemental Figure 3, A–D). Circulating leptin levels were markedly elevated in WT mice fed a HFD, but the sympathetic tone remained normal, suggesting that this massive increase in circulating leptin levels did not translate in an increase in leptin signaling (16, 17) (Supplemental Figure 3E). Therefore, any change in bone mass observed in WT mice fed a HFD could not be ascribed to a change in the sympathetic tone. Circulating adiponectin (ADIPOQ) levels and Adipoq expression in WAT were decreased in WT, Col1a1-INSRTg, and Col1a1-Insr+/– mice fed a HFD compared with what was seen in the animals fed a normal chow (Supplemental Figure 3, F–K).
Next, we injected a bolus of insulin (0.5 U/kg body weight) intravenously for 15 minutes in 14-week-old WT mice fed either a HFD or a normal diet for 8 weeks. Protein samples from bones, livers, muscles, and WAT were then extracted and analyzed by Western blotting. This analysis showed that intracellular signaling events that were substantially enhanced by insulin signaling in mice fed a normal diet, such as phosphorylation of AKT at Thr308 and, even more so, at Ser473 and phosphorylation of GSK3β at Ser9, were only modestly increased in bones, livers, muscles, and WAT of mice fed a HFD (Figure 3A). Phosphorylation of the insulin receptor at Tyr 1150/1151 was also significantly decreased in the livers, muscles, WAT, and bones of mice fed a HFD when compared with the same tissues originating from mice fed a normal diet (Figure 3A). Phosphorylation levels of INSR and AKT were also more decreased in bones of Col1a1-Insr+/– mice fed a HFD than in bones of Insrfl/+ mice fed the same diet (Figure 3B) and decreased less so in bones of Col1a1-INSRTg mice fed a HFD than in those of WT mice fed the same diet (Figure 3C).
Figure 3. Insulin resistance develops in bones of mice fed a HFD.

(A) Western blot analysis of the phosphorylation levels of INSR, AKT, and GSK3β in bones, livers, muscles, and WAT of WT mice fed a normal diet or a HFD. (B) Western blot analysis of phosphorylation levels of INSR and AKT in bones of Insrfl/+ and Col1a1-Insr+/– mice fed a normal diet or a HFD. (C) Western blot analysis of the phosphorylation levels of INSR and AKT in bones of WT and Col1a1-INSRTg mice fed a normal diet or a HFD. All Western blot experiments were repeated at least 3 times. *P < 0.05.
HFD decreases bone resorption in an insulin-dependent manner.
How could disruption of insulin signaling in osteoblasts worsen glucose intolerance in mice fed a HFD? One molecular event triggered by insulin signaling in osteoblasts is the inhibition of the expression of Opg, a decoy receptor for RANKL and an inhibitor of osteoclast differentiation and bone resorption (9, 11). Thus, we asked whether Opg expression, bone resorption parameters, and bone mass were affected in HFD-fed WT, Col1a1-INSRTg, and Col1a1-Insr+/– mice.
As shown in Figure 4A, Opg expression was increased almost 2-fold in bones of WT mice fed a HFD compared with those of mice fed a normal diet, while Rankl expression was unaffected. The same was true in bones of Col1a1-Insr+/– mice fed a HFD compared with bones obtained from Insrfl/+ mice fed the same diet (Figure 4B). Conversely, Opg expression was decreased in bones of Col1a1-INSRTg mice fed a HFD compared with what was seen in bones obtained from WT mice fed the same diet; again Rankl expression was not affected (Figure 4C). We had shown before that insulin signaling in osteoblasts, by favoring osteoclast differentiation, also increases the expression of at least 2 genes in osteoclasts, Ctsk and Tcirg1, that can be used as a readout of insulin signaling in osteoblasts (9, 11). Expression of these 2 genes was decreased in bones of WT or Col1a1-Insr+/– mice fed a HFD compared with what was seen in bones of control littermates fed a HFD and increased in bones of Col1a1-INSRTg mice fed a HFD compared with WT littermates fed the same HFD (Figure 4, A–C). Consistent with these molecular abnormalities, serum levels of carboxyterminal collagen crosslinks (Ctx), the proteolytic fragments of type 1 collagen that are formed during bone resorption (18, 19), were decreased in WT and Col1a1-Insr+/– mice fed a HFD compared with what was seen in WT mice fed a normal diet or in Insrfl/+ mice fed the same HFD (Figure 4, D and E). Conversely, circulating levels of Ctx were less decreased in Col1a1-INSRTg mice fed a HFD than in WT mice fed the same diet (Figure 4F).
Figure 4. HFD decreases bone resorption in an insulin-dependent manner.

(A) qPCR analysis of the expression of Opg, Rankl, Ctsk, and Tcirg1 in bones of WT mice fed a normal diet or a HFD (n = 4); (B) Insrfl/+ and Col1a1-Insr+/– mice fed a HFD (n = 7); and (C) WT and Col1a1-INSRTg mice fed a HFD (n = 6). (D) Serum Ctx levels in WT mice fed a normal diet or a HFD (n = 8). (E) Serum Ctx levels in Insrfl/+ and Col1a1-Insr+/– mice fed a normal diet or a HFD (n = 8). (F) Serum Ctx levels in WT and Col1a1-INSRTg mice fed a normal diet or a HFD (n = 8). (G) Histomorphometric analysis of vertebrae of WT mice fed a normal diet or HFD (n = 8), (H) Col1a1-Insr+/– mice fed a normal diet or HFD (n = 8), and (I) Col1a1-INSRTg mice fed a normal diet or HFD (n = 8). Mineralized bone volume over the total tissue volume (BV/TV), osteoclast surface per bone surface (Oc.S./BS), and bone formation rate per bone surface (BFR/BS) were measured. (J) Serum PINP levels in WT (n = 6), (K) Col1a1-INSRTg (n = 6), and (L) Col1a1-Insr+/– (n = 6) mice fed a normal diet or a HFD. qPCR analysis of the expression of Ocn, Col1a1, Osterix, and Runx2 in bones of (M) WT (n = 4), (N) Col1a1-Insr+/– (n = 5), and (O) Col1a1-INSRTg (n = 5) mice fed a normal diet or a HFD. *P < 0.05.
Bone formation was also affected by HFD, since bone formation rate, serum levels of PINP, a biomarker of bone formation, and Col1a1 expression were all decreased in WT, Col1a1-INSRTg, and Col1a1-Insr+/– mice fed a HFD compared with what was observed when these mice were fed a normal diet (Figure 4, G–L). However, Ocn expression was not affected by a HFD in any of the mutant mouse strains tested (Figure 4, M–O). A consequence of these molecular and biochemical abnormalities is that WT and Col1a1-Insr+/– mice fed a HFD developed a high bone mass phenotype, mainly due to a decrease in the number of osteoclasts (Figure 4, G and H). Conversely, mice overexpressing INSR in osteoblasts did not develop a high bone mass and maintained a normal number of osteoclasts when fed a HFD (Figure 4I). Of note, microtomography analysis showed that the increase of bone mass in WT mice fed a HFD was also seen in the trabecular region of proximal femurs but not in the cortical bones (Supplemental Figure 4, A–C). Taken together, these molecular, biochemical, and histological analyses reveal that HFD, by compromising insulin signaling in osteoblasts, inhibits both arms of bone remodeling.
Insulin resistance in bone affects whole-body glucose homeostasis in mice fed a HFD by decreasing osteocalcin activity.
Even though osteocalcin expression was not affected in any of the mouse models presented, the decrease in bone resorption caused by insulin resistance implied that decreasing insulin signaling in osteoblasts would worsen glucose intolerance by decreasing activation of osteocalcin, a hormone whose activity is determined by bone resorption (9, 10). Indeed, there was a decrease in the circulating levels of the active form of osteocalcin (Glu13-Ocn) (9) in WT mice fed a HFD compared with what was seen in WT mice fed a normal diet (Figure 5A). The same was true in Col1a1-Insr+/– mice fed a HFD compared with that in Insrfl/+ mice fed a HFD (Figure 5B). On the other hand, circulating levels of Glu13-Ocn were increased in Col1a1-INSRTg mice fed a HFD compared with those of WT mice fed the same diet (Figure 5C).
Figure 5. Insulin resistance in bone affects whole-body glucose homeostasis in mice fed a HFD by decreasing osteocalcin activity.

(A) Serum osteocalcin levels in WT mice fed a normal diet or a HFD (n = 8). (B) Serum osteocalcin levels in Insrfl/+ and Col1a1-Insr+/– mice fed a normal diet or a HFD (n = 8). (C) Serum osteocalcin levels in WT and Col1a1-INSRTg mice fed a normal diet or a HFD (n = 8). (D) Serum osteocalcin levels in vehicle-treated Insrfl/+ and Col1a1-Insr+/– mice and osteocalcin-treated Col1a1-Insr+/– mice fed a HFD for 8 weeks (n = 8). (E) GTT and (F) ITT of vehicle-treated Insrfl/+ and Col1a1-Insr+/– mice and OCN-treated Col1a1-Insr+/– mice fed a HFD (n = 8). (G) Serum osteocalcin levels in WT and Ocn+/– mice fed a normal diet or a HFD (n = 8). (H) Random glucose and (I) insulin levels in WT and Ocn+/– mice fed a normal diet or a HFD (n = 8). (J) GTT and (K) ITT of WT and Ocn+/– mice fed a normal diet or a HFD (n = 8). *P ≤ 0.05.
If disruption of insulin signaling in osteoblasts in mice fed a HFD contributes to whole-body glucose intolerance and insulin resistance because it hampers osteocalcin activation, then correcting this latter abnormality should improve glucose metabolism in Col1a1-Insr+/– mice fed a HFD. This contention was tested by daily injections of recombinant uncarboxylated osteocalcin (30 ng/g body weight) that normalized the circulating levels of Glu13-Ocn in Col1a1-Insr+/– mice fed a HFD (Figure 5D). This manipulation also had a beneficial influence on glucose metabolism in these mice, since their glucose tolerance and insulin sensitivity were improved to the levels seen in Insrfl/+ mice fed the same HFD (Figure 5, E and F).
A second implication of the results presented above is that decreasing, even moderately, osteocalcin synthesis should worsen glucose intolerance and insulin insensitivity in mice fed a HFD. Ocn+/– mice showed a modest, only 30%, decrease in the circulating levels of total osteocalcin and a nonsignificant decrease in the circulating levels of Glu13-Ocn when fed a normal diet (Figure 5G). These mice had a normal glucose homeostasis when fed a normal diet (Figure 5, H–K), probably because the decrease in osteocalcin circulating levels is too modest. However, when they had been fed a HFD for 8 weeks, Ocn+/– mice developed a more severe glucose intolerance and insulin insensitivity than that of WT mice fed the same diet, as determined by their circulating levels of glucose and insulin, GTT, and ITT (Figure 5, H–K). There was also a significant decrease in the circulating levels of Glu13-Ocn in Ocn+/– mice fed a HFD compared with what was detected in WT mice fed the same HFD (Figure 5G). These experiments support the notion that insulin resistance in bone contributes to the deleterious consequences of a long-term HFD on whole-body glucose homeostasis, in part because it decreases the activity of osteocalcin.
SMURF1-mediated insulin receptor ubiquitination contributes to the development of insulin resistance in osteoblasts.
What are the molecular bases of the insulin resistance that develops in bones of mice fed a HFD? Since a frequently advanced cause for insulin resistance in other insulin target cells is lipotoxicity caused by intracellular accumulation of excessive levels of free sFAs and their metabolized intermediates (20, 21), we asked whether this mechanism was also at play in bone and in osteoblasts.
Circulating levels of total free fatty acids, and in particular of several free sFAs, such as laurate (C12), myristate (C14), and stearate (C18), were significantly increased in WT mice fed a HFD (Table 1) Remarkably, the same was true for their bone contents (Table 2). Accordingly, the content in bones of total diacylglycerols (DAGs), a group of lipid intermediate metabolites thought to account for lipotoxicity and insulin resistance in other insulin target cells (22), was significantly elevated (Figure 6A). Moreover, as shown in Figure 6B, treatment of osteoblasts with sFAs markedly blunted the ability of insulin to phosphorylate INSR and AKT in mouse osteoblasts. Among all the sFAs tested, stearate, a long-chain sFA, was of particular interest, because it also decreased the accumulation of INSR, as seen in bones of mice fed a HFD (Figure 3A and Figure 6B). Stearate decreased the accumulation of INSR in osteoblasts at a concentration as low as 100 μM and at as early as 24 hours at a concentration of 200 μM (Figure 6, C and D). Stearate treatment of WT osteoblasts in culture decreased Col1a1 and Atf4 (23) expression in these cells as well as their ability to form mineralization nodules (Figure 6, E and F).
Table 1.
Serum FFA profile of WT mice fed a ND or a HFD
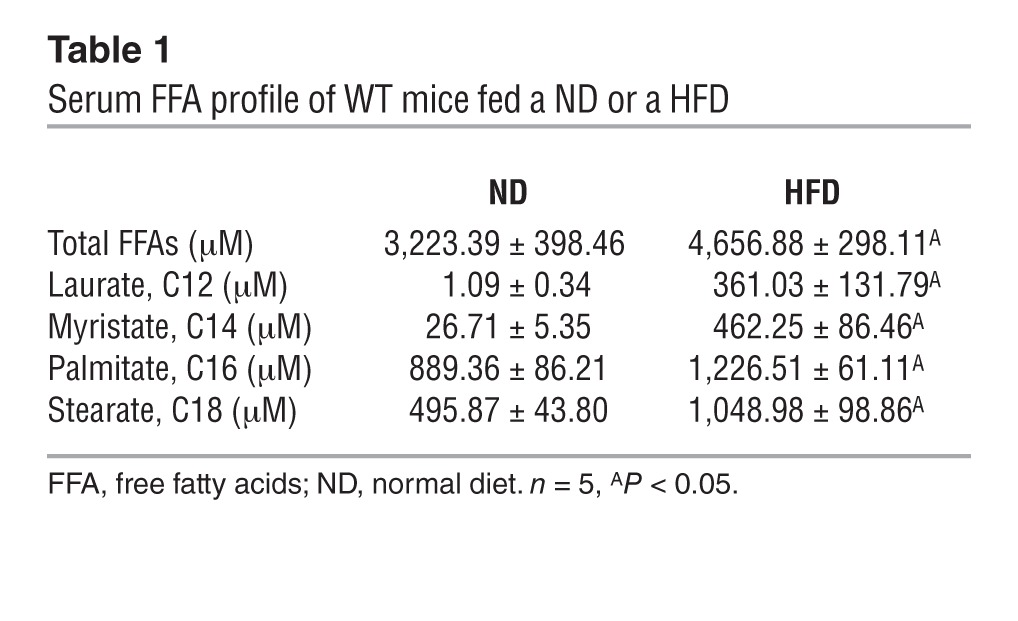
Table 2.
FFA content in bones of WT mice fed a ND or a HFD
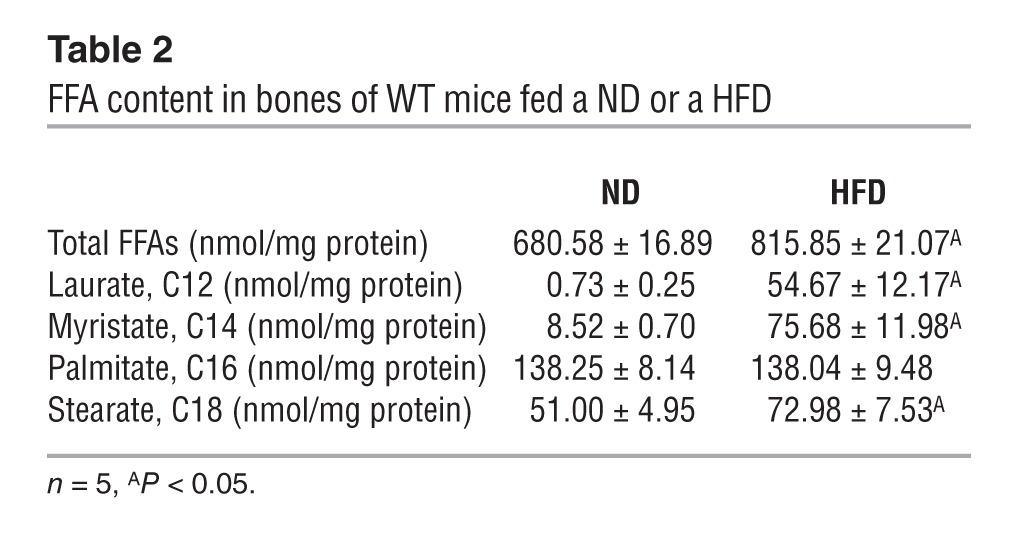
Figure 6. Lipotoxicity caused insulin resistance in osteoblasts.

(A) DAG content in bones of WT mice fed a normal diet or a HFD (n = 5). (B) Western blot analysis of the phosphorylation levels of INSR and AKT in primary osteoblasts treated with 200 μM sFAs or vehicle for 48 hours. < denotes a nonspecific band detected by the phospho-insulin receptor β (Tyr1150/1151) antibody (no. 3024, Cell Signaling Inc.). (C) Western blot analysis of levels of total INSR in primary osteoblasts treated with 200 μM stearate for 0 to 48 hours. (D) Western blot analysis of levels of total INSR in primary osteoblasts treated with 0 to 800 μM stearate for 48 hours. (E) qPCR analysis of the expression of osteoblast marker genes in primary osteoblasts treated with 200 μM stearate for 24 hours (n = 6). (F) Mineralization nodules in primary osteoblasts treated with 200 μM stearate for 6 days (n = 6). (G) qPCR analysis of the expression of Insr in bones of WT mice fed a normal diet or a HFD (n = 7). (H) qPCR analysis of the expression of Insr in primary osteoblasts treated with 200 μM sFAs or vehicle (n = 6). (I) Western blot analysis of levels of total and ubiquitinated forms of INSR in primary osteoblasts treated with 200 μM stearate or vehicle and/or 25 nM bortezomib. (J) Western blot analysis of insulin signaling in osteoblasts treated with 200 μM stearate or vehicle and/or 25 nM bortezomib. All Western blot experiments were repeated 3 times. *P ≤ 0.05.
Expression of Insr was not decreased in bones of mice fed a HFD or in osteoblasts treated with stearic acid (Figure 6, G and H), while the accumulation of the protein was decreased, indicating that these free sFAs affect mainly the stability of INSR. Consistent with this hypothesis, ubiquitination of the insulin receptor was increased in stearate-treated osteoblasts (Figure 6I). Treatment with bortezomib, a proteasome inhibitor that specifically binds the catalytic site of the 26S proteasome and thereby inhibits protein degradation, restored the accumulation of INSR in stearate-treated osteoblasts to the levels seen in vehicle-treated osteoblasts and also partially restored the insulin signaling in stearate-treated osteoblasts (Figure 6, I and J).
To explain how INSR could be ubiquitinated, we examined the expression of multiple genes encoding E3 ubiquitin ligases in osteoblasts that had been treated with sFAs and in bones of mice fed a HFD. This assay revealed that the expression of 3 E3 ubiquitin ligases, Smurf1, Smurf2, and Btrc, was significantly increased in osteoblasts treated with either palmitate or stearate (Figure 7A) and in bones of mice fed a HFD (Figure 7B). Of note, Smurf1 expression was not increased in muscles, livers, and WAT of mice fed a HFD (Figure 7C). Since INSR protein levels were also decreased in livers and muscles of mice fed a HFD diet (Figure 3A), we also examined the ubiquitination levels of INSR in these 2 tissues and observed that muscle but not liver showed an increase in ubiquitination levels of INSR (Figure 7D). This is consistent with recent findings showing that E3 ubiquitin ligase MG53 targets INSR for ubiquitin-dependent degradation in skeletal muscle of mice fed a HFD (24).
Figure 7. SMURF1-mediated insulin receptor ubiquitination contributes to the development of insulin resistance in osteoblasts.

(A) qPCR analysis of the expression of E3 ubiquitin ligases genes in primary osteoblasts treated with 200 μM sFAs or vehicle (n = 6). (B and C) qPCR analysis of the expression of Smurf1, Smurf2, and Btrc in (B) bones (n = 7) and (C) livers, muscles, and WAT of WT mice fed a normal diet or a HFD (n = 8). (D) Western blot analysis of levels of total and ubiquitinated forms of INSR in livers and muscles of mice fed a HFD. (E) Western blot analysis of the accumulation of INSR in COS cells cotransfected with Smurf WT, Smurf1 C699A, Smurf2 WT, Smurf2 C716A, or Btrc. (F) Western blot analysis of the accumulation of INSR in COS cells cotransfected with Insr and Smurf1 and treated with vehicle, lactacystin (50 μM), MG115 (25 μM), or bortezomib (25 nM) for 8 hours. (G) Western blot analysis of the interaction between SMURF1 and INSR following coimmunoprecipitation and SMURF1-dependent ubiquitination of INSR in COS cells. (H) Western blot analysis of the interaction between endogenous SMURF1 and INSR following coimmunoprecipitation in osteoblasts. (I) Western blot analysis of insulin signaling in WT and Smurf1–/– osteoblasts treated with 200 μM stearate or vehicle and/or 10 nM insulin. All Western blot experiments were repeated 3 times. *P ≤ 0.05.
To determine whether any of these ubiquitin ligases promote degradation of INSR, we coexpressed each of them individually with Insr in COS cells. A Western blot analysis indicated that only SMURF1 could decrease the accumulation of INSR (Figure 7E). This involvement of SMURF1 in INSR degradation was blocked when the ubiquitin ligase activity of SMURF1 was inhibited by mutagenesis (Smurf1 C699A, Figure 7E) or when cells were treated with proteasome inhibitors (Figure 7F). Moreover, coimmunoprecipitation experiments revealed that SMURF1 interacted with INSR and mediated its ubiquitination in COS cells and in osteoblasts (Figure 7, G and H). To further support the notion that SMURF1 may lead to ubiquitination of INSR in osteoblasts, we asked whether modulation of Smurf1 in this cell type would normalize INSR accumulation in osteoblasts and rescue, at least partially, the insulin resistance caused by stearate. We treated Smurf1–/– osteoblasts with stearate and observed that removing Smurf1 in osteoblasts normalized the accumulation of INSR and partially recovered the phosphorylation levels of INSR and AKT (Figure 7I). Taken together, these results suggest that by activating the SMURF1 pathway, sFAs inhibit insulin signaling in osteoblasts.
Discussion
This study provides genetic evidence that, in the mouse, bone is a site of insulin resistance and that this event contributes to the severity of glucose intolerance and insulin resistance in the entire organism in animals fed a HFD. It also provides one molecular mechanism that appears to be specific to osteoblasts to explain how insulin resistance in bone affects whole-body glucose homeostasis (Figure 8). This insulin resistance in bone might contribute to whole-body insulin resistance in patients with type 2 diabetes. We should emphasize here that our results do not imply that bone is more important than any classical insulin target tissues in the regulation of whole-body glucose homeostasis.
Figure 8. Model of insulin resistance in bone.

The recent realization that the osteoblast is a novel insulin target cell needed for whole-body glucose metabolism in animals fed a normal diet (9, 10) raised immediately the question of whether the degree of insulin signaling in osteoblasts affects glucose homeostasis in HFD feeding conditions. To address this question, we relied on the use of mice with mildly elevated or decreased insulin signaling in osteoblasts. None of the mouse models we used in this study display any glucose metabolism disturbance when fed a normal diet; yet even a mild increase or decrease of insulin signaling in osteoblasts resulted in protection or worsening, respectively, of glucose intolerance and insulin resistance in animals fed a HFD. These results indicate that in vivo insulin signaling in osteoblasts is a contributor to the maintenance of whole-body glucose homeostasis in challenging nutritional situations. Unfortunately, we do not know at the present time how osteocalcin increases insulin sensitivity. Consistent with these observations, a molecular analysis of insulin signaling in osteoblasts revealed that this pathway is hampered in bones of mice fed a HFD.
Our investigation shows that insulin resistance in bone causes a decrease in the circulating levels of the bone-derived hormone osteocalcin, which itself is needed for optimal insulin sensitivity in muscle and WAT (9, 12, 13, 25). We also noticed that the improvement of insulin sensitivity in Col1a1-INSRTg mice was of a lesser amplitude than what we observed for glucose tolerance. This observation is consistent with our previous work showing that a higher amount of osteocalcin is needed to affect insulin signaling in adipocytes than that needed to affect insulin secretion (12).
Although this may not be the only mechanism accounting for it, this insulin-dependent regulation of osteocalcin activity points toward a vicious circle that takes place in bones of animals challenged by HFD. Along with the recent demonstration that disrupting osteocalcin signaling in humans leads to glucose intolerance (26), these results add further credence, but in a pathological situation, to the notion that bone is a contributing tissue to the control of glucose homeostasis in mammals. However, results presented in this study do not exclude the possibility that, besides osteocalcin, other mechanisms also contribute to the development of insulin resistance in mice fed a HFD.
The analysis of the molecular bases of how insulin resistance develops in osteoblasts points toward some commonalities between this cell type and other insulin target cells. Indeed, our analysis showed that lipotoxicity develops in bones of mice fed a HFD and identified stearate as the main free sFA responsible for this lipotoxicity. We also noticed that, besides acting on the accumulation of INSR, sFAs blocked signaling transduction of the insulin action in osteoblasts, since medium-chain fatty acids, such as laurate and myristate, decreased phosphorylation levels of INSR and AKT without affecting the protein levels of the INSR.
However, this analysis also revealed differences between how insulin resistance develops in osteoblasts and other cell types. For instance, what appears to be different between osteoblasts and myoblasts is that insulin resistance develops in the former cell type because of a SMURF1-mediated ubiquitination of INSR. Previous studies of other cell types, such as hepatocytes, myoblasts, adipocytes, and lymphocytes, in diabetic conditions involving hyperinsulinemia had detected markedly reduced levels of the insulin receptor, which were considered to be a late event of insulin resistance and caused by desensitization of the INSR in face of abnormally high insulin levels (27–33). However, in osteoblasts, the degradation of the insulin receptor is induced directly by sFAs through their ability to upregulate Smurf1 expression and is one of the primary causes of the insulin resistance in these cells. This finding that points toward a novel molecular mechanism in the pathogenesis of insulin resistance does not exclude that other E3 ubiquitin ligases may also be involved in this process.
It has been established through studies in other insulin target cells that high levels of intracellular DAGs activate several serine kinases (22), such as c-Jun amino-terminal kinase (JNKs) (34), protein kinase C (PKCs) (35, 36), and IκB kinase β (IKKβ) (37, 38), which phosphorylate inhibitory serine residues of the insulin receptor and/or insulin receptor substrates (39–42) and thereby block insulin action. Although, we observed an increase in the level of phospho-IRS1 at Ser307 (Supplemental Figure 5A), in our hands, an osteoblast-specific deletion of Jnk1 did not affect insulin signaling in osteoblasts (data not shown). These negative results add indirectly more weight to the notion that SMURF1-mediated ubiquitination of the INSR in osteoblasts is an important mechanism to explain how insulin resistance develops in bone.
Methods
Mice generation.
Col1a1-Insr+/– mice were generated by intercrossing the progeny of crosses between Insrfl/fl mice (9) and Col1a1-Cre transgenic mice (14). Mice overexpressing INSR in osteoblasts only (Col1a1-INSRTg mice) were generated by pronuclear injection of a construct fusing the human INSR cDNA (isoform B) downstream of the osteoblast-specific fragment of the mouse Col1a1 promoter (14). Col1a1-Insr+/– and Col1a1-INSRTg mice had been backcrossed 4 or 2 times with C57BL/6 mice, respectively. Generation of Ocn+/– mice was previously reported (43); mice were backcrossed at least 4 times with 129Sv mice. Smurf1–/– mice were obtained as gift from Jeff Wrana (Lunenfeld-TanenbaumResearch Institute, Toronto, Ontario, Canada) (44). Control littermates were used in all experiments.
Metabolic studies and serum biochemistry.
Male mice were fed a HFD (58% kcal fat with sucrose, D12331, Research Diets Inc.) for up to 12 weeks, starting at 6 weeks of age, and metabolic analyses were performed after 8 weeks of HFD. Control mice were fed a regular diet (13.2% fat, no. 5053, PicoLab Rodent Diet 20). Measurement of random glucose levels, GTTs, and ITTs were performed, as described previously (13). ELISAs were used to measure mouse insulin (Mercodia), mouse Ctx (RatLaps, IDS), and total and undercarboxylated forms of mouse osteocalcin (45). Both insulin and osteocalcin were measured at random fed state, and Ctx was measured after overnight fasting in all mice analyzed.
Recombinant osteocalcin purification and daily injections.
Mouse uncarboxylated recombinant osteocalcin was purified as previously described (12). Recombinant osteocalcin was prepared in saline solution (0.9% NaCl) at a concentration of 3 ng/μl, and mice were injected i.p. with 10 μl/g body weight of this solution or with saline solution (vehicle). Mice were fed a HFD (58% kcal fat with sucrose, D12331, Research Diets Inc.), starting at 6 weeks of age, and daily injections of osteocalcin or vehicle were initiated at the same time for 8 to 12 weeks.
Cell culture and fatty acids treatment.
Primary mouse calvaria osteoblasts were isolated and cultured, as described previously (46). In brief, osteoblasts from calvaria of P2-5 pups were isolated by sequential digestion of 15, 30, and 45 minutes in 1x HHBS containing 1 mg/ml collagenase and 0.05% trypsin and were cultured in αMEM/10% FBS for 2 days. Thereafter, osteoblast differentiation was induced in αMEM/10% FBS medium supplemented with 5 mM β-glycerophosphate and 100 μg/ml ascorbic acid and replaced every 2 days for 7 to 14 days. COS cells were cultured in DMEM/10% FBS. sFAs purchased from Sigma-Aldrich (EC10A-1KT) were first dissolved in ethanol at concentration of 200 mM and then 1:20 diluted and coupled to 10% fatty acid free BSA (Sigma-Aldrich) at 65°C for 15 minutes. Fatty acids were added into cell culture medium at a 200 μM concentration for 2 days to induce lipotoxicity and insulin resistance. For examining insulin signaling, cells were fasted in medium with 0.5% FBS overnight, and protein samples were collected immediately following a 15-minute treatment with 10 nM insulin (Humulin, Eli Lilly).
Plasmids and DNA transfection experiments.
CMV-INSR was obtained as a gift from Domenico Accili (Department of Medicine, Columbia University). Flag-SMURF1 WT, Flag-SMURF1 C699A, Flag-SMURF2 WT, Flag-SMURF2 C716A (47), Myc-SMURF1 (48), and Myc-Btrc (49) were purchased from addgene.org. Flag-INSR was constructed by inserting a full-length cDNA fragment of mouse Insr into CMV14 expression plasmid (Sigma-Aldrich). Plasmid transfection experiments were performed in COS cells using Lipofectamin 2000 according to manufacturer’s protocol (Invitrogen).
Ubiquitination assay of the INSR.
Sixteen hours following plasmid transfection or sFA treatment, bortezomib was added into culture medium at a final concentration of 25 nM. Eight hours later, protein samples were extracted using 1x cell lysis buffer prepared according to the manufacturer’s recipe (Cell Signaling Technology Inc.), and about 250 to 500 μg proteins were used for the following immunoprecipitation assay according to a standard protocol (Cell Signaling Technology Inc.). Ubiquitination of INSR was assessed by immunoprecipitation of INSR using anti-FLAG (1:1,000, Sigma-Aldrich) or anti-INSR antibodies (1:50, Cell Signaling Technology Inc.), followed by immunoblotting using anti-UBIQUITIN antibody (1:1,000, Cell Signaling Technology Inc.).
RNA extraction and qPCR analysis.
For quantifying gene expression, RNA samples were purified using TRIZOL reagent (Invitrogen). Two micrograms total RNA was converted into cDNA using M-MLV reverse transcriptase (Invitrogen). qPCR analyses were performed using the CFX Connect Real-Time PCR System (Bio-Rad). Relative expression levels of each gene were normalized to the levels of 18S ribosomal RNA or β-actin.
Assessment of insulin signaling in vivo and Western blot analysis.
For examining insulin signaling in insulin target tissues in vivo, mice were first anesthetized with 2% inhaled isoflurane and then insulin solution was infused through inferior vena cava at a dose of 0.5 U/kg body weight. Tissue samples, including bones (calvaria, femurs, and tibias), livers, muscles (quadriceps), and WAT (gonadal fat), were then collected immediately after 15 minutes of insulin infusion and subjected to protein extraction and Western blot analysis. Protein samples were extracted using 1x cell lysis buffer (Cell Signaling Technology Inc.). Western blot analyses were carried out using standard protocol. All antibodies were obtained from Cell Signaling Technology Inc., with the exception of anti-FLAG and anti–β-actin (Sigma-Aldrich) and anti-SMURF1 (Santa Cruz Biotech Inc.). All Western blot experiments were repeated at least 3 times, with different sets of samples, throughout this study. Quantification of Western blots was performed using ImageJ. Protein levels were quantified and normalized to β-actin or GADPH levels. Relative protein levels were calculated with respect to control samples.
Bone histology and histomorphometry.
Bone histology and histomorphometry were performed at the site of L3 and L4 vertebrae, as described previously (50, 51). Histomorphometric analysis was performed using ImageJ and the Osteomeasure System (OsteoMetrics). Mineralized bone volume over the total tissue volume, osteoclast surface per bone surface, and bone formation rate per bone surface were measured.
μCT analysis.
Trabecular and cortical bone architecture of proximal femurs was assessed using a μCT system (VivaCT 40; SCANCO Medical AG). Trabecular bone volume, cortical bone volume, and midshaft thickness were analyzed using the standard software provided by the manufacturer of the μCT scanner.
Measurement of serum free fatty acids by LC/MS.
Serum and bone lipid samples were extracted with a chloroform/methanol extraction, as described previously (52). Levels of extracted lipids were measured on a Waters Xevo TQ MS ACQUITY UPLC system (Waters). Different lipid species were identified by comparing the retention times of experimental compounds with those of authentic standards. Concentrations of free fatty acids were quantitated by comparing integrated peak areas for those of each species against those of known amounts of purified standards. Total free fatty acid levels reflect the sum of all measured species.
Measurement of DAG content in bone.
For analysis of lipids, calvaria bone was snap frozen in liquid nitrogen and mechanically crushed. Following this, crushed bone was further homogenized in 20 mM Tris buffer containing protease inhibitors with an auto homogenizer. Samples were centrifuged at 300 g for 5 minutes to remove debris, and supernatants were transferred to fresh microtubes. Aliquots of homogenate were removed for estimation of protein concentration by the Bradford assay, and separate aliquots (2–300 μl containing a range of 0.45 to 0.8 mg protein) were analyzed for DAG levels by tandem LC/MS mass spectrometry at the Medical University of South Carolina Lipidomics Core, as described previously (53). Lipid levels measured (pmol) were normalized to cellular protein, and total lipid levels reflect the sum of all measured species.
Statistics.
All data are presented as mean ± SD. Statistical analyses were performed using unpaired, 2-tailed Student’s t test for comparison between 2 groups, 1-way ANOVA test for Figure 5, D–F, and 2-way ANOVA test for experiments involving 2 genotypes and 2 diets. For all experiments, P values less than or equal to 0.05 compared to control were considered significant.
Study approval.
All experiments involving mice were performed in compliance with federal laws and institutional guidelines and approved by the IACUC of Columbia University Animal Care Facility (protocol no. AC-AAAD1282).
Supplementary Material
Acknowledgments
We would like to thank P. Ducy and J. Pessin for critical reading of the manuscript and D. Accili for the gift of the human INSR cDNA expression construct. This work was supported by NIH grant R01AR045548 (to G. Karsenty) and Columbia University Mandl Connective Tissue Research Fellowship (to J. Wei).
Footnotes
Conflict of interest: The authors have declared that no conflict of interest exists.
Citation for this article:J Clin Invest. 2014;124(4):1781–1793. doi:10.1172/JCI72323.
See the related Commentary beginning on page 1465.
References
- 1.Poretsky L. Principles Of Diabetes Mellitus. New York, New York, USA: Springer; 2010. [Google Scholar]
- 2.Johnson AM, Olefsky JM. The origins and drivers of insulin resistance. Cell. 2013;152(4):673–684. doi: 10.1016/j.cell.2013.01.041. [DOI] [PubMed] [Google Scholar]
- 3.Muoio DM, Newgard CB. Mechanisms of disease: molecular and metabolic mechanisms of insulin resistance and β-cell failure in type 2 diabetes. Nat Rev Mol Cell Biol. 2008;9(3):193–205. doi: 10.1038/nrm2327. [DOI] [PubMed] [Google Scholar]
- 4.Ashcroft FM, Rorsman P. Diabetes mellitus and the β cell: the last ten years. Cell. 2012;148(6):1160–1171. doi: 10.1016/j.cell.2012.02.010. [DOI] [PMC free article] [PubMed] [Google Scholar]
- 5.Cheatham B, Kahn CR. Insulin action and the insulin signaling network. Endocr Rev. 1995;16(2):117–142. doi: 10.1210/edrv-16-2-117. [DOI] [PubMed] [Google Scholar]
- 6.Saltiel AR, Kahn CR. Insulin signalling and the regulation of glucose and lipid metabolism. Nature. 2001;414(6865):799–806. doi: 10.1038/414799a. [DOI] [PubMed] [Google Scholar]
- 7.Belfiore A, Frasca F, Pandini G, Sciacca L, Vigneri R. Insulin receptor isoforms and insulin receptor/insulin-like growth factor receptor hybrids in physiology and disease. Endocr Rev. 2009;30(6):586–623. doi: 10.1210/er.2008-0047. [DOI] [PubMed] [Google Scholar]
- 8.Kaplan SA. The insulin receptor. J Pediatr. 1984;104(3):327–336. doi: 10.1016/S0022-3476(84)81090-2. [DOI] [PubMed] [Google Scholar]
- 9.Ferron M, et al. Insulin signaling in osteoblasts integrates bone remodeling and energy metabolism. Cell. 2010;142(2):296–308. doi: 10.1016/j.cell.2010.06.003. [DOI] [PMC free article] [PubMed] [Google Scholar]
- 10.Fulzele K, et al. Insulin receptor signaling in osteoblasts regulates postnatal bone acquisition and body composition. Cell. 2010;142(2):309–319. doi: 10.1016/j.cell.2010.06.002. [DOI] [PMC free article] [PubMed] [Google Scholar]
- 11.Simonet WS, et al. Osteoprotegerin: a novel secreted protein involved in the regulation of bone density. Cell. 1997;89(2):309–319. doi: 10.1016/S0092-8674(00)80209-3. [DOI] [PubMed] [Google Scholar]
- 12.Ferron M, Hinoi E, Karsenty G, Ducy P. Osteocalcin differentially regulates beta cell and adipocyte gene expression and affects the development of metabolic diseases in wild-type mice. Proc Natl Acad Sci U S A. 2008;105(13):5266–5270. doi: 10.1073/pnas.0711119105. [DOI] [PMC free article] [PubMed] [Google Scholar]
- 13.Lee NK, et al. Endocrine regulation of energy metabolism by the skeleton. Cell. 2007;130(3):456–469. doi: 10.1016/j.cell.2007.05.047. [DOI] [PMC free article] [PubMed] [Google Scholar]
- 14.Dacquin R, Starbuck M, Schinke T, Karsenty G. Mouse α1(I)-collagen promoter is the best known promoter to drive efficient Cre recombinase expression in osteoblast. Dev Dyn. 2002;224(2):245–251. doi: 10.1002/dvdy.10100. [DOI] [PubMed] [Google Scholar]
- 15.Winzell MS, Ahren B. The high-fat diet-fed mouse: a model for studying mechanisms and treatment of impaired glucose tolerance and type 2 diabetes. Diabetes. 2004;53(suppl 3):S215–S219. doi: 10.2337/diabetes.53.suppl_3.S215. [DOI] [PubMed] [Google Scholar]
- 16.Frederich RC, Hamann A, Anderson S, Lollmann B, Lowell BB, Flier JS. Leptin levels reflect body lipid content in mice: evidence for diet-induced resistance to leptin action. Nat Med. 1995;1(12):1311–1314. doi: 10.1038/nm1295-1311. [DOI] [PubMed] [Google Scholar]
- 17.Van Heek M, et al. Diet-induced obese mice develop peripheral, but not central, resistance to leptin. J Clin Invest. 1997;99(3):385–390. doi: 10.1172/JCI119171. [DOI] [PMC free article] [PubMed] [Google Scholar]
- 18.Garnero P. Biomarkers for osteoporosis management: utility in diagnosis, fracture risk prediction and therapy monitoring. Mol Diagn Ther. 2008;12(3):157–170. doi: 10.1007/BF03256280. [DOI] [PubMed] [Google Scholar]
- 19.Eyre DR, Dickson IR, Van Ness K. Collagen cross-linking in human bone and articular cartilage. Age-related changes in the content of mature hydroxypyridinium residues. Biochem J. 1988;252(2):495–500. doi: 10.1042/bj2520495. [DOI] [PMC free article] [PubMed] [Google Scholar]
- 20.DeFronzo RA. Insulin resistance, lipotoxicity, type 2 diabetes and atherosclerosis: the missing links. The Claude Bernard Lecture 2009. Diabetologia. 2010;53(7):1270–1287. doi: 10.1007/s00125-010-1684-1. [DOI] [PMC free article] [PubMed] [Google Scholar]
- 21.Samuel VT, Petersen KF, Shulman GI. Lipid-induced insulin resistance: unravelling the mechanism. Lancet. 2010;375(9733):2267–2277. doi: 10.1016/S0140-6736(10)60408-4. [DOI] [PMC free article] [PubMed] [Google Scholar]
- 22.Erion DM, Shulman GI. Diacylglycerol-mediated insulin resistance. Nat Med. 2010;16(4):400–402. doi: 10.1038/nm0410-400. [DOI] [PMC free article] [PubMed] [Google Scholar]
- 23.Elefteriou F, et al. ATF4 mediation of NF1 functions in osteoblast reveals a nutritional basis for congenital skeletal dysplasiae. Cell Metab. 2006;4(6):441–451. doi: 10.1016/j.cmet.2006.10.010. [DOI] [PMC free article] [PubMed] [Google Scholar]
- 24.Song R, et al. Central role of E3 ubiquitin ligase MG53 in insulin resistance and metabolic disorders. Nature. 2013;494(7437):375–379. doi: 10.1038/nature11834. [DOI] [PubMed] [Google Scholar]
- 25.Ferron M, McKee MD, Levine RL, Ducy P, Karsenty G. Intermittent injections of osteocalcin improve glucose metabolism and prevent type 2 diabetes in mice. Bone. 2012;50(2):568–575. doi: 10.1016/j.bone.2011.04.017. [DOI] [PMC free article] [PubMed] [Google Scholar]
- 26.Oury F, et al. Osteocalcin regulates murine and human fertility through a pancreas-bone-testis axis. J Clin Invest. 2013;123(6):2421–2433. doi: 10.1172/JCI65952. [DOI] [PMC free article] [PubMed] [Google Scholar]
- 27.Green A, Olefsky JM. Evidence for insulin-induced internalization and degradation of insulin receptors in rat adipocytes. Proc Natl Acad Sci U S A. 1982;79(2):427–431. doi: 10.1073/pnas.79.2.427. [DOI] [PMC free article] [PubMed] [Google Scholar]
- 28.McElduff A, Hedo JA, Taylor SI, Roth J, Gorden P. Insulin receptor degradation is accelerated in cultured lymphocytes from patients with genetic syndromes of extreme insulin resistance. J Clin Invest. 1984;74(4):1366–1374. doi: 10.1172/JCI111547. [DOI] [PMC free article] [PubMed] [Google Scholar]
- 29.Freychet P, et al. Impairment of insulin binding to the fat cell plasma membrane in the obese hyperglycemic mouse. FEBS Lett. 1972;25(2):339–342. doi: 10.1016/0014-5793(72)80519-2. [DOI] [PubMed] [Google Scholar]
- 30.Kahn CR, Neville DM, Neville DM, Jr, Roth J. Insulin-receptor interaction in the obese-hyperglycemic mouse. A model of insulin resistance. J Biol Chem. 1973;248(1):244–250. [PubMed] [Google Scholar]
- 31.Archer JA, Gorden P, Roth J. Defect in insulin binding to receptors in obese man. Amelioration with calorie restriction. J Clin Invest. 1975;55(1):166–174. doi: 10.1172/JCI107907. [DOI] [PMC free article] [PubMed] [Google Scholar]
- 32.Olefsky JM. Decreased insulin binding to adipocytes and circulating monocytes from obese subjects. J Clin Invest. 1976;57(5):1165–1172. doi: 10.1172/JCI108384. [DOI] [PMC free article] [PubMed] [Google Scholar]
- 33.Bertacca A, et al. High insulin levels impair intracellular receptor trafficking in human cultured myoblasts. Diabetes Res Clin Pract. 2007;78(3):316–323. doi: 10.1016/j.diabres.2007.06.001. [DOI] [PubMed] [Google Scholar]
- 34.Hirosumi J, et al. A central role for JNK in obesity and insulin resistance. Nature. 2002;420(6913):333–336. doi: 10.1038/nature01137. [DOI] [PubMed] [Google Scholar]
- 35.Turban S, Hajduch E. Protein kinase C isoforms: mediators of reactive lipid metabolites in the development of insulin resistance. FEBS Lett. 2011;585(2):269–274. doi: 10.1016/j.febslet.2010.12.022. [DOI] [PubMed] [Google Scholar]
- 36.Kim JK, et al. PKC-theta knockout mice are protected from fat-induced insulin resistance. J Clin Invest. 2004;114(6):823–827. doi: 10.1172/JCI22230. [DOI] [PMC free article] [PubMed] [Google Scholar]
- 37.Arkan MC, et al. IKK-β links inflammation to obesity-induced insulin resistance. Nat Med. 2005;11(2):191–198. doi: 10.1038/nm1185. [DOI] [PubMed] [Google Scholar]
- 38.Itani SI, Ruderman NB, Schmieder F, Boden G. Lipid-induced insulin resistance in human muscle is associated with changes in diacylglycerol, protein kinase C, and IκB-α. Diabetes. 2002;51(7):2005–2011. doi: 10.2337/diabetes.51.7.2005. [DOI] [PubMed] [Google Scholar]
- 39.Yu C, et al. Mechanism by which fatty acids inhibit insulin activation of insulin receptor substrate-1 (IRS-1)-associated phosphatidylinositol 3-kinase activity in muscle. J Biol Chem. 2002;277(52):50230–50236. doi: 10.1074/jbc.M200958200. [DOI] [PubMed] [Google Scholar]
- 40.Li Y, et al. Protein kinase C Theta inhibits insulin signaling by phosphorylating IRS1 at Ser(1101). J Biol Chem. 2004;279(44):45304–45307. doi: 10.1074/jbc.C400186200. [DOI] [PubMed] [Google Scholar]
- 41.Werner ED, Lee J, Hansen L, Yuan M, Shoelson SE. Insulin resistance due to phosphorylation of insulin receptor substrate-1 at serine 302. J Biol Chem. 2004;279(34):35298–35305. doi: 10.1074/jbc.M405203200. [DOI] [PubMed] [Google Scholar]
- 42.Samuel VT, et al. Mechanism of hepatic insulin resistance in non-alcoholic fatty liver disease. J Biol Chem. 2004;279(31):32345–32353. doi: 10.1074/jbc.M313478200. [DOI] [PubMed] [Google Scholar]
- 43.Ducy P, et al. Increased bone formation in osteocalcin-deficient mice. Nature. 1996;382(6590):448–452. doi: 10.1038/382448a0. [DOI] [PubMed] [Google Scholar]
- 44.Narimatsu M, et al. Regulation of planar cell polarity by Smurf ubiquitin ligases. Cell. 2009;137(2):295–307. doi: 10.1016/j.cell.2009.02.025. [DOI] [PubMed] [Google Scholar]
- 45.Ferron M, Wei J, Yoshizawa T, Ducy P, Karsenty G. An ELISA-based method to quantify osteocalcin carboxylation in mice. Biochem Biophys Res Commun. 2010;397(4):691–696. doi: 10.1016/j.bbrc.2010.06.008. [DOI] [PMC free article] [PubMed] [Google Scholar]
- 46.Ducy P, Karsenty G. Two distinct osteoblast-specific cis-acting elements control expression of a mouse osteocalcin gene. Mol Cell Biol. 1995;15(4):1858–1869. doi: 10.1128/mcb.15.4.1858. [DOI] [PMC free article] [PubMed] [Google Scholar]
- 47.Zhu H, Kavsak P, Abdollah S, Wrana JL, Thomsen GH. A SMAD ubiquitin ligase targets the BMP pathway and affects embryonic pattern formation. Nature. 1999;400(6745):687–693. doi: 10.1038/23293. [DOI] [PubMed] [Google Scholar]
- 48.Yamashita M, et al. Ubiquitin ligase Smurf1 controls osteoblast activity and bone homeostasis by targeting MEKK2 for degradation. Cell. 2005;121(1):101–113. doi: 10.1016/j.cell.2005.01.035. [DOI] [PMC free article] [PubMed] [Google Scholar]
- 49.Ohta T, Xiong Y. Phosphorylation- and Skp1-independent in vitro ubiquitination of E2F1 by multiple ROC-cullin ligases. Cancer Res. 2001;61(4):1347–1353. [PubMed] [Google Scholar]
- 50.Chappard D, Palle S, Alexandre C, Vico L, Riffat G. Bone embedding in pure methyl methacrylate at low temperature preserves enzyme activities. Acta Histochem. 1987;81(2):183–190. doi: 10.1016/S0065-1281(87)80012-0. [DOI] [PubMed] [Google Scholar]
- 51.Parfitt AM, et al. Bone histomorphometry: standardization of nomenclature, symbols, and units. Report of the ASBMR Histomorphometry Nomenclature Committee. J Bone Miner Res. 1987;2(6):595–610. doi: 10.1002/jbmr.5650020617. [DOI] [PubMed] [Google Scholar]
- 52.Clugston RD, et al. Altered hepatic lipid metabolism in C57BL/6 mice fed alcohol: a targeted lipidomic and gene expression study. J Lipid Res. 2011;52(11):2021–2031. doi: 10.1194/jlr.M017368. [DOI] [PMC free article] [PubMed] [Google Scholar]
- 53.Bielawski J, Pierce JS, Snider J, Rembiesa B, Szulc ZM, Bielawska A. Sphingolipid analysis by high performance liquid chromatography-tandem mass spectrometry (HPLC-MS/MS). Adv Exp Med Biol. 2010;688:46–59. doi: 10.1007/978-1-4419-6741-1_3. [DOI] [PubMed] [Google Scholar]
Associated Data
This section collects any data citations, data availability statements, or supplementary materials included in this article.