

Abstract
Protein temporal dynamics play a critical role in time-dimensional pathophysiological processes, including the gradual cardiac remodeling that occurs in early-stage heart failure. Methods for quantitative assessments of protein kinetics are lacking, and despite knowledge gained from single-protein studies, integrative views of the coordinated behavior of multiple proteins in cardiac remodeling are scarce. Here, we developed a workflow that integrates deuterium oxide (2H2O) labeling, high-resolution mass spectrometry (MS), and custom computational methods to systematically interrogate in vivo protein turnover. Using this workflow, we characterized the in vivo turnover kinetics of 2,964 proteins in a mouse model of β-adrenergic–induced cardiac remodeling. The data provided a quantitative and longitudinal view of cardiac remodeling at the molecular level, revealing widespread kinetic regulations in calcium signaling, metabolism, proteostasis, and mitochondrial dynamics. We translated the workflow to human studies, creating a reference dataset of 496 plasma protein turnover rates from 4 healthy adults. The approach is applicable to short, minimal label enrichment and can be performed on as little as a single biopsy, thereby overcoming critical obstacles to clinical investigations. The protein turnover quantitation experiments and computational workflow described here should be widely applicable to large-scale biomolecular investigations of human disease mechanisms with a temporal perspective.
Introduction
Proteins are not static entities, but rather exist in a dynamic equilibrium of degradation and renewal. Malfunctions of protein turnover are increasingly recognized in numerous human disorders, including cystic fibrosis, neurodegenerative diseases, and heart diseases (1, 2). In the normal heart, protein turnover helps maintain the protein pool in homeostasis through continual synthesis and degradation (2, 3). The turnover cycle becomes perturbed during cardiac injury and heart failure by factors including hypertrophic signaling (4), calcium regulation (5), and proteolytic stress (6, 7), whereas increased oxidative stress compounds the reduced protein degradation capacity of the failing heart (8). Altogether, these perturbations of protein degradation and synthesis instigate a remodeling of the cardiac proteome that is believed to parallel, at the molecular level, the progressive deterioration of cardiac structure and functions (4, 8–11). Hence, identifying how pathological proteome remodeling gradually manifests over time is critical to advancing our knowledge of heart diseases.
Because the rate of either protein synthesis or degradation (i.e., protein turnover) must deviate from normal values in order for the protein pool size to adjust to a new level, any permutation of proteomic states leaves behind a kinetic signature in the form of a fraction of the newly synthesized proteins in the protein pool (3, 12). This kinetic signature can be measured through the incorporation of isotopes into proteins over time and may be exploited to identify unexpected disease proteins and their pathological implications independently of abundance measurements. For instance, the increased abundance of a protein may originate from elevated protein synthesis or decreased proteolysis, two scenarios that can be distinguished by the replacement kinetics of the protein pool (3), i.e., the protein half-life. Alternatively, cellular signaling may accelerate synthesis and degradation to shorten the protein half-life without altering its abundance and has been hypothesized to facilitate the generation of spatial gradients (13). Since abundance measurements per se conflate disparate kinetic scenarios, investigations restricted to steady-state measurements have limited power to discern certain time-dimensional features of disease progression. This limitation has perhaps hindered the identification of causal events during hypertrophic responses, because potential drug target proteins for which abundance is not the correlating parameter in their disease association may be obscured. Assessing global protein turnover kinetics in the remodeling heart therefore provides new opportunities to understand cardiac remodeling and identify molecular changes that presage functional debilitations.
In this study, we sought to elucidate the changes in protein kinetics during adverse cardiac remodeling. Although disrupted protein homeostasis is a hallmark of the remodeling heart, the technologies to quantify its effects on protein turnover have been lacking until very recently. Quantitative evaluations of protein synthesis and degradation have been well demonstrated in cultured cells using techniques such as stable isotope–labeled amino acid (SILAC) or fluorescence timers (14, 15), but the proteome dynamics of freely dividing cells in vitro does not necessarily recapitulate the physical constraints and physiological regulations that occur in animals in vivo (3, 16). Measuring protein turnover in vivo entails additional technical challenges including label delivery and tolerance, determination of precursor enrichment, and data interpretation (3, 12, 16). Stable isotope labeling using deuterium oxide (2H2O) tracers has shown great potential for tracing protein turnover in mammals (17–21). However, widespread applications for studying diseases have been hindered by the lack of a necessary computational workflow for large dataset analysis and translatable methods for human clinical studies. To address this shortcoming, we developed a sensitive method that combines 2H2O labeling, high-resolution mass spectrometry (MS), and bioinformatics tools to interrogate large-scale temporal dynamics in a mouse β-adrenergic stimulation model of cardiac remodeling. We subsequently translated this method to demonstrate the quantitative assessment of proteome turnover in humans, including the analysis of protein kinetics from a single time point.
Results
In vivo protein turnover kinetics measurements in mice.
We first sought to quantify the in vivo turnover rates of proteins in the mouse heart (Figure 1A). Labeling was initiated on 9- to 12-week-old male Hsd:ICR mice using 8% (v/v) 2H2O for 14 days, a duration adjudged to capture the turnover of most cardiac proteins (16). At ten separate time points, we harvested mouse heart and blood from three mice each, separated the cardiac proteins into cytosolic and mitochondrial fractions, and analyzed the heart and blood protein samples with liquid chromatography (LC) and high-resolution Orbitrap MS. Labeling resulted in steady 2H2O enrichment of ≈4.4% of total body water in the mice. The incorporation of 2H2O labels into newly synthesized proteins increased the proportion of proteins with heavier isotopic compositions (isotopomers) (Figure 1A, step 3). We could then use MS to distinguish the gradual shifts in peptide isotopomer patterns, and the rate of shift could be modeled to deduce the turnover rates of the protein pool given the appropriate analytical software (Figure 1A, step 4).
Figure 1. 2H2O-labeling strategy to quantify protein turnover in normal and isoproterenol-stimulated mice.

(A) 2H2O-labeling scheme for the mouse experiments. Step 1: Mice were labeled to ≈4.4% body water 2H2O enrichment. Step 2: Normal, remodeling, and reverse-remodeling mice were euthanized at eight separate time points to harvest heart and plasma protein samples. Step 3: Newly made proteins containing 2H2O labels had a higher average mass and shifted the isotope distribution of peptides in the mass spectrum. Step 4: With the incorporation of heavier isotopes after 2H2O labeling, the gradual decrease in the proportion of unlabeled isotopomers (m0/mi) could be modeled to deduce the turnover rate. Step 5: Protein kinetics in normal mice and disease models were compared. (B and C) Isoproterenol-induced cardiac remodeling, as measured by heart weight/body weight ratio (HW/BW), ejection fraction (EF), and mitochondrial function. Solid lines denote local regression, dashed lines denote 95% confidence intervals. (D) Histograms of protein turnover rates in normal mouse heart cytosol and mitochondria. On average, cytosolic proteins turned over twice as fast as mitochondrial proteins. (E) Distributions of individual protein turnover rates in normal, remodeling, and reverse-remodeling hearts. Box: interquartile; whiskers: 1.5× interquartile; violin: data density. (F) Turnover rates of proteins belonging to ten selected complexes in normal (gray), remodeling (red), and reverse-remodeling (blue) mouse hearts. Associated proteins shared similar turnover rates, e.g., ATP synthase: 0.026 (0.017–0.037) d–1; 20S proteasome: 0.106 (0.088–0.140) d–1. Cardiac remodeling and reverse remodeling exert different effects on each complex. Analyzed protein count is given in parentheses. Box: interquartile; whiskers: 1.5× interquartile.
To quantify protein kinetics changes in isoproterenol-stimulated hearts, we performed 2H2O labeling on 24 additional mice that were simultaneously administered isoproterenol to induce pathological hypertrophy and remodeling (10, 22). Furthermore, a third group of mice was given 15 mg/kg/d isoproterenol for 14 days, then labeled with 2H2O afterward to measure protein kinetics during the reverse remodeling process following isoproterenol withdrawal. In these groups of mice, β-adrenergic stimulation induced increased heart weight and ejection fraction within 24 hours, which persisted throughout the duration of the isoproterenol treatment, then gradually abated (Figure 1B). Remodeling at the molecular level was also evident from the lowered respiratory complex I catalytic rate following isoproterenol treatment (Figure 1C).
To extract protein turnover rates from these experiments, we developed a computational workflow, ProTurn, for the analysis of 2H2O-labeled protein MS data on a large scale. ProTurn integrates the identified peptide peaks in the MS experiments, extracts isotope abundances to determine protein expression level and label incorporation, and performs multivariate optimization on data time series to compute turnover kinetics. The ProTurn workflow is scalable from single-protein investigations to the accrual of multiple large dataset experiments and allows proteome-wide kinetics libraries to be created. Details on the methodology are described in Supplemental Methods (supplemental material available online with this article; doi: 10.1172/JCI73787DS1).
In total, the 2H2O-labeling MS experiments discovered the turnover rates of 2,964 nonredundant proteins in the mouse heart and blood that passed quality control (Supplemental Figure 1). The measured protein turnover rates were highly diverse and spanned more than 100-fold, with half-lives ranging from less than 1 day to greater than 3 weeks. In the normal heart, the average cytosolic protein species turned over ≈10% per day (turnover rate, k = 0.107 [0.028–0.553] d–1 [median and 5th–95th percentile]), and the average mitochondrial protein turned over approximately 5% per day (k = 0.045 [0.021–0.23] d–1) (Figure 1, D and E), translating into half-lives of approximately 6.5 and 15 days, respectively. These quantitation data were consistent with previous observations (refs. 16, 23, 24, and Supplemental Figure 1, F–H), and provided much-expanded coverage of major protein pathways in the cardiac cytosol and the mitochondria. For instance, we discovered the turnover rate of 80 of 95 respiratory chain subunits, 63 of 79 eukaryotic ribosome subunits, and all core 20S proteasome subunits in at least one experimental condition (Figure 1F and Supplemental Excel file 1). We observed heterogeneous temporal kinetics across molecular weight, isoelectric points, and other biophysical parameters, consistent with previous results (16). Turnover rates clustered with protein localizations and complex associations (Figure 1F), highlighting protein half-life as a regulated cellular parameter. Altogether, these results greatly expand the existing catalog of in vivo protein kinetics information.
Global changes in protein turnover following isoproterenol treatment.
Among the 2,034 protein pairs we compared between normal and remodeling hearts, the turnover rates during remodeling were on average 1.23-fold greater than that in the normal heart (5th–95th percentile: –1.5-fold to 2.9-fold), reflecting increased synthesis and replacement of protein pools during remodeling. Isoproterenol led to increased turnover of 972 proteins (greater than 1.25-fold), as compared with the decreased turnover of only 216 proteins. Thus, isoproterenol treatment largely led to widespread acceleration of protein turnover in the heart. This is in contrast to protein kinetics in response to isoproterenol withdrawal, in which turnover rates decreased approximately 20% more slowly than normal (Figure 1E). Despite the fact that the cardiac proteome does not remain constant during remodeling, the nonlinear kinetic model we used to calculate turnover rates precisely represented the majority of protein turnover behavior (Supplemental Figure 1), suggesting that the changes in protein pools occurred gradually and were amenable to longitudinal modeling. The global increases in turnover were specific and could not be explained by sample bias, because global plasma protein turnover from the same animals did not rise after adrenergic stimulation, and there were also proteins that exhibited retarded turnover in the remodeling heart (less than –1.25-fold).
Proteome kinetics signatures of cardiac remodeling.
Some proteins displayed more elevated kinetics than the population average and turned over up to three times faster than in the normal heart, whereas other proteins were 50% slower (Table 1). The proteins that showed exceptional kinetic responses may be inferred to be associated with disease progression, because their behaviors were specifically modified after isoproterenol, in the same manner that targets are deduced from differentially expressed proteins or transcripts. For example, the kinetic changes were notably pronounced in the calcium-dependent membrane-binding proteins in the annexin family. Among the eight annexins quantified, all but two displayed significantly accelerated replacement in the protein pool. ANXA2/3/4/5 changed most prominently in the remodeling heart (1.7- to 3.0-fold, 86th–98th percentile rank) (Figure 2A), translating, for example, into a decrease in the ANXA2 half-life from 16.7 to 5.5 days, whereas ANXA6 and ANXA7 were also significantly elevated (1.4-fold). ANXA2 and ANXA5 are widely known to have elevated transcript and protein levels in heart failure patients (25, 26), but consensus is lacking on the other isoforms. The broadly increased kinetics among six isoforms provides new evidence that annexins may be generally associated with cardiac remodeling and hypertrophy.
Table 1.
Example proteins with highly elevated turnover kinetics in cardiac remodeling
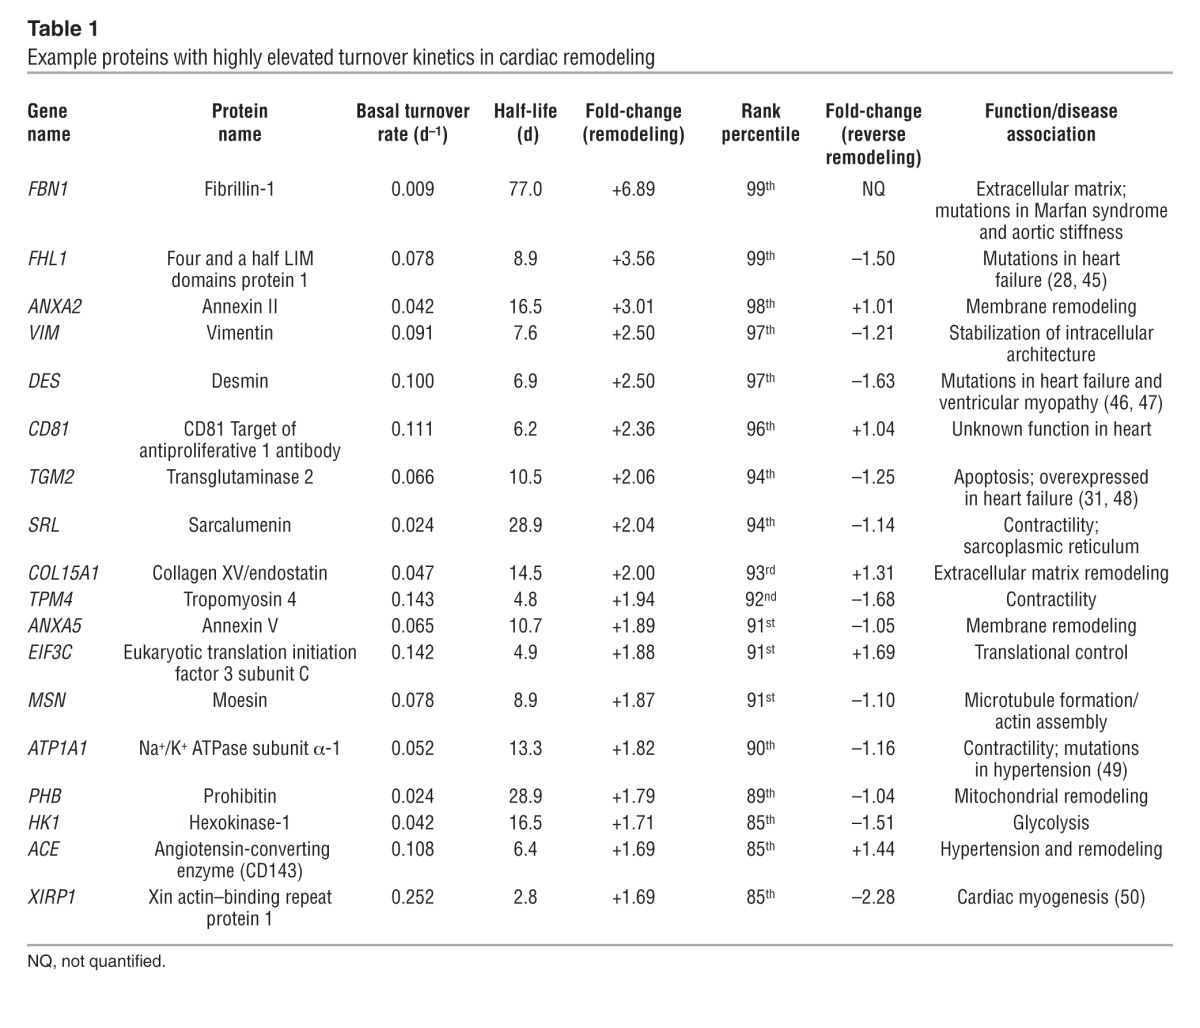
Figure 2. Protein kinetics in the remodeling heart.

(A) Isoproterenol increases the turnover rates of multiple annexins (left). The fraction of turned over ANXA2 over time was much higher in remodeling (red) versus normal (black) hearts (right). Lines represent the best-fitted curve from a single peptide. (B) Ratios of turnover rates of the glycolytic proteins in remodeling (R) and reverse-remodeling (RR) hearts, normalized to normal (Nor) hearts. Each data series represents the behavior of a single glycolytic enzyme. (C) Heatmap of turnover rate ratios of the glycolytic proteins in remodeling hearts versus normal hearts (left) and the fraction of turned over proteins in selected enzymes (right) over time in normal (black) and remodeling (red) hearts. (D–G) Isoproterenol regulated protein categories differentially, e.g., fatty acid oxidation, branched-chain amino acid (AA) metabolism, 20S proteasomal proteins, and 60S ribosomal proteins. (H) The β and F0 subcomplexes in respiratory complexes I and V had particularly elevated turnover in remodeling. Subcomplexes are heatmapped where possible; white represents no quantified ratios. (I) Scatter plot comparing the turnover rates of mitochondria-targeted proteins when measured in extracted mitochondrial samples versus when measured in a cytosolic sample in normal (left), remodeling (middle), and reverse-remodeling (right) mouse hearts. Only proteins that were quantified with high confidence were included (2+ fitted peptides, median absolute distribution <25%). We observed no systematic bias in the turnover rate of each cellular fraction, suggesting that protein import into the mitochondria is not a significant factor for turnover measurements.
Importantly, the data also revealed proteins with significantly (P < 0.05) elevated turnover that were not previously associated with cardiac remodeling (Table 1 and Supplemental Excel file 1). These putative remodeling proteins belonged to diverse functional classes, including extracellular matrix remodeling (e.g., VIM1, COL15A1), excitation-contraction coupling (e.g., TNNC1, ATP1A1, and RYR2), and mitochondrial dynamics (PHB). Several proteins (e.g., FHL1 and XIRP1) are known to be mutated in cardiomyopathies and are thus notable candidate hypertrophy drivers (27, 28). On the whole, proteins with significant changes after isoproterenol treatment belong to at least 35 biological processes that present promising targets for further studies (Supplemental Excel file 1). The highly dynamic kinetics profiles we observed indicate that the diseased heart is associated with broad protein remodeling involving the majority of the cardiac proteome.
Further salient footprints of remodeling were evident at the pathway level, in particular among metabolic and proteostatic proteins. It has long been known that glycolysis is accelerated in cardiac remodeling, as the heart shifts its fuel consumption from primarily fatty acids to primarily carbohydrates. However, a large number of studies have failed to convincingly show increased protein abundance of glycolytic enzymes in the remodeling heart (29–32), hinting that parameters other than expression level may be responsible for the increased glycolysis. Remarkably, we observed highly and significantly (P < 0.05) accelerated turnover in glycolytic enzymes in our disease model (Figure 2B). The observed kinetic changes were not confined to a few rate-limiting enzymes, but were virtually ubiquitous along the glycolytic pathway (Figure 2C), e.g., the half-life of hexokinase 1 (HK1) decreased from 16.7 to 9.8 days in the remodeling heart, that of GAPDH decreased from 10.8 to 6.7 days, and that of phosphoglycerate mutase 1 (PGAM1) decreased from 12.2 to 6.9 days. As expected, MS quantitation and immunoblotting data suggested that the abundance of these proteins was relatively unchanged (see below). Assuming increased turnover but unchanged abundance, it could be deduced that proteome remodeling increased both the synthesis and degradation of glycolytic enzymes, replacing the protein pools at a higher rate. In contrast to glycolytic enzymes, fatty acid oxidation proteins had much more subdued changes following isoproterenol treatment (Figure 2D). In conjunction with the commonly observed decrease in their abundance in the remodeling heart, the kinetics data support a scenario in which decreased synthesis of the fatty acid enzyme drove the decrease in fatty acid oxidation capacity. An exception is the fatty acid importer CD36, in which increased turnover (1.5-fold) instead suggests that it may be regulated primarily by proteolysis. Branched-chain amino acid metabolism proteins exhibited lower turnover relative to that of the the proteome (Figure 2E). Thus, isoproterenol stimulus exerts differential kinetic regulation on multiple metabolic pathways.
Differential regulation of turnover is also observed in the imbalance between protein synthesis and degradation machineries. Consistent with the gain in net proteins during hypertrophy, the turnover rates of 40S and 60S ribosomes were conspicuously higher in the remodeling heart, as compared with the more subtle changes in proteasome subunits (Figure 2, F and G). Notably, particular components of the ubiquitin-proteasome system showed repressed turnover (CUL5, RNF7, RNF123, UBE2O), whereas that of some translation initiation factors (EIF3C/E, EIF4A1/B, EIF5/6) but not others (EIF3F/H) was accelerated (Supplemental Excel file 1). These individual changes suggest specific arms of proteostasis that may be further explored to determine the molecular details of proteome remodeling.
Implications for mitochondrial dynamics.
Mitochondrial dynamics, in particular biogenesis, fusion-fission, and autophagy, play critical roles in cardiac functions (33–35). Our previous observations of diverse and asynchronous mitochondrial protein turnover in the normal mouse heart led us to conclude that the turnover of individual proteins can influence the homeostasis and dynamics of mitochondria (16, 36). Consistent with this notion, we found complex and bidirectional kinetic responses among individual mitochondrial proteins in the remodeling heart. Whereas some proteins related to mitochondrial dynamics exhibited accelerated turnover (MIRO1/2, LONP, and PHB), others remained unchanged (MFN1/2 and FIS1) (Supplemental Excel file 1). Likewise, although most respiratory chain components exhibited modestly elevated turnover, we observed heterogeneous responses among individual complexes (Figure 1F) and individual complex subunits (Figure 2H). In complex I, the membrane-embedded β subcomplex was influenced by remodeling independently of the rest of the subcomplexes, whereas the F0 subunits of complex V were similarly enriched for elevated turnover. Together, these results demonstrate that mitochondrial proteins are under independent control of different regulatory elements during proteome remodeling, highlighting the added insights into organelle dynamics derived from the analysis of protein kinetics at the individual protein resolution level.
To understand whether protein import rates preclude accurate measurements of protein replacement inside the mitochondria, we compared the turnover rates of mitochondria-targeted proteins measured in the mitochondria with turnover rates in their cytosolic milieu. In most cases, the proteins shared similar turnover rates when detected from either localization site. Although isoproterenol stimulus exerted differential effects on the turnover rates of a small number of proteins in the cytosol versus in the mitochondria (Kolmogorov-Smirnov P ≤ 7.3 × 10⁻⁴), as a whole, there is limited evidence to suggest a disequilibrium between the intra- and extramitochondrial populations or that lapses in import would constrain mitochondrial protein pool replacement within the measured time period (Figure 2I).
Protein kinetics in reverse remodeling.
Following the withdrawal of isoproterenol stimulus, mouse hearts underwent reverse remodeling accompanied by reversed changes in cardiac function (Figure 1B). Based on the direction of kinetics changes following chronic β-adrenergic stimulation and its subsequent withdrawal, we could further categorize the kinetic behavior of proteins into four quadrants (Figure 3A). In the first group, reverse cardiac remodeling largely overturned the elevated kinetics of proteins we observed during remodeling, in synchrony with the increase and subsequent decrease in heart weight. This group encompassed most proteins including the glycolytic enzymes, but was most prominently enriched for ribosomal subunits (Fisher’s exact test, P ≤ 8.6 × 10⁻⁷; Benjamini-Hochberg procedure, P ≤ 6.9 × 10⁻⁴) (Figure 3B). We found that the second group of proteins displayed elevated kinetics in β-adrenergic stimulation that was sustained in reverse remodeling. This group could be functionally distinguished from the first by its significant enrichment of MAPK signaling proteins (Fisher’s exact test, P ≤ 6.3 × 10⁻⁵, Benjamini-Hochberg procedure, P ≤ 0.039) (Figure 3C), including RAC1, MAPK1, MAP2K2, MAP2K3, and STAT1. In contrast, relatively few proteins showed decreased turnover throughout remodeling and reverse remodeling, a group suggestively enriched for proteolytic pathway proteins (Fisher’s exact test, P ≤ 9.2 × 10⁻⁴) (Figure 3D). Other proteins in this category include the nicotinamide nucleotide metabolism enzymes NNT and NAMPT. Only nine proteins had decreased turnover with isoproterenol treatment, but increased turnover in reverse remodeling, including some likely plasma contaminants; these also included TXNIP (remodeling: –3.03-fold, reverse remodeling: 2.08-fold), a protein involved in regulating glucose metabolism and not quantified in the plasma sample. The statistical enrichments underline that an imbalance between protein synthesis and degradation is a prominent feature of cardiac remodeling, and recovery may involve the sustained elevation of particular branches of MAPK signaling. Altogether, the results in remodeling and reverse-remodeling hearts demonstrate that profound molecular insights can be acquired from turnover studies to support new hypotheses and investigations.
Figure 3. Protein kinetics in reverse remodeling.

(A) Scatter plots of protein turnover rate ratios in remodeling and reverse-remodeling hearts over normal hearts. Each data point represents a protein species. (B) Proteins in quadrant 1 have elevated turnover rates in remodeling hearts (greater than 1.25-fold versus normal), but depressed turnover (less than –1.25-fold versus normal) in reverse-remodeling hearts compared with normal hearts and are significantly enriched for ribosomal proteins, suggesting that ribosomal proteins have higher turnover during remodeling, but slower turnover in reverse remodeling. (C) Proteins in quadrant 2 (greater than 1.25-fold in remodeling/normal and reverse-remodeling/normal) and (D) quadrant 3 (less than –1.25-fold in remodeling/normal and reverse-remodeling/normal) are enriched for MAPK signaling and proteasomes, respectively.
Measurements of in vivo protein turnover kinetics in humans.
We next translated the method to study protein kinetics in healthy human subjects. Among the advantages of 2H2O labeling are its bulk availability, low cost, established safety, and ease of delivery without dietary modifications (16, 17). Although these attributes make 2H2O a uniquely suitable isotope protein label for clinical applications, systematic measurements of proteome dynamics in humans remain hindered by several technical challenges. Because human subjects take in 2H2O through small boluses, label enrichment in body water rises gradually before reaching the target level. A protein molecule that is synthesized shortly after labeling begins, therefore, would contain fewer isotope labels than one synthesized later, which complicates the ascertainment of the fraction of newly synthesized proteins from the MS data (Figure 4A). Under this gradual enrichment scheme, label incorporation into proteins deviates from the first-order exponential decay function. To correct for the variable label enrichment, we further derived a nonlinear mathematical function that incorporates the rate constant of 2H2O enrichment (kp) and the rate constant of protein turnover (k) (Figure 4D). In a human labeling experiment, this sigmoidal function resolves isotopomer shifts by accounting for both the initial lag of available isotopes and the rise-to-plateau kinetics of protein turnover (Supplemental Methods and Supplemental Data 2). Under fast enrichment, such as in mice (kp >> k), the function approximates a first-order exponential decay function. Thus, the nonlinear model could handle a wide range of labeling scenarios in mice and humans.
Figure 4. Temporal dynamics of the human plasma proteome.

(A) Gradual labeling in human clinical studies complicates 2H2O-labeling data analysis and curve fitting. (B) Labeling and data analysis schemes for the four healthy human subjects. Step 1: The subjects were labeled for 14 days. Step 2: Three milliliters of blood was collected at 10 to 15 time points. Step 3: Plasma proteins were analyzed by MS. Step 4: The changing isotopomer patterns were modeled with a nonlinear function to deduce protein turnover rates. (C) The gradual enrichment of 2H2O in the body water of the subjects was modeled by a first-order exponential decay function to deduce the enrichment rate (kp) and level (pss) that are used in turn to model the turnover kinetics of peptide isotopomers. (D) Experimental data and kinetic curve fitting of a human plasma peptide (EQLGEFYEALDCLCIPR3+). The fractional abundance of the unlabeled isotopomer (m0/mi) decreased in a sigmoidal curve that reflects the two rate constants of 2H2O ramping (kp) and protein turnover (k). Dashed lines indicate the upper and lower limits of fitting. (E) The turnover rates of 182 plasma proteins that were quantified as in D in three or more subjects. Selected proteins are marked. The full dataset is provided in Supplemental Excel file 1.
We designed a labeling procedure and enrolled four healthy volunteers in a longitudinal study. The procedure consisted of administration of regular boluses of 70% 2H2O for 14 days and procurement of 3 ml of peripheral blood at 10 to 15 time points to extract plasma and erythrocyte proteins for analysis (Figure 4B). Upon labeling, the body water 2H2O level of the subjects followed first-order kinetics as expected, gradually approaching ≈1.6%–2.2% at the enrichment rates of 0.15 to 0.25 d–1 (Figure 4C and Table 2). After termination of labeling, the enrichment level of body 2H2O gradually subsided in the subjects at a rate of ≈0.1 d–1. The volunteers were further monitored for up to 6 months after labeling and reported no adverse effects.
Table 2.
2H2O enrichment rate and plasma turnover rates of 4 human subjects
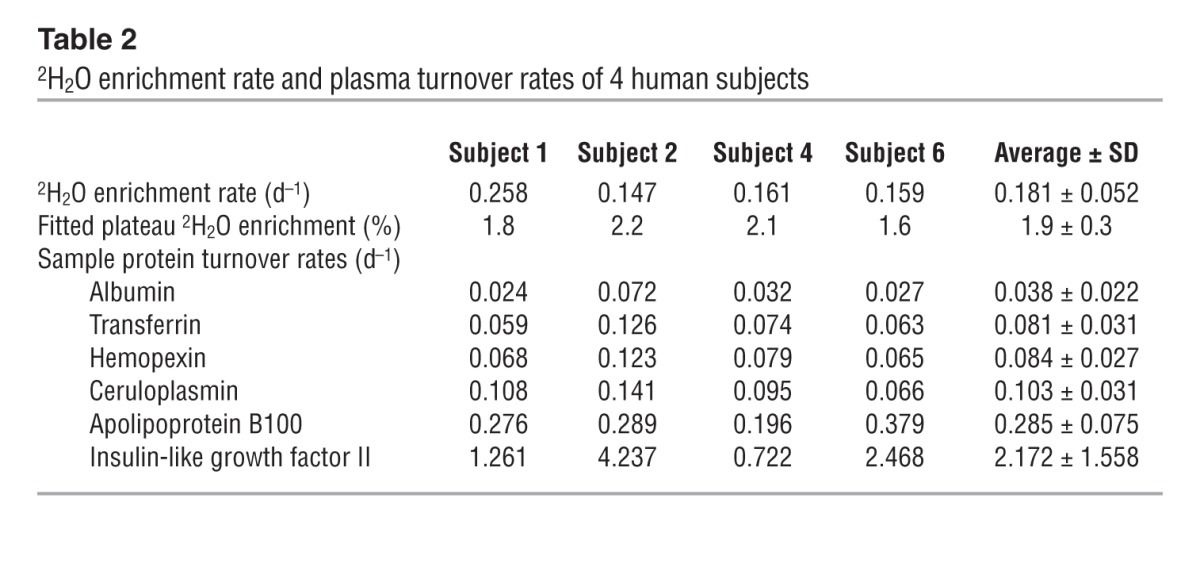
After MS analysis and kinetic curve fitting, we obtained the total turnover rates of 496 plasma proteins from the human samples. The turnover kinetics of the detected plasma proteins was diverse and spanned a more than 50-fold range in turnover rates from albumin (ALB) (average half-life: 18.3 days) to IGF2 (average half-life: 8 hours) (Figure 4E). In contrast, the 59 proteins we also quantified from transcriptionally quiescent erythrocytes had negligible turnover, with half-lives of greater than or equal to 50 days. The results confirm that the designed labeling procedure, featuring a very low level of enrichment (≤2%), was safe and sufficient to monitor large-scale protein turnover in humans.
To explore the reproducibility of human labeling, we repeated the labeling on one of the subjects (subject 1) in a second independent experiment 6 months after the first experiment. Despite the different 2H2O enrichment levels (1.8% versus 1.4%) and rates in the replicate experiments, we were able to acquire reproducibly quantified kinetics information with relatively small amounts of variation (Supplemental Figure 2). The kinetics data showed excellent correlation among all subjects (Spearman’s correlation coefficient, P = 0.82–0.93) and were consistent with previous single-protein studies. The nonlinear function closely modeled 32%–47% of consistently observed peptides in each plasma sample (Supplemental Figure 2), whereas more than 50% of consistently identified proteins yielded turnover rates, indicating that our approach does not negatively impact the scope and coverage of proteomics inquiries. Altogether, these data demonstrate the robustness of large-scale protein kinetics quantitation in humans and, to the best of our knowledge, constitute the largest human protein kinetics dataset to date. Future studies are required that will better define the possible sources of variability in human protein turnover, e.g., the impact of age and gender, and that will determine whether low isotope enrichments contribute disproportionately to the standard errors of half-lives of slow-turnover proteins. The human study presented here serves to validate our approach and software. The dataset will benefit future investigations by providing a critical reference for experimental designs and power analysis for sample-size determination.
Although we examined the kinetics of human blood proteins because of their immediate translational potential as diagnostic indicators, the method is applicable to all human tissues. Proteome kinetics studies in human tissues other than blood may be additionally hindered by limited clinical accessibility of protein samples. The extant 2H2O labeling methods would invariably require repeated sample biopsies (16–18, 20), which presents unnecessary distress and is impractical in many clinical settings. In the present nonlinear-fitting model, the initial and final isotopomer abundances of a peptide in the MS (i.e., the unlabeled and fully turned over protein, respectively) can be precisely defined by the peptide sequence and 2H2O enrichment in the body water. A single data point acquired in between could therefore effectively demarcate the trajectory of the kinetic curve (Figure 5, A and B). To demonstrate the feasibility of deducing protein kinetics from a single, non–time-course measurement, we performed triplicate MS experiments on human plasma samples from two subjects at each of three individual time points (days 4, 8, and 12). We found that although the day-4 samples presented more variations — possibly due to limited label incorporation — both the day-8 and day-12 single-point measurements were highly consistent with the 15-point time-course data (Figure 5C). Because cardiac proteins have limited surgical accessibility and are typically only available during cardiac transplantation or ventricular assist device implantation, the described method opens opportunities for kinetics investigations in the human heart, among other invasive tissue samples.
Figure 5. Measurement of protein turnover from a single biopsy.

(A) Simulation of the mass isotopomer abundance curves of the same peptide sequence as shown in Figure 4D, but with different hypothetical turnover rates (k), according to the nonlinear model. Puncta denote the corresponding mass isotopomer abundance (m0/mi) that would be measured from a single time-point experiment on day 8 of labeling. A single (m0/mi) value is therefore sufficient to deduce k. (B) Experimental data and fitting of the same peptide sequence as shown in Figure 4D, but from our single-point experiment on the day 8 plasma sample from subject 1. Triplicate data points acquired from the single sample define the kinetic curve to the same effect as the multiple data points from different time points as in Figure 4D, demonstrating the feasibility of acquiring protein kinetics information without a time-course experiment. (C) Correlations in turnover rates between peptides commonly analyzed from single-point sampling and 15-point time-course experiments from subjects 1 (top) and 2 (bottom). The average peptide relative standard error was ≈20% compared with the time-course experiment.
Discussion
By combining 2H2O labeling, high-resolution MS, and rigorous computational analysis, we obtained a comprehensive view of protein kinetics in a disease model at the individual protein resolution level. The data indicate diverse and prominent changes in the protein kinetics landscape of β-adrenergic–stimulated cardiac remodeling. The protein turnover changes both recapitulated known phenotypes and inferred new putative perturbations, illustrating the potential of the workflow to discover new disease targets and insights. We show that increased glycolysis in the failing heart is associated with higher turnover of glycolytic enzymes. Since certain glycolytic enzymes including triosephosphate isomerase (TPI) are known to be irreversibly damaged during catalysis (37), a possible explanation for the higher turnover is that faster protein pool replacement is necessary to remove damaged proteins and maintain enzyme pool efficiency. Thus, turnover rates could place an indirect limit on fuel consumption in the diseased heart by regulating the proportion of functional glycolytic enzymes in the protein pool. This hypothesis should be testable by examining in vitro enzyme function and modifications.
Recently, Stanley and colleagues (19) also used 2H2O labeling to compare the in vivo turnover rates of 28 proteins between interfibrillar and subsarcolemmal mitochondria in the rat heart. The study observed higher protein turnover rates in the subsarcolemmal population, suggesting that these rates might be measured to distinguish similar cellular components. Together with the data presented here, the turnover measurements by Stanley and colleagues demonstrate a clear potential of protein kinetics measurements as a tool to characterize multiple aspects of cardiac physiology. The approach presented in our study further extends the scope of 2H2O-labeling experiments by providing a flexible nonlinear model and computational software. These advances enabled us to quantify protein turnover with higher coverage than previously described and to study global protein dynamics in a disease model.
Other recent investigations involving noncardiac tissues are also beginning to show the burgeoning translational potential of 2H2O labeling in the study of human diseases. In a pioneering study, Emson et al. (18) administered psoriasis patients with 2H2O and collected skin samples with tape. The authors found 2H2O label appearance on keratin samples from psoriasis-affected skin to be markedly quicker than in healthy skin, suggesting that increased keratin synthesis is a quantitative biomarker of psoriasis that may be useful as a noninvasive clinical indicator of treatment response. Since the study analyzed total label incorporation from the acid hydrolysate of isolated proteins, the weighted average of all protein turnover rates was measured. As our approach allows the turnover rate of individual protein species in humans to be quantified separately, we anticipate that it can avail similar translational strategies and greatly expand the scope of investigations.
A measurable change in turnover rate can indicate a number of possible pathophysiological scenarios. Most straightforwardly, the particular protein may be expected to have changed in abundance correspondingly, such that the increase in isotope incorporation reflects the outcome of increased protein expression and synthesis. However, ample scenarios also exist in which the turnover cycle permutes without conspicuous net differences in protein abundance, such as when increased degradation counterpoises increased synthesis, as is likely for a number of glycolytic enzymes in this study. Since the MS dataset contained information on both protein quantity and turnover, this allowed us to further explore the relations between protein kinetics and protein abundance changes in the disease model. We measured protein abundance ratios between normal and remodeling hearts using two common quantitative MS methods: spectral counts (38, 39) using ProLuCID and intensity-based absolute quantification (iBAQ) (14, 40) implemented in ProTurn. We found that higher turnover coincided with congruent abundance increases in some proteins (e.g., ANXA5 and FHL1) but not in others (e.g., DES and HK1) (Supplemental Excel file 1). Overall, we found only modest correlations between kinetics changes and abundance changes (Figure 6A) (correlation coefficient, P < 0.2), indicating that a large number of proteins with increased turnover did not in fact increase in steady-state abundance, and vice versa. Similar results were observed when we compared the data with the cardiac transcript profile from the Gene Expression Omnibus database (GEO GSE48670) following isoproterenol stimulation in mice. We further performed immunoblotting experiments on some proteins of interest as an orthogonal technique to validate the abundance measurements. ANXA2 and ANXA5 proteins both increased in abundance in the failing heart (Figure 6B), consistent with previous reports (25, 26). Also expectedly, immunoblots failed to detect evidence for increased expression of the tested glycolytic proteins. Taken together, these data suggest that changes in protein turnover and protein abundance in a system are largely independent parameters, an observation that is consistent with a recent study in 2H2O and SILAC doubly labeled mice (41).
Figure 6. Comparison of protein turnover and expression changes.

(A) Scatter plot of individual protein turnover ratios versus abundance ratios in remodeling versus normal hearts, as measured by either spectral count (top) or iBAQ (bottom). Right panels: Analysis performed only on proteins with significant changes in turnover in the remodeling hearts showed a similar lack of correlation. The lack of correlation between protein turnover and abundance changes is consistent with previous observations in the literature (41) and further corroborate the effective independence of the two measurable parameters. (B) Immunoblots (IB) against annexin II (ANXA2), annexin V (ANXA5), and lactate dehydrogenase (LDHA/C) show that for these proteins, increased turnover is associated with increased abundance after 7 or 14 days of isoproterenol (Iso). On the other hand, other tested proteins including the glycolytic enzymes aldolase A (ALDOA), GAPDH, hexokinase 1 (HK1), hexokinase 2 (HK2), pyruvate dehydrogenase (PDH), phosphoglycerate mutase 1 (PGAM1), and pyruvate kinase (PKM1/2) did not show increased abundance, suggesting that their accelerated turnover is independent of upregulated expression. kIso/k, fold-change of turnover rates in remodeling versus normal hearts. (C) The independence between changes in protein turnover and abundance is consistent with the notion that both synthesis and degradation contribute to the overall protein pool size.
Although cardiac hypertrophy is associated with a general increase in protein synthesis and abundance, individual protein pools may expand or shrink to different degrees. Because both protein synthesis and protein degradation contribute to the protein pool size, a protein pool may expand either through increased synthesis or decreased degradation (Figure 6C). The former would result in a higher increase in turnover than the latter. Therefore, a particular cardiac protein may show a prominent 5-fold increase in abundance but only a modest 20% increase in turnover, whereas another protein may have a 5-fold increase in both abundance and turnover, in addition to other scenarios that contribute to the overall hypertrophic response. Therefore, a poor overall correlation between abundance and turnover changes would result when all protein species are considered, as we have observed in the data. Furthermore, a protein may also show increased turnover without an apparent abundance change if the elevation of abundance was transient and the protein level had already returned to normal at the time point at which it was measured. In contrast, even transient increases in synthesis during labeling will permanently increase the proportion of labeled versus unlabeled proteins. The resulting isotope pattern is a signature of protein turnover that remains imprinted in a mixed protein pool, even if some of the proteins later become exported or aggregated. Taken together, the poor correlation between turnover and abundance suggests that protein turnover measurements can be leveraged to study the plasticity of the pathological proteome in parallel with commonly pursued protein expression profiling. This is also illustrated by the poor overlap between the list of kinetically regulated proteins discovered here and the differentially expressed proteins from large-scale protein abundance profiles of the failing heart in the literature (31, 42).
In summary, this study presents a sensitive and versatile workflow for the characterization of protein turnover kinetics at the individual protein resolution level in mice and humans. This method is compatible with large-scale inquiries and allows turnover rates to be extracted from a single time point, thus greatly extending the scale and clinical applicability of protein turnover studies. Data from a mouse isoproterenol model of cardiac remodeling illustrate that turnover kinetics can be harnessed to discriminate protein association with heart disease development. Although future experiments are needed to fully integrate all relevant protein properties, these endeavors will be facilitated by the technique and quantitative kinetics data first reported here. We suggest that comparison of in vivo turnover rates may provide investigators with a powerful new tool to uncover unexpected molecular mechanisms of human diseases.
Methods
Detailed descriptions of all experimental methods and the computational workflow of ProTurn are provided in Supplemental Methods (ProTurn is available at http://www.heartproteome.org/proturn/index.html).
Reagents.
2H2O (70% and 99.9% molar ratio) was purchased from Cambridge Isotope Laboratories and filtered through 0.1-μm polyethersulfone membranes (VWR International). Other chemical reagents were from Sigma-Aldrich unless otherwise specified. Milli-Q (Millipore) filtered water (18.2 MΩ) was used.
Animal models and 2H2O labeling.
Male Hsd:ICR (CD-1) mice (Harlan Laboratories) 9–12 weeks of age were housed in a 12-hour light/12-hour dark cycle with controlled temperature, humidity, and free access to standard chow and water. Labeling was initiated by two intraperitoneal injections of 500 μl 99.9% (molar ratio) 2H2O-saline 4 hours apart. Mice were then given free access to 8% (v/v; 7.25% molar ratio) 2H2O in the drinking water supply. Groups of 3 mice each were euthanized at 0, 1, 2, 3, 5, 7, 10, and 14 days following the first 2H2O injection at 12:00 noon for sample collection. Remodeling and reverse-remodeling mice were surgically subcutaneously implanted with a micro-osmotic pump (ALZET) delivering 15 mg/kg/d isoproterenol over 14 days following established protocols (10). 2H2O labeling was initiated as above, either immediately or 14 days after pump implantation. Cardiac function was monitored by transthoracic echocardiography.
Human subjects.
Four healthy participants (subjects 1, 2, 4, and 6) were enrolled in the study and provided written informed consent. To label body water with 2H2O, the participants were instructed to take in 4 boluses of 0.51 ml/kg (body mass) sterile 70% molar ratio 2H2O daily at 11:00 am, 2:00 pm, 6:00 pm, and 9:00 pm for the first 7 days, and 2 boluses of 0.56 ml/kg sterile 70% molar ratio 2H2O daily at 11:00 am and 9:00 pm for the following 7 days, with the exception of subject 1, whose first- and second-week boluses were 0.66 and 0.74 ml/kg, respectively. During labeling, the participants were given daily general physical examinations and were questioned about their adherence to the labeling regimen by the clinical coordinator (D.A. Liem). Vital signs were monitored by measuring blood pressure, heart rate, and temperature on a daily basis. From days 0 to 14, whole-blood samples (3 ml) were collected in the clinical laboratory of the UCLA Ronald Reagan Medical Center at 12:00 noon at the 10 to 15 time points. The participants were monitored for 14 days to 6 months after administration and indicated no discomfort or side effects throughout the labeling and monitoring periods.
Computational workflow for protein kinetics analysis.
Proteins were identified from the acquired mass spectra using ProLuCID (38). Protein functional information and gene ontology (GO) entries were queried through NCBI DAVID (43) and COPaKB (44). Protein turnover kinetics was quantified with ProTurn. For each identified peptide, all isotopomer areas under the curve over a 60-ppm window were integrated from the raw mass spectra. False-positive identifications were further controlled by the requirement of a peptide to be explicitly identified in at least 4 time points before it was considered for kinetics calculation. Turnover rates were extracted by multivariate optimization to a nonlinear function.
Statistics.
Nonparametric Mann-Whitney-Wilcoxon statistics were calculated in R to estimate the significance of difference in turnover rates (see Supplemental Methods). The Fisher’s exact test with the Benjamini-Hochberg procedure were performed through NCBI DAVID bioinformatics (43) to estimate the significance of enrichment of functional categories. Results with a P value of less than 0.05 after multiple testing correction were considered significant.
Study approval.
Mouse experiments were performed in accordance with the National Research Council’s guidelines for the care and use of laboratory animals and were approved by the IACUC of UCLA. Human procedures were performed according to protocols approved by the IRB of UCLA (12-000899). All participants provided written informed consent.
Supplementary Material
Acknowledgments
This work was supported by NIH awards HL-R37-63901 and HHSN268201000035C; the T.C. Laubisch endowment at UCLA (to P. Ping); and by American Heart Association fellowships 13POST14700031 (to Maggie P.Y. Lam) and 12PRE11610024 (to Edward Lau).
Footnotes
Conflict of interest: The authors have declared that no conflict of interest exists.
Citation for this article:J Clin Invest. 2014;124(4):1734–1744. doi:10.1172/JCI73787.
References
- 1.Balch WE, Morimoto RI, Dillin A, Kelly JW. Adapting proteostasis for disease intervention. Science. 2008;319(5865):916–919. doi: 10.1126/science.1141448. [DOI] [PubMed] [Google Scholar]
- 2.Hinkson IV, Elias JE. The dynamic state of protein turnover: It’s about time. Trends Cell Biol. 2011;21(5):293–303. doi: 10.1016/j.tcb.2011.02.002. [DOI] [PubMed] [Google Scholar]
- 3.Claydon AJ, Beynon R. Proteome dynamics: revisiting turnover with a global perspective. Mol Cell Proteomics. 2012;11(12):1551–1565. doi: 10.1074/mcp.O112.022186. [DOI] [PMC free article] [PubMed] [Google Scholar]
- 4.Katz AM. Physiology of the Heart. 5th ed. Philadelphia, Pennsylvania, USA: Lippincott Williams & Wilkins; 2010. [Google Scholar]
- 5.Goonasekera SA, et al. Decreased cardiac L-type Ca(2)(+) channel activity induces hypertrophy and heart failure in mice. J Clin Invest. 2012;122(1):280–290. doi: 10.1172/JCI58227. [DOI] [PMC free article] [PubMed] [Google Scholar]
- 6.Tsutsui H, Kinugawa S, Matsushima S. Mitochondrial oxidative stress and dysfunction in myocardial remodelling. Cardiovasc Res. 2009;81(3):449–456. doi: 10.1093/cvr/cvn280. [DOI] [PubMed] [Google Scholar]
- 7.Giordano FJ. Oxygen, oxidative stress, hypoxia, and heart failure. J Clin Invest. 2005;115(3):500–508. doi: 10.1172/JCI200524408. [DOI] [PMC free article] [PubMed] [Google Scholar]
- 8.Wang X, Li J, Zheng H, Su H, Powell SR. Proteasome functional insufficiency in cardiac pathogenesis. Am J Physiol Heart Circ Physiol. 2011;301(6):H2207–H2219. doi: 10.1152/ajpheart.00714.2011. [DOI] [PMC free article] [PubMed] [Google Scholar]
- 9.Abel ED, Doenst T. Mitochondrial adaptations to physiological vs. pathological cardiac hypertrophy. Cardiovasc Res. 2011;90(2):234–242. doi: 10.1093/cvr/cvr015. [DOI] [PMC free article] [PubMed] [Google Scholar]
- 10.Drews O, Tsukamoto O, Liem D, Streicher J, Wang Y, Ping P. Differential regulation of proteasome function in isoproterenol-induced cardiac hypertrophy. Circ Res. 2010;107(9):1094–1101. doi: 10.1161/CIRCRESAHA.110.222364. [DOI] [PMC free article] [PubMed] [Google Scholar]
- 11.Dai DF, et al. Mitochondrial proteome remodelling in pressure overload-induced heart failure: the role of mitochondrial oxidative stress. Cardiovasc Res. 2012;93(1):79–88. doi: 10.1093/cvr/cvr274. [DOI] [PMC free article] [PubMed] [Google Scholar]
- 12.Doherty MK, Beynon RJ. Protein turnover on the scale of the proteome. Expert Rev Proteomics. 2006;3(1):97–110. doi: 10.1586/14789450.3.1.97. [DOI] [PubMed] [Google Scholar]
- 13.Varshavsky A. Protein Sci. The N-end rule pathway and regulation by proteolysis [published online ahead of print June 1, 2011]. doi: 10.1002/pro.666 . [DOI] [PMC free article] [PubMed] [Google Scholar]
- 14.Schwanhausser B, et al. Global quantification of mammalian gene expression control. Nature. 2011;473(7347):337–342. doi: 10.1038/nature10098. [DOI] [PubMed] [Google Scholar]
- 15.Khmelinskii A, et al. Tandem fluorescent protein timers for in vivo analysis of protein dynamics. Nat Biotechnol. 2012;30(7):708–714. doi: 10.1038/nbt.2281. [DOI] [PubMed] [Google Scholar]
- 16.Kim TY, et al. Metabolic labeling reveals proteome dynamics of mouse mitochondria. Mol Cell Proteomics. 2012;11(12):1586–1594. doi: 10.1074/mcp.M112.021162. [DOI] [PMC free article] [PubMed] [Google Scholar]
- 17.Rachdaoui N, et al. Measuring proteome dynamics in vivo: as easy as adding water? Mol Cell Proteomics. 2009;8(12):2653–2663. doi: 10.1074/mcp.M900026-MCP200. [DOI] [PMC free article] [PubMed] [Google Scholar]
- 18.Emson CL, et al. A pilot study demonstrating a non-invasive method for the measurement of protein turnover in skin disorders: application to psoriasis. Clin Transl Med. 2013;2(1):12. doi: 10.1186/2001-1326-2-12. [DOI] [PMC free article] [PubMed] [Google Scholar]
- 19.Kasumov T, et al. Assessment of cardiac proteome dynamics with heavy water: slower protein synthesis rates in interfibrillar than subsarcolemmal mitochondria. Am J Physiol Heart Circ Physiol. 2013;304(9):H1201–H1214. doi: 10.1152/ajpheart.00933.2012. [DOI] [PMC free article] [PubMed] [Google Scholar]
- 20.Price JC, et al. Measurement of human plasma proteome dynamics with (2)H(2)O and liquid chromatography tandem mass spectrometry. Anal Biochem. 2012;420(1):73–83. doi: 10.1016/j.ab.2011.09.007. [DOI] [PubMed] [Google Scholar]
- 21.Fanara P, et al. Cerebrospinal fluid-based kinetic biomarkers of axonal transport in monitoring neurodegeneration. J Clin Invest. 2012;122(9):3159–3169. doi: 10.1172/JCI64575. [DOI] [PMC free article] [PubMed] [Google Scholar]
- 22.Rockman HA, et al. Expression of a beta-adrenergic receptor kinase 1 inhibitor prevents the development of myocardial failure in gene-targeted mice. Proc Natl Acad Sci U S A. 1998;95(12):7000–7005. doi: 10.1073/pnas.95.12.7000. [DOI] [PMC free article] [PubMed] [Google Scholar]
- 23.Claydon AJ, Ramm SA, Pennington A, Hurst JL, Stockley P, Beynon R. Heterogenous turnover of sperm and seminal vesicle proteins in the mouse revealed by dynamic metabolic labeling. Mol Cell Proteomics. 2012;11(6):M111.014993. doi: 10.1074/mcp.M111.014993. [DOI] [PMC free article] [PubMed] [Google Scholar]
- 24.Price JC, Guan S, Burlingame A, Prusiner SB, Ghaemmaghami S. Analysis of proteome dynamics in the mouse brain. Proc Natl Acad Sci U S A. 2010;107(32):14508–14513. doi: 10.1073/pnas.1006551107. [DOI] [PMC free article] [PubMed] [Google Scholar]
- 25.Benevolensky D, et al. Expression and localization of the annexins II, V, and VI in myocardium from patients with end-stage heart failure. Lab Invest. 2000;80(2):123–133. doi: 10.1038/labinvest.3780016. [DOI] [PubMed] [Google Scholar]
- 26.Song G, Campos B, Wagoner LE, Dedman JR, Walsh RA. Altered cardiac annexin mRNA and protein levels in the left ventricle of patients with end-stage heart failure. J Mol Cell Cardiol. 1998;30(3):443–451. doi: 10.1006/jmcc.1997.0608. [DOI] [PubMed] [Google Scholar]
- 27.Gaussin V, et al. Common genomic response in different mouse models of beta-adrenergic-induced cardiomyopathy. Circulation. 2003;108(23):2926–2933. doi: 10.1161/01.CIR.0000101922.18151.7B. [DOI] [PubMed] [Google Scholar]
- 28.Sheikh F, et al. An FHL1-containing complex within the cardiomyocyte sarcomere mediates hypertrophic biomechanical stress responses in mice. J Clin Invest. 2008;118(12):3870–3880. doi: 10.1172/JCI34472. [DOI] [PMC free article] [PubMed] [Google Scholar]
- 29.van Bilsen M, Smeets PJ, Gilde AJ, van der Vusse GJ. Metabolic remodelling of the failing heart: the cardiac burn-out syndrome? Cardiovasc Res. 2004;61(2):218–226. doi: 10.1016/j.cardiores.2003.11.014. [DOI] [PubMed] [Google Scholar]
- 30.Kolwicz SC, Kolwicz SC, Jr, Tian R. Glucose metabolism and cardiac hypertrophy. Cardiovasc Res. 2011;90(2):194–201. doi: 10.1093/cvr/cvr071. [DOI] [PMC free article] [PubMed] [Google Scholar]
- 31.Petrak J, et al. Proteomic and transcriptomic analysis of heart failure due to volume overload in a rat aorto-caval fistula model provides support for new potential therapeutic targets - monoamine oxidase A and transglutaminase 2. Proteome Sci. 2011;9(1):69. doi: 10.1186/1477-5956-9-69. [DOI] [PMC free article] [PubMed] [Google Scholar]
- 32.Dai DF, et al. Global proteomics and pathway analysis of pressure-overload-induced heart failure and its attenuation by mitochondrial-targeted peptides. Circ Heart Fail. 2013;6(5):1067–1076. doi: 10.1161/CIRCHEARTFAILURE.113.000406. [DOI] [PMC free article] [PubMed] [Google Scholar]
- 33.Dorn GW. Mitochondrial dynamics in heart disease. Biochim Biophys Acta. 2013;1833(1):233–241. doi: 10.1016/j.bbamcr.2012.03.008. [DOI] [PMC free article] [PubMed] [Google Scholar]
- 34.Gottlieb RA, Gustafsson AB. Mitochondrial turnover in the heart. Biochim Biophys Acta. 2011;1813(7):1295–1301. doi: 10.1016/j.bbamcr.2010.11.017. [DOI] [PMC free article] [PubMed] [Google Scholar]
- 35.Lotz C, et al. J Proteome Res. The characterization, design, and function of the mitochondrial proteome: from organs to organisms [published online ahead of print December 12, 2013]. doi: 10.1021/pr400539j . [DOI] [PMC free article] [PubMed] [Google Scholar]
- 36.Lau E, et al. Substrate- and isoform-specific proteome stability in normal and stressed cardiac mitochondria. Circ Res. 2012;110(9):1174–1178. doi: 10.1161/CIRCRESAHA.112.268359. [DOI] [PMC free article] [PubMed] [Google Scholar]
- 37.Hipkiss AR. Energy metabolism and ageing regulation: metabolically driven deamidation of triosephosphate isomerase may contribute to proteostatic dysfunction. Ageing Res Rev. 2011;10(4):498–502. doi: 10.1016/j.arr.2011.05.003. [DOI] [PubMed] [Google Scholar]
- 38.Xu T, et al. ProLuCID, a fast and sensitive tandem mass spectra-based protein identification program. Mol Cell Proteomics. 2006;5:S174. [Google Scholar]
- 39.Huttlin EL, et al. A tissue-specific atlas of mouse protein phosphorylation and expression. Cell. 2010;143(7):1174–1189. doi: 10.1016/j.cell.2010.12.001. [DOI] [PMC free article] [PubMed] [Google Scholar]
- 40.Nagaraj N, et al. Deep proteome and transcriptome mapping of a human cancer cell line. Mol Syst Biol. 2011;7:548. doi: 10.1038/msb.2011.81. [DOI] [PMC free article] [PubMed] [Google Scholar]
- 41.Price JC, et al. The effect of long term calorie restriction on in vivo hepatic proteostatis: a novel combination of dynamic and quantitative proteomics. Mol Cell Proteomics. 2012;11(12):1801–1814. doi: 10.1074/mcp.M112.021204. [DOI] [PMC free article] [PubMed] [Google Scholar]
- 42.Lindsey ML, et al. A multidimensional proteomic approach to identify hypertrophy-associated proteins. Proteomics. 2006;6(7):2225–2235. doi: 10.1002/pmic.200500013. [DOI] [PubMed] [Google Scholar]
- 43.Huang da W, Sherman BT, Lempicki RA. Systematic and integrative analysis of large gene lists using DAVID bioinformatics resources. Nat Protoc. 2009;4(1):44–57. doi: 10.1038/nprot.2008.211. [DOI] [PubMed] [Google Scholar]
- 44.Zong N, et al. Integration of cardiac proteome biology and medicine by a specialized knowledgebase. Circ Res. 2013;113(9):1043–1053. doi: 10.1161/CIRCRESAHA.113.301151. [DOI] [PMC free article] [PubMed] [Google Scholar]
- 45.Chen D-H, et al. A novel mutation in FHL1 in a family with X-linked scapuloperoneal myopathy: phenotypic spectrum and structural study of FHL1 mutations. J Neurol Sci. 2010;296(1–2):22–29. doi: 10.1016/j.jns.2010.06.017. [DOI] [PMC free article] [PubMed] [Google Scholar]
- 46.Klauke B, et al. De novo desmin-mutation N116S is associated with arrhythmogenic right ventricular cardiomyopathy. Hum Mol Genet. 2010;19(23):4595–4607. doi: 10.1093/hmg/ddq387. [DOI] [PubMed] [Google Scholar]
- 47.Hnia K, et al. Myotubularin controls desmin intermediate filament architecture and mitochondrial dynamics in human and mouse skeletal muscle. J Clin Invest. 2011;121(1):70–85. doi: 10.1172/JCI44021. [DOI] [PMC free article] [PubMed] [Google Scholar]
- 48.Hwang KC, Gray CD, Sweet WE, Moravec CS, Im MJ. Alpha 1-adrenergic receptor coupling with Gh in the failing human heart. Circulation. 1996;94(4):718–726. doi: 10.1161/01.CIR.94.4.718. [DOI] [PubMed] [Google Scholar]
- 49.Beuschlein F, et al. Somatic mutations in ATP1A1 and ATP2B3 lead to aldosterone-producing adenomas and secondary hypertension. Nat Genet. 2013;45(4):440–444. doi: 10.1038/ng.2550. [DOI] [PubMed] [Google Scholar]
- 50.Wang DZ, et al. Requirement of a novel gene, Xin, in cardiac morphogenesis. Development. 1999;126(6):1281–1294. doi: 10.1242/dev.126.6.1281. [DOI] [PubMed] [Google Scholar]
Associated Data
This section collects any data citations, data availability statements, or supplementary materials included in this article.