

Abstract
Transcription activator-like effector nucleases (TALENs) have become a powerful tool for genome editing due to the simple code linking the amino acid sequences of their DNA-binding domains to TALEN nucleotide targets. While the initial TALEN-design guidelines are very useful, user-friendly tools defining optimal TALEN designs for robust genome editing need to be developed. Here we evaluated existing guidelines and developed new design guidelines for TALENs based on 205 TALENs tested, and established the scoring algorithm for predicting TALEN activity (SAPTA) as a new online design tool. For any input gene of interest, SAPTA gives a ranked list of potential TALEN target sites, facilitating the selection of optimal TALEN pairs based on predicted activity. SAPTA-based TALEN designs increased the average intracellular TALEN monomer activity by >3-fold, and resulted in an average endogenous gene-modification frequency of 39% for TALENs containing the repeat variable di-residue NK that favors specificity rather than activity. It is expected that SAPTA will become a useful and flexible tool for designing highly active TALENs for genome-editing applications. SAPTA can be accessed via the website at http://baolab.bme.gatech.edu/Research/BioinformaticTools/TAL_targeter.html.
INTRODUCTION
Transcription activator-like effectors (TALE) are a family of DNA-binding proteins, discovered in the plant pathogen Xanthomonas (1–4). Each DNA-binding domain of TALE contains a variable number of 33–35 amino acid repeats that specify the DNA-binding sequence primarily through their 12-th and 13-th repeat-variable di-residues (RVDs) (1). Each RVD specifies one nucleotide with minimal context dependence (2,4,5). A transcription activator-like effector nuclease (TALEN) targets a specific DNA sequence through designing a set of RVDs that are flanked by modified N- and C-termini (6,7) and linked to a FokI nuclease domain (8–10). When a pair of TALENs binds to their specific half-sites with the correct orientation and spacing to allow the nuclease domains to dimerize, the intervening sequence is cleaved. TALENs have been used to edit genomic DNA sequences in a variety of biological systems, including human cells, rats, zebrafish, nematodes and plants (5–7,11–15).
Although the codes of nucleotide recognition by RVDs have been established and five design guidelines were derived from naturally occurring TALE target sites (5), these guidelines are not sufficient to provide discrimination against suboptimal target sites. Recent evaluation of the existing design guidelines using hetero-dimeric TALEN pairs (16) revealed that the activities of the TALEN pairs varied markedly; however, no significant correlation between guideline violations and TALEN activities was found, possibly because the assessment was on TALEN pairs rather than individual TALEN monomers. Existing design tools (such as TALE-NT 2.0) intend to help users to filter gene sequences based on simple qualitative criteria; however, they often result in a large number (hundreds to thousands) of potential TALEN-target sites with activities varying over a wide range, clearly indicating the need for a new design tool that selects high-activity target sites for TALENs.
We have developed a new online design tool, scoring algorithm for predicting TALEN activity (SAPTA), to quantitatively evaluate target sites by assigning scores that reflect predicted TALEN activities, thus allowing end users to select the optimal target sites among many possible choices within a given gene segment through the use of SAPTA at http://baolab.bme.gatech.edu/Research/BioinformaticTools/TAL_targeter.html. The SAPTA prediction is based on experimentally measured activities of 130 TALEN monomers constructed with the guanine-targeting RVD NK (NK–TALENs). Although NK–TALENs generally have higher specificity compared with TALENs containing the guanine-targeting RVD NN (NN–TALENs) (6,17), their activity level is usually lower than NN–TALENs. Therefore, it is important to increase the activity level of NK–TALENs for effective gene editing.
To evaluate the performance of SAPTA, 75 additional NK–TALEN monomers were tested. We found that SAPTA-designed TALENs have significantly higher activity compared with TALENs designed following existing guidelines. Specifically, SAPTA-based TALEN designs increased the average intracellular TALEN monomer activity by >3-fold, achieved a larger percentage of highly active TALENs compared to that in previous studies (16,18,19) and resulted in an average endogenous gene-modification frequency of 39% for TALENs containing the repeat variable di-residue NK that favors specificity rather than activity. Furthermore, we show that SAPTA can also be used to design NN–TALENs that have improved activity.
MATERIALS AND METHODS
Assembly of TALENs
All TALENs were assembled using a modified two-step Golden Gate cloning method (5) to link DNA-binding repeats (plasmids kindly provided by Daniel F. Voytas, University of Minnesota) containing RVDs HD, NI, NG and NK to recognize C, A, T and G, respectively, to a wild-type FokI nuclease domain (Supplementary Sequences). Additional TALENs were assembled using the NN RVD to recognize G. The TALEN backbone vector was constructed by incorporating a Kozak sequence, a triple FLAG epitope tag and a previously described TALEN framework (6) into the pcDNA3.1(-) vector using NheI and AflII restriction sites (complete sequence in Supplementary Sequences).
After the first Golden Gate ligation step, intermediate repeat arrays (pFUS) with ≤10 repeats were fully sequenced to confirm correct assembly. In the second Golden Gate step, two or three of these repeat arrays were ligated into the TALEN backbone vector using BsmBI restriction sites to replace a lacZ gene stuffer fragment for blue/white screening. The clones were then sequenced using flanking primers to confirm the outside cloning sites and arrays, though the reads do not allow re-sequencing of the middle arrays. The final TALEN plasmids were also validated by digestion with SacII and BamHI to confirm the total size, and digestion with BspEI, which cuts only in HD repeats.
All sequencing primers are described in the Golden Gate TAL Assembly protocol available online at http://www.addgene.org. Complete sequences of all TALEN plasmids and cloning intermediates can be generated using the TAL plasmid assembly website (http://baolab.bme.gatech.edu/Research/BioinformaticTools/assembleTALSequences.html).
Assembly of single-strand annealing reporter plasmids
The single-strand annealing (SSA) reporter plasmid backbone contains an EGFP gene, interrupted after 327 bp with a stop codon, the target site for a pair of GFP-targeted ZFNs (20), an AscI and an SbfI cloning site (Supplementary Sequences). The downstream portion of the EGFP gene includes a 42-bp region repeating the sequence of the EGFP gene before the stop codon. SSA reporters were constructed using oligonucleotide pairs containing the left target site, the spacer and the right target site ligated into the vector’s AscI and SbfI sites (Supplementary Figure S1).
SSA activity assay
Human embryonic kidney 293T (HEK293T) cells (ATCC) were cultured in Dulbecco’s Modified Eagle Medium (Sigma), supplemented with 10% FBS and 2 mM L-Glutamine. Cells were seeded 80 000 per well of a 24-well plate. After 4 h, cells were transfected with 200 ng of the TALEN plasmid (or 100 ng of each TALEN for hetero-dimeric pairs) and 10 ng of the corresponding SSA reporter plasmid using calcium phosphate transfection. Three control transfections were included: (i) 200 ng of an empty TALEN backbone and 10 ng of an SSA reporter plasmid, (ii) 200 ng of an empty TALEN backbone and 10 ng of a pEGFP plasmid and (iii) 100 ng of each GFP-ZFN and 10 ng of an SSA reporter plasmid. Cells were harvested 48 h after transfection. The percentages of pEGFP-transfected samples expressing GFP were determined using an Accuri C6 flow cytometer, as an indication of transfection efficiency. Cells were lysed using QuickExtract DNA extraction solution (Epicentre) as described (21). Sample were PCR amplified for 35 cycles (95°C, 30 s; 60°C, 30 s; 72°C, 60 s) in a 50 -µl reaction that contains 2 µl of the cell lysate, 2.5 µl of each 10 µM target region amplification primer (SSA-Cell-F4, 5′-TCGTGACCACCCTGACCTACGG; SSA-Cell-R4, 5′-TGCCGTCCTCGATGTTGTGGCG), and 25 µl of GoTaq green master mix (Promega). PCR reactions were then separated on 2% agarose gels and the percentages of SSA-repaired products relative to the total PCR products were quantified using ImageJ.
Standard curve for SSA assay
To generate the standard curve, EGFP plasmid (pEGFP), with a sequence identical to the SSA-repaired target plasmid, and a target plasmid were mixed at different ratios. HEK293T cells were transfected with the mixtures and an empty TALEN backbone, the genomic DNA harvested and the SSA assay performed, as above. The results from three transfections were averaged and plotted comparing the percentage of the EGFP plasmid versus the percentage of the smaller band (345 bp). Figure 1 shows that the near-linear relationship is valid up to ∼50% of EGFP plasmid in the mixture.
Figure 1.

Modified SSA assay measuring TALEN monomer activity in HEK293T cells. (A) Schematic of the PCR-based SSA assay. Target plasmids carrying the same left (L) and right (R) TALEN-target sequence were cleaved by a TALEN co-transfected into HEK293T cells. The SSA-repaired plasmid yielded a 345-bp PCR fragment which can be separated from the ∼514-bp PCR fragment amplified from unmodified or NHEJ-repaired plasmids. The stop sign marks the stop codon; GF and FP, flanking EGFP repeat regions; Z, GFP-ZFN target site; L, left TALEN target sequence; S, spacer; R, right TALEN target sequence. (B) A standard curve validating the modified SSA assay. Error bars, s.e.m. (n = 3).
SAPTA algorithm
The SAPTA algorithm is a fitted model containing an optimized set of dummy variables and continuous variables. Dummy variables were used to describe base identities of the first five and the last five nucleotides in the monomer target sequence, whereas cubic functions were used to characterize the effect of changes in other variables, including the length of the target sequence, the overall percentages of each nucleotide in the target sequence, percentages of each nucleotide in the first five or the last five nucleotides and the maximum numbers of consecutive A’s and G’s (17,22) (Supplementary Table S1). Cubic functions were chosen because third-degree polynomials have the flexibility to approximate various curves, including linear, parabola, exponential and asymmetric concave curves.
A SAPTA score predicts the activity of a TALEN monomer. As shown in Equation (1), the SAPTA score S of each monomer target sequence is calculated as the sum of seven terms:
| (1) |
where C0 is a constant.
| (2) |
SPOS represents the effects of each nucleotide at the first five and last five positions of the target sequence (e.g. the impact of having a C as the first nucleotide in the target sequence), where
| (3) |
The dummy variable di, x in Equation (2) is either 1 (if the nucleotide at the position i is x) or 0 (otherwise). Positions are numbered starting from the first nucleotide after the 5′-T. N in Equation (2) denotes the total number of nucleotides in the sequence. For example, dN corresponds to the last nucleotide at the 3′-end of the sequence. Parameters (βi) associated with the variables (di) are optimized as described below, and can be found in Supplementary Table S1.
| (4) |
SN represents the effect of the length of target sequence (N);
| (5) |
SPER represents the effect of the overall base composition (percentages of A, C, G, T);
| (6) |
SPER,F5 represents the effect of the base composition of the first five nucleotides (%AF5, %CF5, %GF5 and %TF5);
| (7) |
SPER,L5 represents the effect of the base composition of the last five nucleotides (%AL5, %CL5, %GL5 and %TL5);
| (8) |
SCONS represents the effect of the maximum numbers of consecutive A’s (ACONS) and consecutive G’s (GCONS). In Equations (4–8), Q(x) is a cubic function defined as
where the values of a, b, c are listed in Supplementary Table S1. The constant terms d from each cubic function were combined and solved as the constant C0 in Equation (1).
In the original functions that form the SAPTA algorithm, there are a total of 55 variables and 86 parameters. Specifically, the 55 variables include 4 × 10 (type of nucleotide × number of positions) dummy variables di, x which have values of either 1 or 0, and 15 other variables (length of target, %A, %C, %G, %T, etc.) each associated with a cubic function. The 86 parameters include 40 parameters each associated with one dummy variable, three parameters for each cubic function (3 × 15 = 45), and one constant the represents all the constants in the cubic functions.
To fully establish the algorithm in SAPTA showed above, 130 NK–TALENs were individually tested for their monomer SSA activity in cultured cells. The experimental results of the Training Set were used for linear regression to determine the parameters in the SAPTA algorithm using the statistical software R. Since the number of explanatory variables is relatively large compared to the number of TALENs in the Training Set, we follow the standard statistical approach to use the step function in R to perform a model selection that eliminates non-essential variables whose parameters were set to zeros, as shown in Supplementary Table S1. The final functions in the SAPTA algorithm contain 30 variables and 43 parameters.
The fitted SAPTA functions were used to determine the overall optimal base composition shown in Table 1. Specifically, the score contribution of the overall base composition in the first 5 nucleotides was calculated using the following SAPTA function (non-essential variables were removed as described above):
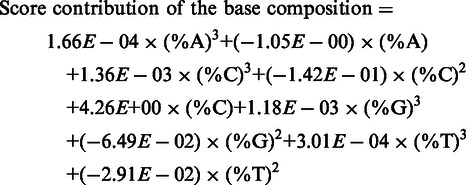 |
(9) |
Table 1.
Evaluation of existing design guidelines and development of new design guidelines
| Feature in target site | Existing guidelines | Optimal valuea from this study | Relative importanceb | Recommendation | |
|---|---|---|---|---|---|
| Comparison with previously published guidelines (5,16) | |||||
| Base identities at 5′ (position 1), second nucleotide from 5′ (position 2), and 3′-ends (5) | No T at position 1 | G at position 1 | + | Some specific nucleotides at these positions may have minimal effect | |
| No A at position 2 | T at position 2 | ||||
| T at the 3′-end | G at 3′-end | ||||
| Overall base composition (5) | A | (31 ± 16)% | 0% | +++ | Choose target sequences with a large percentage of Cc |
| C | (37 ± 13)% | 53% | |||
| G | (9 ± 8)% | 10% | |||
| T | (22 ± 10)% | 37% | |||
| Length of target sequence (16) | 15–20 bp | 15–25 bp | + | The length of a target sequence should be 15–25 bpc | |
| Spacer length (16) | 16–19 bp | 14–19 bpd | n/a | Spacer length should be 14–19 bp | |
| New design guidelines | |||||
| Base composition of the first five nucleotides | A | ≤20% | ++ | The first 5 nt of the target sequence should contain a large %Cc | |
| C | 60–80% | ||||
| G | Not decisive | ||||
| T | Not decisive | ||||
| Base composition of the last five nucleotides | A | ≤60% | ++ | The last 5 nt of the target sequence should contain a large %Tc | |
| C | Not decisive | ||||
| G | ≤60% | ||||
| T | 80–100% | ||||
| Maximum number of consecutive A’s | ≤3 | + | Longer stretches of A’s can lower the activity | ||
| Maximum number of consecutive G’s | ≤3 | ++ | Longer stretches of G’s can lower the activity | ||
aOptimal value shows the value of a certain variable that maximizes its score contribution (defined as the sum of all contributions from the variable), with the constraint that the value of this variable should be within the range in the Training Set; brelative importance of each design feature was rated by its magnitude of contribution to the score; ctarget sequence refers to a half-site targeted by a TALEN monomer, excluding the 5′-T immediately before the 5′-end of the half-site; dacceptable values for spacer length were observed from T7E1 assays of TALEN pairs (Supplementary Figure S4).
The ranges of %A, %C, %G and %T in the Training Set are 0–56.3%, 14.3–53.3%, 0–45.0% and 4.2–55.6%, respectively. Thus the equation above was solved using these constraints to find the maximum score contribution. The optimal solutions were found as 0% A, 53% C, 10% G and 37% T.
Composite SSA activity and score
Composite SSA activity was calculated to estimate TALEN pair activity at endogenous genes. The following equation combines square roots of monomer activities measured by the SSA assay, allowing TALEN pairs with more balanced (closer) left and right TALEN activities to obtain a higher calculated composite activity.
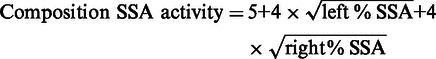 |
(10) |
The numerical factors in Equation (10) were chosen so that the composite SSA activity is ∼30 when both the left and right TALEN SSA activities are ∼10%. Similar to the composite SSA activity, the composite score of a TALEN pair is calculated with the following equation to allow pairs with more balanced left and right TALEN scores to be ranked higher, since TALEN pairs with more balanced left and right monomer activities displayed better performance in pairs (Supplementary Table S2).
| (11) |
The numerical factors in Equation (11) were chosen to be the same as those in Equation (10).
SAPTA web interface and source code
The Web interface of the SAPTA online search tool can be found at http://baolab.bme.gatech.edu/Research/BioinformaticTools/TAL_targeter.html. The SAPTA web page allows for entering gene segments and basic parameters such as search type, maximum and minimum spacer lengths and maximum and minimum TAL array lengths. The SAPTA output table contains the starting position of the left TALEN target half-sites, the left and right TALEN sequences, the sizes of the left TALEN, right TALEN and spacer and the composite score of the TALEN pair. More details on the SAPTA web interface are provided in Supplementary Figure S2 and on the website.
The source code for the online SAPTA search tool can be found at: http://baolab.bme.gatech.edu/Research/BioinformaticTools/ScoreTALEBindingSites2.js.
T7 endonuclease I mutation detection assay for measuring endogenous gene modification
The gene-modification efficiency of hetero-dimeric TALEN pairs was quantified based on the level of imperfect repair of double-stranded breaks by NHEJ. HEK293T cells were seeded 40 000 per well of a 24-well plate. After 24 h, cells were transfected with 500 ng of each nuclease plasmid and 10 ng of pEGFP plasmid using 3.4 µl FuGene HD (Promega), following manufacturer’s instructions. Cells were harvested 72 h after transfection and analyzed with an Accuri C6 flow cytometer to quantify GFP fluorescence, as a measurement of transfection efficiency. Cell pellets were then collected and genomic DNA isolated using QuickExtract DNA extraction solution (Epicentre), as described in (21). T7 endonuclease I (T7E1) assays were performed, as described previously (16) and the digestions separated on 2% agarose gels. The cleavage bands were quantified using ImageJ. The percentage of gene modification = 100 × (1 – (1 – fraction cleaved)0.5), as described in (21). Primers used for this assay are listed in Supplementary Table S3. All PCR reactions were performed using AccuPrime Taq DNA Polymerase High Fidelity (Life Technologies) following manufacturer’s instructions for 35 cycles (94°C, 30 s; 60°C, 30 s; 68°C, 60 s) in a 50 -µl reaction containing 2 µl of the cell lysate, 2.5 µl of each 10 µM target region amplification primer and 5% DMSO. The PCR reactions for the FANCE locus gave non-specific bands under standard conditions and were amplified after addition of 1 M betaine.
Single molecule real time sequencing of NHEJ-induced mutations
The same PCR products used for T7E1 assays were pooled for single molecule real time (SMRT) sequencing following the manufacturer’s instructions (Pacific Biosciences). NHEJ mutations were detected and analyzed using algorithms recently developed (E.J. Fine et al., 2013, in press) and compared to mock transfected cells.
Fisher’s exact test
Fisher’s exact test was used to determine the association of using SAPTA with achieving larger percentages of ‘highly active’ TALEN monomers/pairs. For TALEN monomers, a 10% SSA activity was used as a cut-off for high activity. Therefore, TALENs with SSA activities >10% were considered to have ‘high SSA activity’, and those with SSA activities ≤10% to have ‘low SSA activity’. A two-tailed P-value was calculated using Fisher’s exact test to compare the distribution of high and low SSA activities in the Test Set 2 and the Training Set. To evaluate the performance of TALEN pairs tested in this work, we took into account the variability of T7E1 assay in previous studies (16,18,19). In each case, we used fractions of the maximum indel percentage observed in this particular study as the cut-off values. Furthermore, to avoid arbitrarily choosing cut-off, we applied sliding cut-offs at 20%, 30%, 40%, 50%, 60%, 70% and 80% of the maximum indel percentage. TALENs with indel percentages higher than a cut-off value were considered to be ‘highly active’. Two-tailed P-values were calculated for each cut-off value.
RESULTS
Design and test of TALENs in the Training Set
To establish the correlation between TALEN activity and design variables, we first performed PCR-based, modified SSA assays to quantify the activity of individual TALEN monomers in cleaving extrachromosomal plasmids with a homo-dimeric target site and a fixed 17-bp spacer. This assay bypassed the effect of genomic context at endogenous gene targets that may obscure the correlation between TALEN activity and design variables. We quantified each TALEN monomer’s SSA activity or % SSA, defined as the percentage of SSA-repaired cleavage products in HEK293T cells co-transfected with plasmid encoding the TALEN monomer and the target plasmid (Figure 1A and Supplementary Figure S3). The validity range of this method was determined by establishing a standard curve that indicated a near-linear correlation between the percentage of mock SSA-repaired PCR products measured and the fraction of pEGFP (identical to a SSA-repaired plasmid) in the co-transfection mix up to ∼50% (Figure 1B).
We assembled and measured the SSA activities of 130 TALEN monomers targeting a variety of sequences (Supplementary Table S4). All of the 130 TALENs were constructed using RVDs NK for G, HD for C, NI for A and NG for T, and with a 5′-T preceding each TALEN target half-site. NN–TALENs generally have higher activity, but may lead to lower specificity compared with NK–TALENs (6,17). We therefore used 130 NK–TALENs as our Training Set to facilitate the design of highly active NK–TALENs. We compared the on- and off-target activities of a few sets of TALENs that differed only in the G-targeting RVDs (NN versus NK). Transfecting cells with plasmids for NN–TALENs resulted in higher off-target cleavage than corresponding NK–TALENs (E.J. Fine et al., 2013, in press).
TALENs in the Training Set were designed by considering two major groups of TALEN target sequences. One group contains TALEN target sequences that were selected from output lists for several gene segments screened by the old version of TALEN Targeter (5). The selection of these TALEN target sites was somewhat arbitrary, except that they should be located near the site of interest. The other TALENs targeted artificial sequences that we specifically varied to test the effect of certain design variables, including mutating specific nucleotides at positions near the 5′ and 3′ of the target sequence, varying the numbers of maximum consecutive A’s and G’s, and increasing the percentages of certain nucleotides in the first and last five nucleotides of the target sequence. TALENs of the second group were labeled as ‘n/a’ in the column of ‘Target gene’ in Supplementary Table S4. Together, the Training Set includes 130 TALEN monomer target sequences, 74 for targeting HBB, seven for CFTR, two for CXADR, four for ERCC5 and 43 with artificial sequences (n/a). The effects of neighboring nucleotides were not considered here since no neighboring effects have been reported in previous studies (4,5). If future studies identify any neighboring effect, additional variables (for example, product of two terms) will be introduced into the SAPTA function and the parameters re-optimize.
The Training Set also covers reasonably large ranges for each design variable we tested, including 14–30 repeat arrays, 0–56% A, 14–53% C, 0–45% G, 4–56% T; 0–80% A, C, G and T in the first five nucleotides; 0–80% A and C in the last five nucleotides, and 0–100% G and T in the last five nucleotides. Due to practical considerations, it is not possible to test all possible combinations of nucleotides throughout the DNA-binding domain of a TALEN. We chose the Training Set so that these TALENs cover a wide range of the design variables considered, with detectable and varying activities.
We tested the activities of 37 TALEN pairs from the Training Set at their endogenous gene targets using the T7 endonuclease I (T7E1) assay in HEK293T cells (Supplementary Figure S4). These 37 TALEN pairs contain all combinations of active TALEN monomers in the Training Set separated by spacers ranging from 15 to 30 bp in targeted human genes. TALEN pairs with spacers <14 bp and >19 bp showed no detectable gene-modification activity despite high SSA activities for some of the TALEN monomers. The activities of TALEN pairs with optimal spacers (defined as 14–19 bp) were compared with their ‘composite SSA activities’ which integrated left and right TALEN monomer activities (see Materials and methods section) (Figure 2). We found that TALEN pairs from the Training Set having observable gene modification activities had composite SSA activities ≥30 (Figure 2).
Figure 2.

Comparison between composite SSA activity and the endogenous gene modification rates of TALEN pairs. TALEN pairs from the training set with optimal range of spacer are ranked by their composite SSA activities (grey columns) from low to high (left to right). Endogenous gene modification rates of the corresponding TALEN pairs quantified by T7E1 assay are shown as black columns. Both SSA activity and endogenous gene-modification activity were measured in HEK293T cells. Dashed line indicates composite SSA activity of 30, which is achieved when both left and right TALEN SSA activities are ∼10%. Asterisks indicate three TALEN pairs with >30 composite SSA activities but no gene-modification activity. Error bars, s.e.m. (n = 3).
Three TALEN pairs (indicated with asterisks in Figure 2 and shown as white columns in Supplementary Figure S4D) showed no gene-modification activity, although they had >30 composite SSA activities. Sequencing results of the target sites showed no polymorphism, and the cellular expression levels of these TALENs were similar to other TALENs (with different lengths of repeat arrays) (Supplementary Figure S5), suggesting that the lack of detectable gene-modification activity was not due to target variation or low protein expression. Further investigation showed that the two ERCC5-targeting pairs, J-03/J-04 and J-09/J-10, both have high cellular activity with extrachromosomal plasmid targets. Bisulfite sequencing of this locus revealed methylated cytosines in the target sequences of these two pairs (Supplementary Figure S6), consistent with previous studies showing that methylated cytosines blocked the binding of TAL effectors (TALEs) or TALENs (19,23,24). Since no CpG site is present in the target sites of the TALEN pair S-21/S-23, undetectable gene-modification activity for this pair may be due to the long repeat array of S-21 (29 repeats). The large size of TALEN may prevent access to the target locus.
SAPTA
The SAPTA algorithm, which contains a total of 30 variables (see detailed in the Materials and methods section), was established based on the measured SSA activities of 130 NK–TALENs in the Training Set,. The SAPTA variables were chosen to evaluate the existing design guidelines (5,16) and to establish new design guidelines (Table 1 and Supplementary Table S1). Without any pre-assumption, based on the measured SSA activities of TALENs in the Training Set, the parameters in the SAPTA algorithm were solved using linear modeling in the R statistical software (version 2.15.2) (25), which gave rise to an excellent correlation with the Training Set (R2 = 0.83) (Figure 3A). Consequently, SAPTA is able to provide a numerical score that estimates TALEN activity (high scores indicate high activity).
Figure 3.

Development and evaluation of SAPTA using 205 NK–TALEN monomers. (A) Correlation between predicted SAPTA scores (y-axis) and intracellular TALEN-monomer activity (x-axis) measured by the modified SSA assay in HEK293T cells. Error bars, s.e.m. (n = 3). (B) Categorization of TALENs in the Training Set and test set using 10% SSA activity as a cut-off for high activity. TALENs with low scores (≤10) and high scores (>10) are evaluated separately. (C) The percentages of TALENs predicted by SAPTA scores being false negatives (score ≤10 but %SSA >10%) and true negatives in the low score group, and false positives (score >10 but %SSA ≤10%) and true positives in the high score group.
Using SAPTA, we evaluated the TALEN design guidelines proposed by Cermak et al.(5), Reyon et al. (16) and Streubel et al. (17), and established new design guidelines (Table 1, Supplementary Discussion, and Supplementary Figure S7). Specifically, the strong bias for C in the optimal nucleotide percentages calculated using the SAPTA agrees well with previous studies indicating that the RVD HD for C leads to high DNA-binding affinity (17,22). The optimal length of target sequences and spacer length identified using SAPTA are consistent with design guidelines proposed by Reyon et al. (16). In addition, our experimental results indicated that long stretches of A’s or G’s decrease the SSA activity, as reflected in SAPTA predictions (Supplementary Figure S7b), especially with three or more consecutive G’s. This conclusion derived by SAPTA is also consistent with the relatively low binding affinities of RVDs NI and NK that target A and G, respectively (17).
We also found that the nucleotide percentages of the first and last five nucleotides of target sequences are important: in general, high TALEN scores are achieved with a large percentage of C at the 5′-end and T at the 3′-end of the target sequence (Supplementary Figure S7C and D). This new design guideline was experimentally confirmed by specifically varying sequences at the 5′- and 3′-ends of TALENs in Test Set 1, which contains 12 TALENs (see Supplementary Table S4 for details). To minimize the change of other variables, in Test Set 1, TALENs were designed by re-arranging nucleotide positions in the original target sequences without changing the overall base compositions and lengths. When the five nucleotides at the 5′-ends were replaced by 80% C’s originally located at the 3′-ends, the overall C composition remained the same, but the SSA activities increased. When the 3′ T’s were replaced with 60% or 80% of C’s, while the overall base compositions stay unchanged, the SSA activities decreased (Supplementary Figure S8). The increase in the percentage of C’s at the 5′-end is accompanied by changes at the 3′-end due to the base swaps (Supplementary Figure S8E, top row), and both changes may cause alterations in TALEN activity. However, according to SAPTA predictions, changes at the 3′-end from 80% C to 0% or 20% C would have minimal effect on SAPTA scores (Supplementary Figure S7d). Therefore, our analysis suggests that the increase in TALEN activities is largely due to an increase in the percentage of C’s at the 5′-end.
SAPTA, a user-friendly online search tool was established to help researchers identify optimal TALEN target sites within a selected DNA sequence. The DNA sequence of interest, together with the ranges of acceptable target and spacer lengths are entered into the web interface, which then outputs a ranked list of SAPTA scores for each TALEN pair, together with the corresponding target sequences and the nucleotide preceding each target half-site (5,16). For each pair of TALENs, a single numerical value—the composite SAPTA score—is defined based on the scores of the left and right TALENs in a way that favors pairs with balanced left and right scores (see Materials and methods section and Supplementary Figure S2).
To demonstrate that the use of SAPTA improves the design of NK–TALENs, we employed SAPTA to design 63 additional NK–TALEN monomers that form Test Set 2 (see Supplementary Table S4 for details), with SAPTA scores ranging from 5.3 to 39.1 and measured their SSA activities. Specifically, the target sites for TALENs in Test Set 2 were determined by using the SAPTA online tool to search 19 gene segments with TAL arrays (DNA-binding domains) of 14–25 repeats, and spacer lengths from 14 to 19 bp. TALEN pairs with high composite scores ranked by the online tool were chosen. We mostly selected SAPTA-designed TALEN monomers with SAPTA scores >10.0, since TALENs with SSA activities >10% are likely to result in gene-modification activity (Figure 2). Based on SSA measurements, the average SSA activity of TALENs in Test Set 2 was 27.2%, compared with 8.6% in the Training Set. Furthermore, we found that 86% of NK–TALEN monomers in Test Set 2 had >10% SSA activity, compared with only 33% in the Training Set (Figure 4). The resulting P-value of 2.70 × 10⁻¹² suggests that the large frequency of highly active TALEN monomers (SSA activity >10%) is associated with the use of SAPTA.
Figure 4.

TALEN-monomer activity distribution was substantially improved in the Test Set 2 compared to the Training Set. The percentages of TALENs with SSA activity ≤10 and >10 are shown above each graph. The two-sided P-value determined by Fisher’s exact test is shown on top.
Most TALENs in the total Test Set (the combination of Test Sets 1 and 2) had SSA activities that correlated with their SAPTA scores, especially those with cleavage activities within the range of the Training Set (Figure 3A). The relatively low R2 (0.47) for the Test Set is largely due to the 12 TALENs that had SSA activities much higher than those in the Training Set (maximum 30% SSA activity), thus could not be modeled accurately by SAPTA. However, as shown in Figure 3, SAPTA predictions for TALENs in the Test Set only had 15% ‘false positive’ rate, defined as the ratio of the number of TALENs with low (≤10%) SSA activity in the high score group (score > 10), divided by the total number of high score TALENs (Figure 3B and C). Similarly, the ‘false negative’ rate is defined as the ratio of the number of TALENs with high (>10%) SSA activity in the low score group (score ≤ 10), divided by the total number of low score TALENs. The relatively high (50%) false negative rate for TALENs in the Test Set might be due to the small sample size (Figure 3B and C). However, this should not significantly affect SAPTA usage, since users typically select the highest scoring TALENs in a region for further testing, and having activities higher than predicted scores will not negatively impact effective TALEN designs.
Validation of SAPTA with NK–TALEN and NN–TALEN pairs targeting endogenous genes
To quantify the gene-modification activities of SAPTA-designed NK–TALENs, we examined 24 NK–TALEN pairs from Test Set 2 targeted to 15 human genes (see Supplementary Table S5 for details) by co-transfecting HEK293T cells with the two plasmids encoding each TALEN pair, and quantified the gene-modification rates in the intended target regions using the T7E1 assay (Supplementary Figure S9 and Supplementary Table S5). The other TALEN pairs formed by TALEN monomers in the Test Set 2 were not tested either because the corresponding target loci could not be specifically amplified due to the presence of repetitive sequences, or due to the fact that they were targeted to non-human genes. SMRT sequencing (26) showed mutation frequencies comparable to those determined by the T7E1 assay (Supplementary Figure S10).
We found that the majority of NK–TALEN pairs designed by SAPTA were highly active: the average mutation rate was 39.1%, and 71% (17/24) of TALEN pairs had mutation rates of >20% (Figure 5A and Supplementary Table S5). However, for the 21 NK–TALEN pairs formed from the Training Set (designed without SAPTA), the average mutation rate was 3.5%, and only one TALEN pair had a mutation rate of >20%. Further, we found that qualitative design guidelines proposed in two previous studies (16,17) are not sufficient in designing active NK–TALENs. As illustrated in Figure 5A and Supplementary Table S6, of the 35 NK–TALEN pairs that followed the three guidelines suggested by Reyon et al. (16) and the first two guidelines suggested by Streubel et al. (17), 21 pairs (60%) showed non-detectable cleavage activity as measured by the T7E1 assay.
Figure 5.

Activities of SAPTA-designed NK–TALEN and NN–TALEN pairs targeting endogenous genes. (A) Activity distribution of NK–TALEN pairs. The majority of NK–TALEN pairs designed by SAPTA have high activity targeting endogenous genomic loci (black columns), whereas unselected NK–TALENs built without design tools (white columns) and NK–TALENs that follow previous guidelines (16,17) (grey columns) generally have low or undetectable activities. (B) Activity distribution of NN–TALEN pairs designed by SAPTA. (C) Gene modification frequencies (% indels) of NN–TALEN pairs designed by SAPTA compared to NN–TALEN pairs from a previous study (16) targeted to the same gene regions (distances between target sites of these two groups are listed in Supplementary Table S5). The T7E1 assay was used to measure the activities of these TALEN pairs in HEK293T cells. Error bars, s.e.m. (n = 3).
Previously, five genes CDH1, HOXD13, FANCE, KIT and TGFBR2 were targeted by NN–TALENs without any success (16). The same five genes were targeted again by seven SAPTA-designed NK–TALEN pairs formed by TALENs in Test Set 2, resulted in gene modification rates of 1.6–69.2% (Supplementary Figures S9 and S11 and Table S5), further demonstrating the advantage of using SAPTA for TALEN designs.
Although SAPTA was established based on SSA measurements of NK–TALENs, we verified that it could also be used to identify target sites for highly active NN–TALENs. We designed 14 pairs of NN–TALENs using SAPTA (Supplementary Table S5), including nine NN–TALEN pairs targeted to the same DNA sequences as the corresponding NK–TALEN pairs formed from Test Set 2, and five NN–TALEN pairs targeted, respectively, to five genes AXIN2, EXT2, FANCA, FLT4 and HMGA2 (see more details below). We found that 71% (10/14) of SAPTA-designed NN–TALEN pairs had mutation rates of >20% (Figure 5B), with an average mutation rate of 35.2%, similar to the SAPTA-designed NK–TALEN pairs.
As reported previously, NN–TALEN pairs conforming to existing guidelines (16,17) targeted five genes (AXIN2, EXT2, FANCA, FLT4, HMGA2) but showed mutation rates of <10% (16). We tested these NN–TALEN pairs (ordered from Addgene) in HEK293T cells (as with other TALENs we tested), and confirmed mutation rates of <10% (Supplementary Figure S9C). Note that the EXT2-targeting TALEN pair contains a left TALEN with a negative SAPTA score, therefore is predicted to have low activity. Further, four of these TALEN pairs (AXIN2, FANCA, FLT4 and HMGA2) contained TALEN half-sites with >45% G, which is outside (higher than) the range of the G content considered in SAPTA. Specifically, for nucleotide G, the RVD NK has a low binding affinity, thus a large percentage of this RVD in a TALEN can substantially weaken the overall binding of TALEN to the DNA target (17); on the other hand, the RVD NN was shown to recognize A in addition to G (17), so >45% of the NN RVD will likely lower the specificity of the TALEN. Therefore, SAPTA does not consider target sequence with >45% G content. We re-designed NN–TALEN pairs using SAPTA to target the same five genes <50 bp away from the previous targeted sites (16), and found that SAPTA-designed NN–TALEN pairs resulted in mutation rates of 14.0–63.9%. Each pair is >7-fold more active than the corresponding NN–TALEN pair reported previously (Figure 5C and Supplementary Table S5).
There are two NK–TALEN pairs from Test Set 2 that showed high monomer SSA activities, but undetectable endogenous gene-modification rates: G-43/G-44 and G-47/G-48 (Supplementary Figure S9). Similar to the TALEN pair S-21/S-23 from the Training Set, these pairs contain large repeat arrays. The sum of the left and right repeats for each pair exceeds 45 repeats, suggesting that the large sizes of TALEN dimers may prevent access to their target loci. Possibly due to the same reason, two NN–TALEN pairs (G-89/G-90 and G-93/G-94) targeted to the same sites as G-43/G-44 and G-47/G-48, respectively, also failed to show any detectable gene-modification activity. There results suggest that caution should be taken in designing TALEN pairs containing large repeat arrays.
Evaluation of existing design guidelines
For effective TALEN designs, the existing guidelines are inadequate, since too many potential TALEN-target sites conform to the current guidelines (16,17), even within a short 100-bp gene segment. Little guidance is given to identify the optimal target site for a gene of interest, especially with NK–TALENs. Reyon et al. and others (16,18,19,27) have shown that there is a large range of activities (and some with very low or non-detectible activity) among TALENs designed using the existing guidelines, even with NN–TALENs. For example, of the 35 NK–TALEN pairs we tested that followed the guidelines proposed by Streubel et al. (17), only 14 pairs (40%) had detectable gene-modification activities (Figure 5A). These guidelines did not seem to improve NN–TALEN activity either. Among the 96 TALEN pairs targeting endogenous human genes tested by Reyon et al. (16), 86 TALEN pairs that followed the guidelines showed activity levels comparable to the 10 pairs violated the guidelines (Supplementary Figure S12). We further used SAPTA to examine the target sites of these 96 NN–TALEN pairs tested by Reyon et al. (16). Within the constraints of all variables, SAPTA identified 21 TALEN pairs with composite scores >30, which is our score threshold for active pairs. Only two of these 21 pairs have gene-modification rates <10%, indicating a false positive rate of 9.5%. Without filtering by SAPTA, 28 out of 96 (29.2%) TALEN pairs have modification rates <10%. The false positive rate of 29.2% for their original design is about three times higher compared to that using SAPTA. It should be noted that SAPTA parameters were optimized using NK–TALENs, thus the SAPTA scores may not correlate well with the activities of NN–TALENs. Nevertheless, our results suggest that SAPTA could be used to increase the chance of obtaining highly active NN–TALENs.
Frequency of highly active TALENs with and without using SAPTA
The ‘success rates’ claimed by previous studies categorized all detectable activities, whether 1% or 50% mutation rates measured by T7E1 assays, as being success (16,18,19). In contrast, SAPTA aims to increase the levels of activities, in addition to increasing the fraction of TALENs that have detectable activity. We compared the frequencies of ‘highly active’ TALEN pairs designed using SAPTA to those reported in previous studies (16,18,19). Due to possible differences in experimental conditions across various studies, we categorized ‘highly active TALENs’ by gauging TALEN activities within each study using the highest TALEN activity measured in the same study. Specifically, the ‘maximum mutation rate’ was defined as the highest mutation rate observed in each individual study. The cut-offs for ‘high activity’ were set at a range of activities depending on different maximum mutation rates, ranging from 20% to 80% of each maximum mutation rate (Figure 6). The number of highly active TALEN pairs with activities higher than each cut-off was counted. Using this sliding cut-off, we showed that frequencies of highly active TALEN pairs designed by SAPTA were at least twice the frequencies in other studies at higher cut-offs (40–80% of maximum mutation rate) (Figure 6). Therefore, SAPTA-designed TALENs showed a significant improvement in achieving high activity. Having TALEN pairs with high activity levels (for example, ∼40%) compared to those simply meet the relatively low bar of being ‘active’ would be beneficial to many applications
Figure 6.

Frequencies of highly active TALEN pairs with and without SAPTA. ‘Highly active’ is defined by a range of different cut-offs (x-axis) from >20% to >80% of the maximal TALEN-mediated mutation rates (% indels) observed in each study. Fractions of maximal % indels were used as cut-offs since the results of T7E1 assays may vary among different studies. SAPTA-designed NK–TALEN and NN–TALENs are shown comparing to TALENs from previous studies by Reyon et al. (16), Schmid-Burgk et al. (18) and Kim et al. (19). Asterisks indicate two-sided P-values associated with SAPTA-designed TALENs compared to NN–TALENs by Reyon et al. *P ≤ 0.05, **P ≤ 0.01, ***P ≤ 0.001 as determined by Fisher’s exact test.
DISCUSSION
SAPTA is the first quantitative and experimentally validated design tool for selecting TALEN-target sites with high cleavage activity. This represents a significant advance over existing TALEN-design tools that often output hundreds to thousands of unranked potential target sites (Table 2, Supplementary Discussion and Supplementary Table S7). Although the target sites selected by E–TALEN are ranked (28), the ranking is based on the guidelines by Cermak et al. (5), which were shown by Reyon et al. (16) to lack significant correlation with TALEN activity. In contrast, SAPTA has quantitatively incorporated a wide range of TALEN design guidelines (5,16,17) and provides a ranked-list of potential target sites, allowing users to design TALENs with high activity levels and the desired target sites. We demonstrated that SAPTA-designed NK–TALENs improved the average monomer SSA activity from 8.6% to 27.2%, and SAPTA-designed NK–TALEN and NN–TALEN pairs have significantly higher endogenous gene-modification rates compared to those designed without SAPTA (16,18,19) (Figure 6), with 71% of SAPTA-designed NK–TALEN or NN–TALEN pairs showing gene-modification rates of >20%. Compared with the reported activity distributions of NK–TALEN (18) and NN–TALEN (16,19) pairs studied previously, SAPTA-designed NK–TALEN and NN–TALEN pairs showed better performance, since the majority of the TALEN pairs gave high mutation rates (Figure 5A), whereas the activity distribution of previously tested NK–TALEN and NN–TALEN pairs peaks at much lower (1–20%) mutation rates (Figure 5 and Supplementary Figure S13). Our results indicate that SAPTA-designed TALEN pairs with composite scores >30 generally resulted in high endogenous gene-modification rates (Supplementary Table S5). Further, our analysis suggests that SAPTA on average identifies high-scoring target sites within the first 24 bp in a search through the coding sequences of 48 human genes (Supplementary Figure S14), thus allowing versatile gene editing using TALENs.
Table 2.
Comparison between SAPTA and other TALEN design tools
Our results suggest that the activity of TALENs depends on numerous inter-related variables, and no single variable is able to fully explain the variation in activity levels. Therefore, quantitative integration of various design criteria is likely required for successful TALEN designs. For example, the target site for TALEN S-91 contains 43% C (recognized by the strong RVD HD), but its SSA activity was only 1.7% (Supplementary Table S4). We believe that multiple design variables act synergistically to affect TALEN activity, and attempted to model these variables collectively using SAPTA.
The SAPTA algorithm was trained using cleavage activity of TALEN monomers on plasmid substrates to avoid the complications induced by genomic context and other cellular factors, and minimize the variability associated with testing TALENs in pairs. However, the nuclease-induced endogenous gene modification efficiency is determined by the intrinsic activities of TALENs and the genomic context, including epigenetic factors, competing transcription factor binding sites and secondary structures. TALENs with similar activity levels in cleaving plasmid targets may have very different levels of activity when targeting different endogenous genes, as shown in Supplementary Figure S6. Therefore, quantitative prediction of the rate of endogenous gene modification is challenging, and the SAPTA composite score for TALEN pairs calculated by combining the monomer TALEN sores is a semi-quantitative estimate of TALEN activity. However, TALENs targeting different sites within a short stretch of gene segment are likely to be influenced by similar genomic factors. Therefore, although the effect of TALENs in cleaving endogenous genes might not be accurately modeled by SAPTA due to genomic factors, SAPTA has the potential to rank different (nearby) target sites correctly and help researchers locate the optimal sites within a short gene segment.
SAPTA is based on the sum of scores corresponding to different design considerations. Therefore, it is flexible and will be able to incorporate more design variables into the function, as more information about factors affecting TALEN activity becomes available. The variables and parameters in the SAPTA algorithm can also be adaptively re-trained using new training sets of TALENs with different architectures or using alternate RVDs, such as NH. We anticipate that SAPTA will become a useful and flexible tool for designing highly active TALENs for genome-editing applications.
SUPPLEMENTARY DATA
Supplementary Data is available at NAR Online.
FUNDING
National Institutes of Health (NIH Nanomedicine Development Center Award, PN2EY018244 to G.B. and M.P.); National Science Foundation Graduate Research Fellowship (DGE-1148903 to E.J.F.). Funding for open access charge: National Institutes of Health.
Conflict of interest statement. None declared.
Supplementary Material
ACKNOWLEDGEMENTS
We thank Dr Daniel F. Voytas for providing the TALEN assembly tool kit, Dr Ayal Hendel for help with the SMRT sequencing and Dr Meghdad Rahdar for the construction of MR015 mammalian destination plasmid.
REFERENCES
- 1.Schornack S, Meyer A, Römer P, Jordan T, Lahaye T. Gene-for-gene-mediated recognition of nuclear-targeted AvrBs3-like bacterial effector proteins. J. Plant Physiol. 2006;163:256–272. doi: 10.1016/j.jplph.2005.12.001. [DOI] [PubMed] [Google Scholar]
- 2.Boch J, Scholze H, Schornack S, Landgraf A, Hahn S, Kay S, Lahaye T, Nickstadt A, Bonas U. Breaking the code of DNA binding specificity of TAL-type III effectors. Science. 2009;326:1509–1512. doi: 10.1126/science.1178811. [DOI] [PubMed] [Google Scholar]
- 3.Boch J, Bonas U. Xanthomonas AvrBs3 family-type III effectors: discovery and function. Annu. Rev. Phytopathol. 2009;48:419–436. doi: 10.1146/annurev-phyto-080508-081936. [DOI] [PubMed] [Google Scholar]
- 4.Moscou MJ, Bogdanove AJ. A simple cipher governs DNA recognition by TAL effectors. Science. 2009;326:1501. doi: 10.1126/science.1178817. [DOI] [PubMed] [Google Scholar]
- 5.Cermak T, Doyle EL, Christian M, Wang L, Zhang Y, Schmidt C, Baller JA, Somia NV, Bogdanove AJ, Voytas DF. Efficient design and assembly of custom TALEN and other TAL effector-based constructs for DNA targeting. Nucleic Acids Res. 2011;39:e82. doi: 10.1093/nar/gkr218. [DOI] [PMC free article] [PubMed] [Google Scholar]
- 6.Miller JC, Tan S, Qiao G, Barlow KA, Wang J, Xia DF, Meng X, Paschon DE, Leung E, Hinkley SJ, et al. A TALE nuclease architecture for efficient genome editing. Nat. Biotechnol. 2010;29:143–148. doi: 10.1038/nbt.1755. [DOI] [PubMed] [Google Scholar]
- 7.Wood AJ, Lo TW, Zeitler B, Pickle CS, Ralston EJ, Lee AH, Amora R, Miller JC, Leung E, Meng X, et al. Targeted genome editing across species using ZFNs and TALENs. Science. 2011;333:307. doi: 10.1126/science.1207773. [DOI] [PMC free article] [PubMed] [Google Scholar]
- 8.Christian M, Cermak T, Doyle EL, Schmidt C, Zhang F, Hummel A, Bogdanove AJ, Voytas DF. Targeting DNA double-strand breaks with TAL effector nucleases. Genetics. 2010;186:757–761. doi: 10.1534/genetics.110.120717. [DOI] [PMC free article] [PubMed] [Google Scholar]
- 9.Li T, Huang S, Jiang WZ, Wright D, Spalding MH, Weeks DP, Yang B. TAL nucleases (TALNs): hybrid proteins composed of TAL effectors and FokI DNA-cleavage domain. Nucleic Acids Res. 2010;39:359–372. doi: 10.1093/nar/gkq704. [DOI] [PMC free article] [PubMed] [Google Scholar]
- 10.Mahfouz MM, Li L, Shamimuzzaman M, Wibowo A, Fang X, Zhu JK. De novo-engineered transcription activator-like effector (TALE) hybrid nuclease with novel DNA binding specificity creates double-strand breaks. Proc. Natl Acad. Sci. USA. 2011;108:2623–2628. doi: 10.1073/pnas.1019533108. [DOI] [PMC free article] [PubMed] [Google Scholar]
- 11.Sander JD, Cade L, Khayter C, Reyon D, Peterson RT, Joung JK, Yeh JR. Targeted gene disruption in somatic zebrafish cells using engineered TALENs. Nat. Biotechnol. 2011;29:697–698. doi: 10.1038/nbt.1934. [DOI] [PMC free article] [PubMed] [Google Scholar]
- 12.Huang P, Xiao A, Zhou M, Zhu Z, Lin S, Zhang B. Heritable gene targeting in zebrafish using customized TALENs. Nat. Biotechnol. 2011;29:699–700. doi: 10.1038/nbt.1939. [DOI] [PubMed] [Google Scholar]
- 13.Tesson L, Usal C, Ménoret S, Leung E, Niles BJ, Remy S, Santiago Y, Vincent AI, Meng X, Zhang L, et al. Knockout rats generated by embryo microinjection of TALENs. Nat. Biotechnol. 2011;29:695–696. doi: 10.1038/nbt.1940. [DOI] [PubMed] [Google Scholar]
- 14.Mussolino C, Morbitzer R, Lütge F, Dannemann N, Lahaye T, Cathomen T. A novel TALE nuclease scaffold enables high genome editing activity in combination with low toxicity. Nucleic Acids Res. 2011;39:9283–9293. doi: 10.1093/nar/gkr597. [DOI] [PMC free article] [PubMed] [Google Scholar]
- 15.Hockemeyer D, Wang H, Kiani S, Lai CS, Gao Q, Cassady JP, Cost GJ, Zhang L, Santiago Y, Miller JC, et al. Genetic engineering of human pluripotent cells using TALE nucleases. Nat. Biotechnol. 2011;29:731–734. doi: 10.1038/nbt.1927. [DOI] [PMC free article] [PubMed] [Google Scholar]
- 16.Reyon D, Tsai SQ, Khayter C, Foden JA, Sander JD, Joung JK. FLASH assembly of TALENs for high-throughput genome editing. Nat. Biotechnol. 2012;30: 460–465. doi: 10.1038/nbt.2170. [DOI] [PMC free article] [PubMed] [Google Scholar]
- 17.Streubel J, Blucher C, Landgraf A, Boch J. TAL effector RVD specificities and efficiencies. Nat. Biotechnol. 2012;30:593–595. doi: 10.1038/nbt.2304. [DOI] [PubMed] [Google Scholar]
- 18.Schmid-Burgk JL, Schmidt T, Kaiser V, Höning K, Hornung V. A ligation-independent cloning technique for high-throughput assembly of transcription activator–like effector genes. Nat. Biotechnol. 2013;31:76–81. doi: 10.1038/nbt.2460. [DOI] [PMC free article] [PubMed] [Google Scholar]
- 19.Kim Y, Kweon J, Kim A, Chon JK, Yoo JY, Kim HJ, Kim S, Lee C, Jeong E, Chung E, et al. A library of TAL effector nucleases spanning the human genome. Nat. Biotechnol. 2013;31:251–258. doi: 10.1038/nbt.2517. [DOI] [PubMed] [Google Scholar]
- 20.Porteus MH. Mammalian gene targeting with designed zinc finger nucleases. Mol. Ther. J. Am. Soc. Gene Ther. 2006;13:438–446. doi: 10.1016/j.ymthe.2005.08.003. [DOI] [PubMed] [Google Scholar]
- 21.Guschin DY, Waite AJ, Katibah GE, Miller JC, Holmes MC, Rebar EJ. A rapid and general assay for monitoring endogenous gene modification. Methods Mol. Biol. 2010;649:247–256. doi: 10.1007/978-1-60761-753-2_15. [DOI] [PubMed] [Google Scholar]
- 22.Cong L, Zhou R, Kuo YC, Cunniff M, Zhang F. Comprehensive interrogation of natural TALE DNA-binding modules and transcriptional repressor domains. Nat. Commun. 2012;3:968. doi: 10.1038/ncomms1962. [DOI] [PMC free article] [PubMed] [Google Scholar]
- 23.Deng D, Yin P, Yan C, Pan X, Gong X, Qi S, Xie T, Mahfouz M, Zhu JK, Yan N, et al. Recognition of methylated DNA by TAL effectors. Cell Res. 2012;22:1502–1504. doi: 10.1038/cr.2012.127. [DOI] [PMC free article] [PubMed] [Google Scholar]
- 24.Valton J, Dupuy A, Daboussi F, Thomas S, Maréchal A, Macmaster R, Melliand K, Juillerat A, Duchateau P. Overcoming transcription activator-like effector (TALE) DNA binding domain sensitivity to cytosine methylation. J. Biol. Chem. 2012;287:38427–38432. doi: 10.1074/jbc.C112.408864. [DOI] [PMC free article] [PubMed] [Google Scholar]
- 25.R Development Core Team. Vienna, Austria: The R Foundation for Statistical Computing; 2011. R: A Language and Environment for Statistical Computing. http://www.R-project.org/ (18 December 2013, date last accessed) [Google Scholar]
- 26.Eid J, Fehr A, Gray J, Luong K, Lyle J, Otto G, Peluso P, Rank D, Baybayan P, Bettman B, et al. Real-time DNA sequencing from single polymerase molecules. Science. 2009;323:133–138. doi: 10.1126/science.1162986. [DOI] [PubMed] [Google Scholar]
- 27.Ding Q, Lee YK, Schaefer EA, Peters DT, Veres A, Kim K, Kuperwasser N, Motola DL, Meissner TB, Hendriks WT, et al. A TALEN genome-editing system for generating human stem cell-based disease models. Cell Stem Cell. 2013;12:238–251. doi: 10.1016/j.stem.2012.11.011. [DOI] [PMC free article] [PubMed] [Google Scholar]
- 28.Heigwer F, Kerr G, Walther N, Glaeser K, Pelz O, Breinig M, Boutros M. E-TALEN: a web tool to design TALENs for genome engineering. Nucleic Acids Res. 2013;41:e190. doi: 10.1093/nar/gkt789. [DOI] [PMC free article] [PubMed] [Google Scholar]
- 29.Doyle EL, Booher NJ, Standage DS, Voytas DF, Brendel VP, Vandyk JK, Bogdanove AJ. TAL Effector-Nucleotide Targeter (TALE-NT) 2.0: tools for TAL effector design and target prediction. Nucleic Acids Res. 2012;40:W117–W122. doi: 10.1093/nar/gks608. [DOI] [PMC free article] [PubMed] [Google Scholar]
- 30.Neff KL, Argue DP, Ma AC, Lee HB, Clark KJ, Ekker SC. Mojo Hand, a TALEN design tool for genome editing applications. BMC Bioinform. 2013;14:1. doi: 10.1186/1471-2105-14-1. [DOI] [PMC free article] [PubMed] [Google Scholar]
Associated Data
This section collects any data citations, data availability statements, or supplementary materials included in this article.