

Abstract
While there is growing experimental evidence that cerebrospinal fluid (CSF) flow induced by the beating of ependymal cilia is an important factor for neuronal guidance, the respective contribution of vascular pulsation-driven macroscale oscillatory CSF flow remains unclear. This work uses computational fluid dynamics to elucidate the interplay between macroscale and cilia-induced CSF flows and their relative impact on near-wall dynamics. Physiological macroscale CSF dynamics are simulated in the ventricular space using subject-specific anatomy, wall motion and choroid plexus pulsations derived from magnetic resonance imaging. Near-wall flow is quantified in two subdomains selected from the right lateral ventricle, for which dynamic boundary conditions are extracted from the macroscale simulations. When cilia are neglected, CSF pulsation leads to periodic flow reversals along the ventricular surface, resulting in close to zero time-averaged force on the ventricle wall. The cilia promote more aligned wall shear stresses that are on average two orders of magnitude larger compared with those produced by macroscopic pulsatile flow. These findings indicate that CSF flow-mediated neuronal guidance is likely to be dominated by the action of the ependymal cilia in the lateral ventricles, whereas CSF dynamics in the centre regions of the ventricles is driven predominantly by wall motion and choroid plexus pulsation.
Keywords: cerebrospinal fluid dynamics, computational fluid dynamics, magnetic resonance imaging, ependymal cilia, neuronal migration
1. Introduction
A number of roles have been attributed to cerebrospinal fluid (CSF) over the years, ranging from that of a static mechanical brain protection medium, to a steadily flowing metabolite collector and to a neuroendocrine communication pathway [1,2]. Now, there is a growing body of evidence suggesting that CSF also plays an important role in the development and organization of the central nervous system through neuronal guidance [3,4].
The cerebral ventricles are lined by the ependyma, a single layer of ciliated ependymocytes in contact with the CSF [5]. These glial cells’ motile cilia beat in a periodic fashion (figure 1a), generating localized CSF flow [6]. It has been proposed that this cilia-induced flow clears debris from the ventricle walls as well as enhances mixing which may be particularly relevant in the third ventricle with respect to neuroendocrine communication [7]. While mutations that affect cilia motion have been associated with hydrocephalus [6,8–10], the exact mechanisms by which correspondingly altered CSF flow may be involved remain unclear.
Figure 1.

(a) Schematic of a beating ependymal cilium. The beating motion is composed of an effective and a recovery stroke [6]. (b) Cilia modelling approach. The action of the cilia is accounted for via body forces acting on the CSF. The applied force density is varied linearly from zero at the ventricular wall up to the value of fmax = 526 N m−3 at the tip of the cilia. fmax is determined empirically by matching the induced fluid velocity to experimental measurements. (Online version in colour.)
CSF motion also provides directional cues for neuronal migration: progenitor cells born under the ependymal lining of the lateral ventricles in the adult brain migrate as far as the olfactory bulb where they differentiate into neurons and astroglia [11–13]. Microscopic studies using mice demonstrated that the beating of ependymal cilia induces near-wall CSF flow in the direction of the migratory path of neuroblasts [4]. Conversely, defects in cilia motility or removal of the ependymal cilia lead to altered CSF flow [14] and neuroblast migration [4]. Collectively, these results suggest a strong interrelation between neuronal migration and local CSF dynamics.
However, while microscopic biological studies have considered CSF motion induced by cilia, they have not accounted for other major simultaneous contributors to CSF flow, namely the pulsation of the choroid plexus and the contraction and expansion of the ventricles. These are known to produce pulsatile CSF flow with velocities several orders of magnitude larger than those generated by the cilia [15–20]. Vice versa, none of the investigations of large-scale CSF dynamics has taken into account the effect of cilia motion. Consequently, the main contributor to near-wall CSF flow involved in neuronal migration is unknown.
In this work, we characterize the CSF flow in the entire ventricular space, characterizing the relative impact of macroscale (choroid plexus pulsation and ventricular wall motion) and microscale (beating of cilia) effects on near-wall CSF dynamics. We thereby shed light on the likely contributors to neuronal guidance. We used magnetic resonance imaging (MRI) to capture the geometry of the ventricular system of a healthy volunteer, the associated ventricular wall motion and pulsatile CSF flow through the aqueduct. These data were used as the basis for computational fluid dynamics (CFD) simulations of the in vivo macroscale CSF flow through the four ventricles. Combining macroscale CSF flow and microscale cilia motion poses an inherent numerical challenge given the differences in length scale. To circumvent that difficulty, we used the macroscale simulation to extract boundary conditions for two subdomains in the lateral ventricles and compared the near-wall flow structures and forces obtained with and without cilia.
2. Methods
Simulations are carried out in two steps as summarized in figure 2: first, the macroscale pulsatile CSF flow is calculated in the whole ventricular space; then, the near-wall flow characteristics are simulated in two subdomains located in the lateral ventricles. For the latter simulations, flow boundary conditions are extracted from the former, whereas information on the cilia orientation and force is obtained from two additional sets of preparatory calculations. Acquisition and processing of the in vivo data required for the macroscale simulations are presented first, followed by the numerical methods for the remaining calculations.
Figure 2.
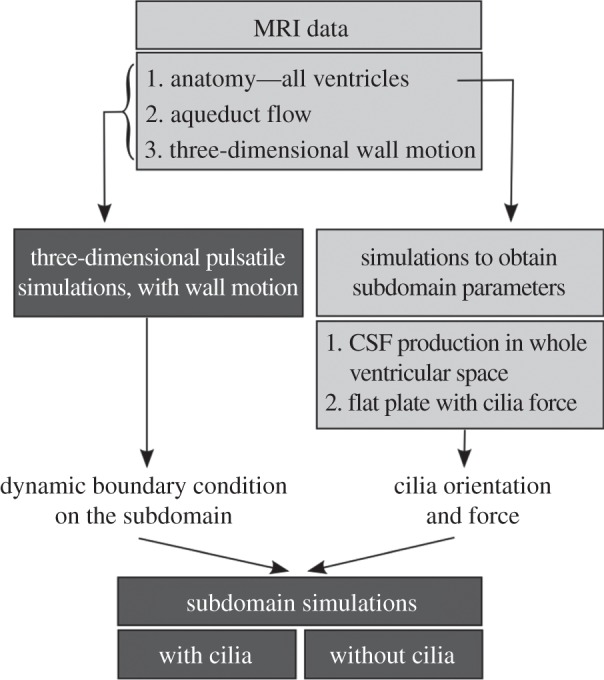
Simulation methodology. The dark grey boxes highlight the main simulation endpoints, namely the characterization of the pulsatile three-dimensional CSF dynamics in the whole ventricular space, and the comparison of the near-wall flow features with and without cilia in the ventricular subdomain. The light grey boxes summarize the in vivo data and preparatory calculations required for these simulations.
2.1. In vivo data acquisition
MRI was performed on a healthy 23-year-old female volunteer using a 3T Philips Achieva System (Philips Healthcare, The Netherlands). Informed consent for the use of imaging data for research purposes was obtained prior to the study. Three sequences were used: (i) a three-dimensional balanced gradient echo sequence in transverse, sagittal and coronal orientations to reconstruct the whole ventricular geometry, (ii) a retrospectively electrocardiogram-gated, two-dimensional phase-contrast gradient echo sequence in the aqueduct to acquire aqueductal flow, and (iii) a three-dimensional cine displacement encoding using simulated echoes (DENSE) sequence [21] with an eight-channel head coil to obtain brain motion. Displacement encoding for the DENSE sequence was applied in the read-out direction, and the three-dimensional volume was rotated twice by 90° to measure the entire three-dimensional displacement vector field. A summary of the MRI parameters is given in table 1.
Table 1.
MRI parameters used for acquisition of in vivo brain motion, flow rate through the aqueduct of Sylvius and ventricular anatomy.
| ventricular anatomy | aqueductal flow | brain motion | |
|---|---|---|---|
| sequence | three-dimensional balanced gradient echo | two-dimensional phase-contrast gradient echo | three-dimensional DENSE |
| voxel size | 0.6 × 0.6 × 0.6 mm³ | — | 3.0 × 3.0 × 3.0 mm³ |
| spatial resolution | — | 0.4 × 0.4 mm² | — |
| slice thickness | — | 4.0 mm | — |
| domain size | 220 × 220 × 80 mm³ | — | 168 × 168 × 168 mm³ |
| TR/TE | — | 14.5/6.4 ms | 9.3/5.5 ms |
| encoding strength | — | — | 0.2 mm/π |
| encoding velocity | — | 17 cm s−1 | — |
| EPI factor | — | — | 9 |
2.2. Processing of in vivo data
The ventricular space was segmented from the anatomical images using Avizo (VSG, France) and then smoothed using Geomagic Studio (Geomagic Inc., USA; figure 3a). Brain motion reconstruction from the three-dimensional DENSE data required a series of filtering operations. The datasets were registered to the anatomical reconstruction of the ventricles, and motion data stemming from within the ventricles were eliminated. Noise outside the skull was removed by filtering based on standard deviation. Finally, a low-pass Gaussian filter was applied to ensure a sufficiently smooth displacement field for subsequent simulations.
Figure 3.
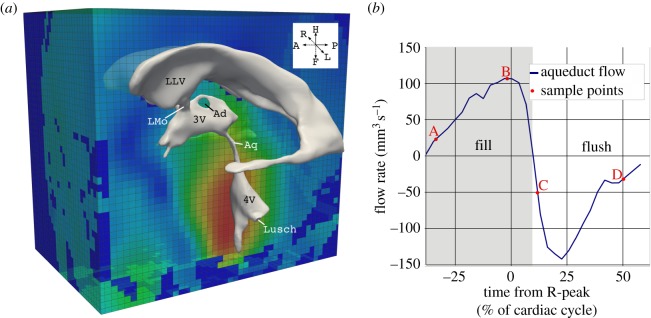
In vivo data obtained with MRI. (a) Ventricular geometry extracted from anatomical MRI images overlaid onto the MRI displacement field. (b) CSF flow rate through the aqueduct reconstructed from the two-dimensional phase contrast gradient echo sequence, and the four sample points (A–D) discussed in §3. Note that the electrocardiogram R-peak is used to define the start of the cardiac cycle. Points A and B are in the fill period where the flow through the aqueduct is oriented in cranial direction, whereas points C and D correspond to the flush period where CSF flow is in caudal direction. LLV, left lateral ventricle; LMo, left foramen of Monro; Ad, interthalamic adhesion; 3V, third ventricle; Aq, aqueduct of Sylvius; 4V, fourth ventricle; Lusch, foramen of Luschka.
Flow segmentation in the aqueduct was carried out semi-automatically using Matlab (The MathWorks Inc., USA) with the procedure outlined in [22], yielding the flow curve illustrated in figure 3b.
2.3. Macroscale simulation of pulsatile flow in the complete ventricular space
For the CFD simulations, the CSF was considered as an incompressible Newtonian fluid according to literature data [23,24]. A non-uniform unstructured mesh with four million cells representing the entire ventricular space was generated in ICEMCFD (ANSYS, USA) with variable characteristic edge lengths ranging from 0.1 to 0.4 mm and boundary cell layers in areas of expected large velocity gradients. Mesh independence simulations performed with 2.6 and 3.2 million cells revealed 2.3% and 0.25% maximum deviation in the flow rate, respectively, calculated for the subdomain at four random sample instances. The maximum deviation in the velocities averaged over four different probe locations was 10.8% and 4%, respectively. The incompressible Navier–Stokes equations were solved using an implicit PISO algorithm in OpenFOAM [25].
Choroid plexus pulsations were taken into account via a source term in the continuity equation. The temporal source magnitude was determined via the principle of mass conservation as the difference between aqueductal flow and ventricular volume change rate. No-slip boundary conditions were specified along all ventricle walls. Ventricular surface motion was interpolated from the reconstructed brain motion, and a zero relative pressure boundary condition was applied at the foramina of Luschka. The discretization was second order in space and time with a target maximum Courant–Friedrichs–Lewy number of 0.5.
2.4. Preparatory simulations to determine cilia orientation and force
According to Guirao et al. [26], murine ependymal cilia progressively align in the direction of CSF flow during development, with CSF production giving the first directional bias. In the absence of any other flow sources, the beating of the cilia yields near-wall CSF flow with a mean velocity of 45.6 ± 2.5 µm s−1.
Based on the first observation, the direction of the ependymal cilia was assumed to be aligned with the direction of wall shear stress (WSS) imposed by CSF production. This was obtained from simulations on the entire ventricular domain as in §2.3 without wall motion and choroid plexus pulsations. The source term in the continuity equation was held constant and equal to the CSF production rate of 0.35 ml min−1 [27]. The resultant directional field over the inferior surfaces of the investigated lateral ventricular subdomains (figure 4) is shown in figure 5.
Figure 4.

(a) Ventricular frontal and (b) central subdomains. Left: morphology and location of the subdomains (circled) within the right lateral ventricle. Right: computational grid and boundary conditions used for the subdomain simulations. (Online version in colour.)
Figure 5.
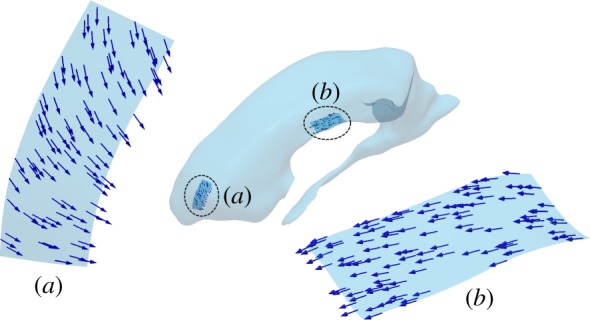
WSS orientation in the preparatory steady simulations in the (a) frontal and (b) central subdomains resulting solely through flow induced by continuous CSF production. This direction field defines the orientation of the motile cilia in the subsequent calculations. (Online version in colour.)
Next, we estimated the net mean force density imposed on the fluid by the beating cilia required to establish the CSF flow observed in Guirao et al. [26]. This net force density was assumed to be uniform over the ependymal surface and varied linearly from zero at the wall to a maximum value of fmax at 15 μm distance, which is the typical length of an ependymal cilium [28] (figure 1b). fmax was determined by a series of flat plate simulations without bulk flow and only subjected to a local body force in the plate vicinity. After matching the reported velocity at the cilia tip, the cilia-induced maximum force density was estimated to be fmax = 526 N m−3.
2.5. Flow simulation in subdomains of the lateral ventricles
To assess the impact of cilia motion on near-wall flow, a finer mesh was generated on selected subdomains of the right lateral ventricle. The locations of these subdomains in the frontal and central sections of the lateral ventricle were chosen based on their relevance for neuronal migration. The frontal subdomain comprises a 6 × 2.4 mm2 region bounded by the ventricular surfaces in both feet and head directions, resulting in a depth varying between 3 and 6 mm (figure 4a). Similarly, the central subdomain occupies a 3.2 × 7.9 mm2 region with a 6.6–7.7 mm depth range (figure 4b). The two subdomains were meshed using six layers of boundary cells in the first 15 μm from the ventricle wall (this corresponds to the nominal length of the cilia). Structured hexagonal grids were applied in the rest of the domain, resulting in mesh sizes of 320 000 and 384 000 cells for the frontal and central subdomains, respectively.
Simulations with and without cilia were performed using the boundary conditions illustrated in figure 4a: posterior, left and right planes were considered as flow inlets. Velocity distributions in the normal direction to these planes were imposed based on velocity values sampled from the pulsatile macroscale simulations. The anterior surface was treated as a fixed zero relative pressure outlet. The two ventricular surface boundaries were treated as no slip walls, and the contraction and deformation of the ventricles were omitted. For the simulation with the cilia, a body force representing the action of the cilia was imposed with the force and direction determined as described in §2.4. A grid independence study was performed in the central subdomain using 48, 96, 192, 384 and 480 × 103 cells with four, four, five, six and seven boundary cell layers, respectively. Results at four random sample locations revealed less than 1% difference in velocity magnitude between calculations on grids with more than 48 × 103 cells, and less than 1% difference in WSS for grids with at least six boundary cell layers.
3. Results
3.1. Pulsatile macroscale flow in the entire ventricular space
The basic pulsatile flow characteristics in the ventricular CSF space can be described representatively through the four sample points (A–D) marked in figure 3. In the aqueduct of Sylvius, maximum velocities were 90 mm s−1 (Reynolds number 250) and 144 mm s−1 (Reynolds number 300) in the flush and fill period, respectively. Maximum WSS was 1.6 Pa, and maximum pressure drop along the aqueduct was 19 Pa.
The most pronounced flow feature in the third ventricle is a vortex ring between the aqueduct and interthalamic adhesion (figure 6) that is prevalent throughout the cardiac cycle. The vortex is clearly identified at the beginning of the fill period (A1) where it deflects the accelerated flow from the aqueduct towards the adhesion. Around peak fill (B1), the vortex ring moves anteriorly and the CSF directly reaches the foramina of Monro without significant deflection. During the flush period (C1, D1), flow from the foramina is entrained in the destabilized vortical structure prior to entering the aqueduct. Flow in the fourth ventricle (figure 6, A2–D2) is mostly aligned with the bulk flow direction with few secondary structures.
Figure 6.
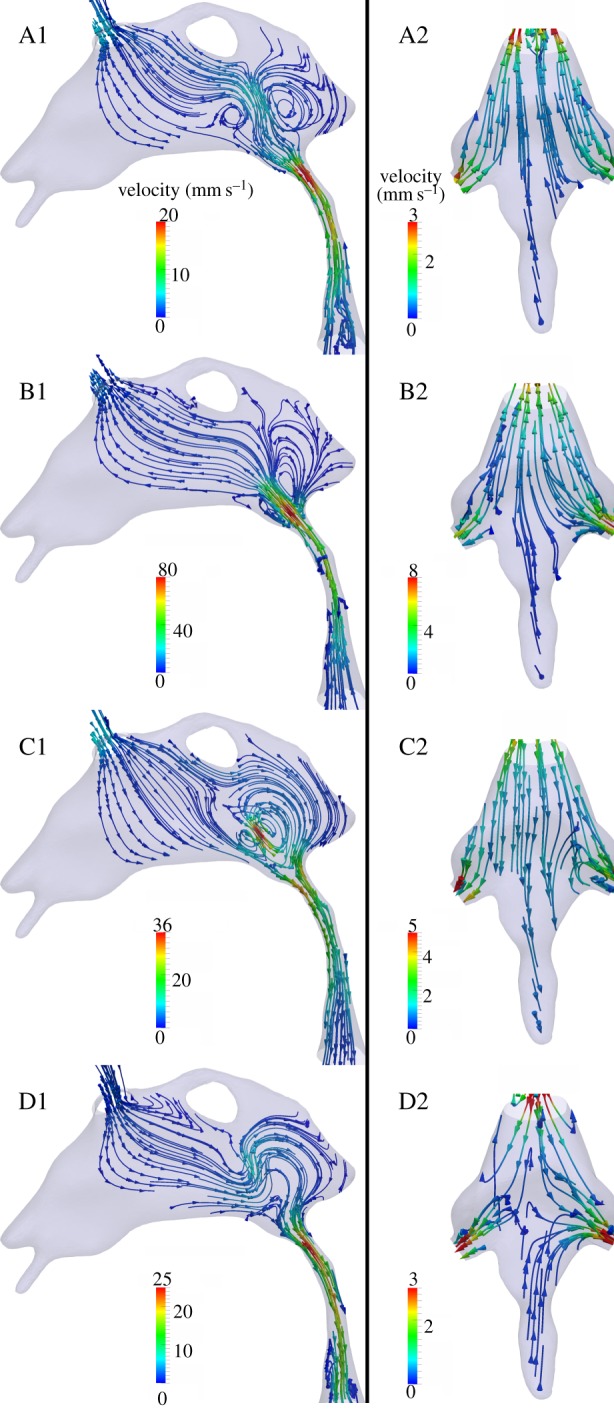
Flow characteristics in the third ventricle and aqueduct of Sylvius (A1–D1), and in the fourth ventricle (A2–D2). Streamlines are derived with respect to the global coordinate system and colour-coded by velocity magnitude. Time points A through D correspond to the instants marked in figure 3.
In the lateral ventricles, CSF flow patterns can be differentiated between phases dominated by the inertia of the fluid (figure 7a,c), and phases dominated by the choroid plexus and ventricular wall motion (figure 7b,d). In the former, streamlines are largely parallel to the ventricle axis, showing clear filling or flushing patterns, whereas, in the latter, streamlines are mostly orthogonal to the walls flowing, respectively, towards or away from the contracting or dilating borders.
Figure 7.
Flow characteristics in the left lateral ventricle. Streamlines are colour-coded by velocity magnitude. Panels (a)–(d) represent time points A–D, respectively, as defined in figure 3.
3.2. Near-wall cerebrospinal fluid dynamics with and without cilia motion
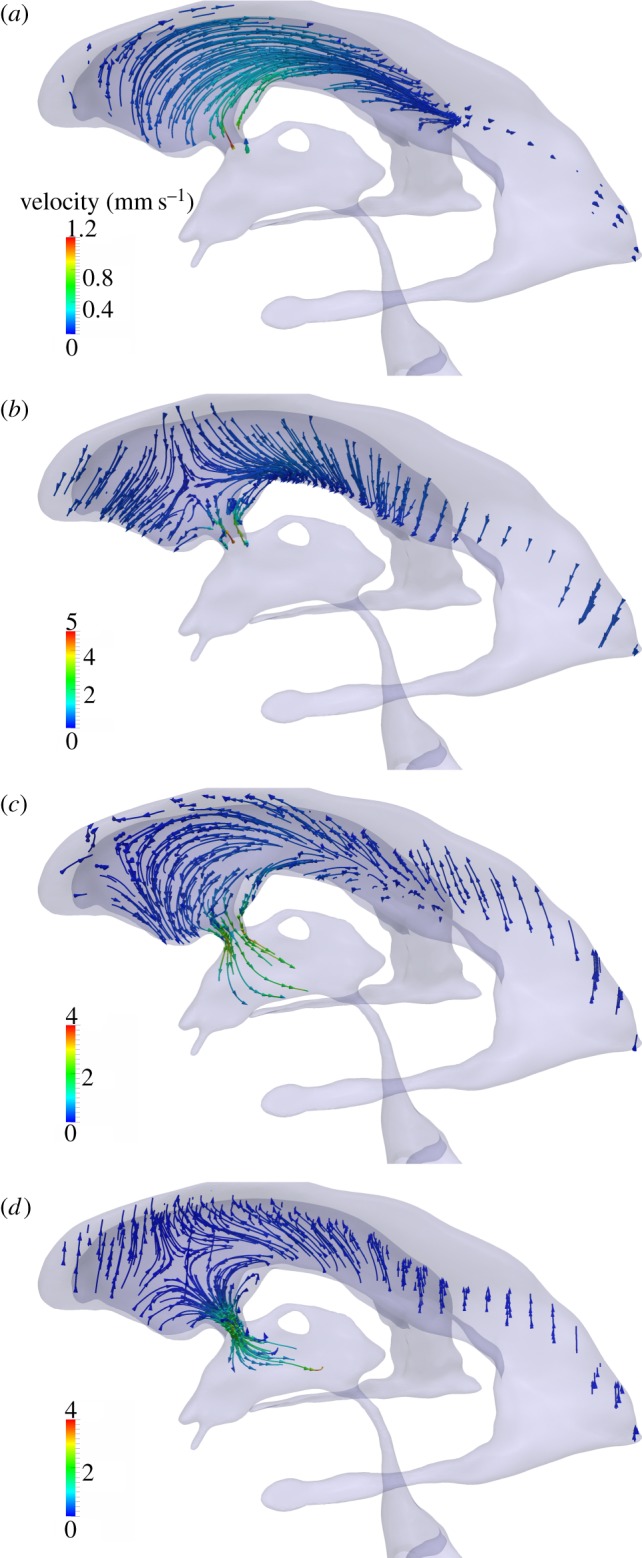
Comparison of the flow characteristics obtained with and without cilia motion (figures 8–12) reveals a marked effect of the cilia on the near-wall dynamics while the macroscopic velocity profiles remain close to identical. Figures 8 and 9 compare the velocity profiles with and without consideration of the cilia force in the frontal and central subdomain, respectively. In the absence of cilia, the pulsatile nature of the bulk CSF flow is felt down to the wall boundary layer with periodic changes in flow direction (figures 8 and 9, A1–D1). For the frontal domain in the absence of cilia, there is flow in both directions along the sagittal axis during the fill period shown in figure 8, A1,B1. The flow starts to change to posterior only direction at the beginning of the flush period (figure 8, C1), fully reaching unidirectional state at time point D. By contrast, when considering the effect of the cilia force for the same subdomain (figure 8, A2–D2), the near-wall flow direction remains constant despite the periodic changes in bulk flow, following the orientation of the mean force imposed by the cilia. Further away from the wall, the inertia of the bulk CSF flow is large enough to overcome the cilia-induced force, yielding periodic changes in bulk flow direction between the fill and flush phases.
Figure 8.

Comparison of the velocity profiles in the frontal subdomain when neglecting (A1–D1) or accounting for (A2–D2) cilia action. The velocity vector length is scaled with the velocity magnitude (mm s−1). These vectors are projected to a sagittal plane going through point Qf. To illustrate the effect of cilia on the velocity fields, the velocity profiles are sampled over the first 1 mm of the line starting in point Qf on the inferior wall (see inset) and extending perpendicularly into the ventricle lumen. Time points A–D are defined in figure 3. (Online version in colour.)
Figure 12.
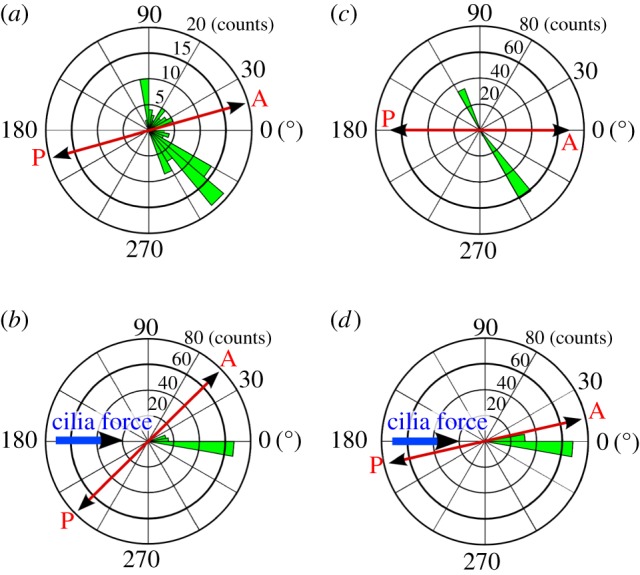
Polar bar graph showing the spread of the WSS direction throughout the cardiac cycle for the frontal subdomain (a,b) and the central subdomain (c,d), when neglecting (a,c) or accounting for (b,d) cilia motion. WSS direction was sampled in points Qf and Qc, respectively, as defined in figures 8 and 9 at 101 equally spaced time instances during the cardiac cycle, its average defining the polar axis. The azimuth indicates the deviation from this mean direction while the radius indicates the number of samples in 36 bins of 10°. The anterior/posterior and cilia force directions are provided for reference. (Online version in colour.)
Figure 9.

Comparison of the velocity profiles in the central subdomain when neglecting (A1–D1) or accounting for (A2–D2) cilia action. The velocity vector length is scaled with the velocity magnitude (mm s−1). These vectors are projected to a sagittal plane going through point Qc. To illustrate the effect of cilia on the velocity fields, the velocity profiles are sampled over the first 1 mm of the line starting in point Qc on the inferior wall (see inset) and extending perpendicularly into the ventricle lumen. Time points A–D are defined in figure 3. (Online version in colour.)
Owing to its location, the macroscopic flow characteristics of the central subdomain are markedly different from that of the frontal one. In the absence of cilia, the flow in the central domain is fully in anterior-to-posterior direction during the fill period (figure 9, A1,B1). Then, during the flush phase, the flow reverses both in the wall boundary layer and bulk region (figure 9, C1,D1). Yet, despite these differences in macroscale flows, the impact of the cilia is similar to that observed in the frontal domain, resulting in a constant near-wall flow direction, irrespective of the bulk flow pulsations (figure 9, A2–D2).
Figures 10–12 illustrate the impact of the cilia on the WSS in terms of magnitude and directionality. In the simulations without cilia, the time-averaged magnitude of WSS is close to zero for both subdomains, going up to a maximum of 0.04 mPa (figures 10a and 11a). The standard deviation of the instantaneous WSS direction is very large, with maximum of 100° in the frontal and 110° in the central subdomain (figures 10b and 11b), illustrating the fact that in the absence of cilia the flow direction varies significantly near the wall. By contrast, in the presence of cilia, the time-averaged WSS magnitude rises up to 2 and 5 mPa for the frontal and central subdomains, respectively (figures 10c and 11c). The standard deviation of the instantaneous WSS direction decreases substantially to a maximum of 15° in both domains (figures 10d and 11d). These results are best understood when viewed in conjunction with the spread of the WSS direction angle during the cardiac cycle (figure 12). Without cilia motion (figure 12a,c), there is a wide distribution of the WSS direction, resulting in a close to zero net force. In the presence of the cilia (figure 12b,d), the instantaneous WSS is better aligned with the temporal mean value; its effects are thus additive throughout the cardiac cycle. Hence, cilia action aligns the flow to a great extent, increasing the time-averaged WSS by two orders of magnitude from a mean of 0.04 mPa without the cilia up to 2–5 mPa with the cilia.
Figure 10.
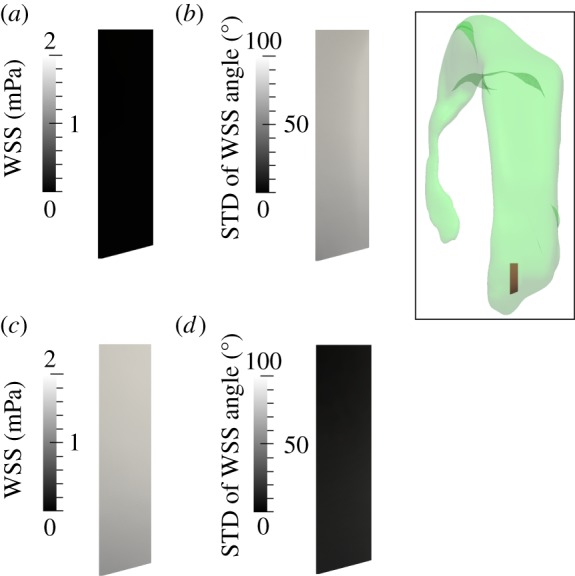
Analysis of the WSS distribution on the lateral ventricle wall within the frontal subdomain shown in the inset when neglecting (a,b) or accounting for (c,d) cilia motion. (a,c) Time-averaged WSS magnitude. (b,d) Standard deviation (STD) of the angle between the instantaneous and time-averaged WSS. (Online version in colour.)
Figure 11.
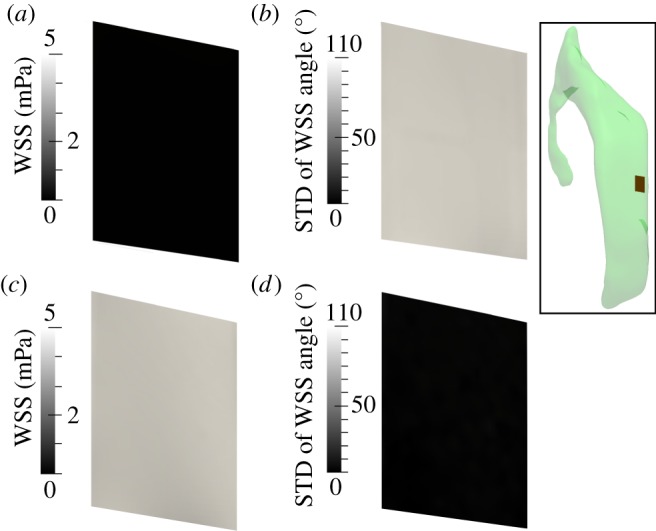
Analysis of the WSS distribution on the lateral ventricle wall within the central subdomain shown in the inset when neglecting (a,b) or accounting for (c,d) cilia motion. (a,c) Time-averaged WSS magnitude. (b,d) Standard deviation (STD) of the angle between the instantaneous and time-averaged WSS. (Online version in colour.)
4. Discussion and conclusion
This study seeks to shed light on the near-wall fluid dynamics in the cerebral ventricles which contribute to neuronal guidance. To this end, we first characterized the bulk CSF dynamics in the entire ventricular space, accounting for both ventricular wall motion and choroid plexus pulsations. Focusing on two subdomains in the right lateral ventricle, we then demonstrated that bulk flow alone does not produce any notable directionality of either flow or shear stress near or on the surface of the lateral ventricles. Instead, we observed that the ependymal cilia appear as the major contributors promoting time-averaged flow directionality, yielding both an alignment of the WSS orientation and two orders of magnitude increase in the average WSS magnitude.
This is the first study to characterize near-wall flow and WSS in the cerebral ventricles in detail by bridging the gap between macro- and microscale effects. Wall effects of pulsatile CSF flow in the ventricular space have received little attention so far. Biological studies in animal or in vitro models have mostly focused on flow and WSS induced by the cilia alone [4,26], whereas macroscopic flows have been approached predominantly from a neurosurgical [27,29,30], radiological [31–33] or biomedical [15–18,20] point of view, mostly without interest in WSS or near-wall dynamics. In point of fact, WSS estimates from radiological studies are limited by the near-wall resolution, whereas numerical investigations have been limited by underlying model assumptions, including simplified geometries, steady flows, neglected wall motion, choroid plexus pulsations or cilia action.
Our macroscale results restate the importance of accounting for both the geometric intricacy of the ventricular space and its dynamic pulsatile environment, as these induce peak flow, pressure and WSS values that are much higher than those estimated when considering the steady CSF production alone [34,35]. The analysis of the in vivo MRI data further demonstrates that CSF pulsatility as measured in the aqueduct of Sylvius cannot be explained by the sole contraction/dilation of the ventricles, suggesting a non-negligible contribution from the choroid plexus. It is also noteworthy that this study revealed similar peak characteristic values and flow structures in the third ventricle (figure 6) as reported by Kurtcuoglu et al. [24], even though the two studies were based on different volunteers. These structures—particularly the dynamics of the main vortex—have also been documented by direct imaging [19].
In the absence of the microscale cilia action, the subdomain simulations reveal patterns comparable to Womersley flow (figures 8 and 9, A1–D1), where flow reversal in the wall boundary layer occurs with a phase shift relative to the far field. Most importantly, while peak WSS can be relatively high, its time-average is almost zero (figures 10a and 11a), implying that without ependymal cilia, the mean shear stress acting on the ventricle walls over a cardiac cycle would be close to null. Together with the lack of flow directionality, this goes against the evidence of flow-mediated neuronal guidance. By contrast, the simulations with the cilia show that the net force imposed by the cilia is sufficient for maintaining a constant flow direction in the vicinity of the wall throughout the cardiac cycle, confining flow reversals to the far field (figures 8 and 9, A2–D2). The resultant WSS has a mean of 2 and 5 mPa for the frontal and central subdomains, respectively (figures 10c and 11c) and is aligned with the direction of the cilia force (figure 12b,d). This is coherent with observations of neuronal migration patterns [4,12,26].
With the exception of some areas such as those close to the foramina of Monro, the pulsatile bulk flow in the remainder of the ventricular space is faster than in the lateral ventricles. In particular, high velocities of the order of 10 cm s−1 are reached in the aqueduct of Sylvius. While the aqueduct is not relevant for neuronal guidance, its ciliated ependymal lining may nevertheless influence near-wall CSF dynamics. We tested this with an additional subdomain in the aqueduct: in contrast to the lateral ventricles, aqueductal near-wall CSF dynamics are dominated by the pulsatile bulk flow rather than by action of the cilia. Reversal of the bulk flow direction is propagated all the way down to the aqueduct wall.
5. Limitations
In this study, we considered a one-way coupling of the pulsatile macroscopic velocity field with cilia-induced flow. This was done by imposing the macroscopic field as transient velocity boundary conditions on the posterior and lateral planes of the investigated subdomains. Consequently, there is no feedback from the cilia to the flow outside these domains. To test whether this approach is justified, we compared the velocities in the centre of both ventricular subdomains at each time instance defined in figure 3 in simulations with and without cilia action. We observed a maximum of 10.7% difference which we consider acceptable.
An assumption of this study is that the cilia are aligned with the net CSF flow in the adult brain. In vivo, however, their orientation is determined during brain maturation [26]. The actual and simulated cilia orientations may thus differ. Still, the resultant direction field determined in our subdomain (figure 5) was coherent with experimental observations [4], with longitudinally aligned tracks directed towards the anterior lobe of the lateral ventricle.
There is large variation in the reported values for the magnitude of cilia-generated velocities, ranging from approximately 1 to 1000 μm s−1 [36]. However, values for ventricular ependymal cilia fall within a much narrower range, from 10 μm s−1 in tadpole larvae [37] to 20–45 μm s−1 in mice [8,26]. Here, we relied on the 45.6 ± 2.5 µm s−1 given in Guirao et al. [26], as that report contained an unambiguous characterization of the experimental set-up. With that value, the cilia were observed to yield a two orders of magnitude increase in the mean WSS magnitude. They can thus be expected to have a measurable impact on the mean WSS even when considering clearly lower cilia-induced velocities such as those of approximately 20 μm s−1 reported in Ibanez-Tallon et al. [8].
The cilia-generated force density was further assumed to (i) be constant in time, representing mean action on the fluid rather than the cilia's periodic beating motion, (ii) remain constant, irrespective of the external flow conditions, and (iii) increase linearly from zero at the wall to fmax at the tip of the cilia. The first approximation was deemed reasonable as the cilia beat frequency is around 25 Hz [26], one order of magnitude higher than that of bulk flow variations. Contrary to our second assumption, experimental and numerical work on cilia or sperm flagella, which exhibit similar mechanical behaviour, suggests that the external fluid viscosity and dynamics impact the beat frequency [38–40] and, thereby, the resultant net force density. There is thus a need for more detailed characterization of the interaction between CSF dynamics and ventricular ependymal cilia motion. Similarly, the third assumption is one made out of necessity, as there is a lack of data on the actual force density distribution generated by the ependymal cilia. This distribution could, principally, be determined based on analytical [41] or computational models [42–45], or be derived from measured velocity profiles. If the true force density distribution has a steeper slope than assumed here, our model would underestimate the effect of the cilia. This would be in support of our main message that near lateral ventricular wall CSF dynamics are dominated by the cilia. If the distribution has a flatter slope, then the relative effect of the cilia would be reduced. However, given the fact that our simulations predict that WSS induced by the cilia is on average two orders of magnitude larger than that generated by ventricle motion and choroid plexus pulsation, we are confident that also in that case the main message remains valid.
6. Conclusion
Our investigations demonstrated that in the lateral ventricles, near-wall CSF dynamics and therefrom derived WSS are dominated by ependymal cilia action. In these regions, macroscale pulsatile CSF flow driven by ventricular expansion and contraction as well as choroid plexus pulsation lacked time-averaged directionality and yielded an almost zero net force. This supports the concept that altered neuroblast migration after cilia removal may be mediated by a change in near-wall CSF dynamics.
Acknowledgements
We thank Tara Gschwend of MELS, University of Zurich, for contributing figure 1.
Funding statement
This work was supported by the Swiss National Science Foundation through SmartShunt – The Hydrocephalus Project, 200021/147193 CINDY and NCCR Kidney.CH, as well as by the European Commission through PIIF-GA-2010-275823.
References
- 1.Davson H, Segal MB. 1996. Physiology of the CSF and blood–brain barriers, 1st edn New York, NY: CRC Press. [Google Scholar]
- 2.Rodriguez EM, Blazquez JL, Guerra M. 2010. The design of barriers in the hypothalamus allows the median eminence and the arcuate nucleus to enjoy private milieus: the former opens to the portal blood and the latter to the cerebrospinal fluid. Peptides 31, 757–776. ( 10.1016/j.peptides.2010.01.003) [DOI] [PubMed] [Google Scholar]
- 3.Lehtinen MK, Walsh CA. 2011. Neurogenesis at the brain–cerebrospinal fluid interface. Annu. Rev. Cell Dev. Biol. 27, 653–679. ( 10.1146/annurev-cellbio-092910-154026) [DOI] [PMC free article] [PubMed] [Google Scholar]
- 4.Sawamoto K, et al. 2006. New neurons follow the flow of cerebrospinal fluid in the adult brain. Science 311, 629–632. ( 10.1126/science.1119133) [DOI] [PubMed] [Google Scholar]
- 5.Del Bigio MR. 1995. The ependyma: a protective barrier between brain and cerebrospinal fluid. Glia 14, 1–13. ( 10.1002/glia.440140102) [DOI] [PubMed] [Google Scholar]
- 6.Lechtreck KF, Delmotte P, Robinson ML, Sanderson MJ, Witman GB. 2008. Mutations in hydin impair ciliary motility in mice. J. Cell Biol. 180, 633–643. ( 10.1083/jcb.200710162) [DOI] [PMC free article] [PubMed] [Google Scholar]
- 7.Roth Y, Kimhi Y, Edery H, Aharonson E, Priel Z. 1985. Ciliary motility in brain ventricular system and trachea of hamsters. Brain Res. 330, 291–297. ( 10.1016/0006-8993(85)90688-2) [DOI] [PubMed] [Google Scholar]
- 8.Ibanez-Tallon I, Pagenstecher A, Fliegauf M, Olbrich H, Kispert A, Ketelsen UP, North A, Heintz N, Omran H. 2004. Dysfunction of axonemal dynein heavy chain Mdnah5 inhibits ependymal flow and reveals a novel mechanism for hydrocephalus formation. Hum. Mol. Genet. 13, 2133–2141. ( 10.1093/hmg/ddh219) [DOI] [PubMed] [Google Scholar]
- 9.Tissir F, et al. 2010. Lack of cadherins Celsr2 and Celsr3 impairs ependymal ciliogenesis, leading to fatal hydrocephalus. Nat. Neurosci. 13, 700–707. ( 10.1038/nn.2555) [DOI] [PubMed] [Google Scholar]
- 10.Lee L. 2013. Riding the wave of ependymal cilia: genetic susceptibility to hydrocephalus in primary ciliary dyskinesia. J. Neurosci. Res. 91, 1117–1132. ( 10.1002/jnr.23238) [DOI] [PubMed] [Google Scholar]
- 11.Benner EJ, et al. 2013. Protective astrogenesis from the SVZ niche after injury is controlled by Notch modulator Thbs4. Nature 497, 369–373. ( 10.1038/nature12069) [DOI] [PMC free article] [PubMed] [Google Scholar]
- 12.Curtis MA, et al. 2007. Human neuroblasts migrate to the olfactory bulb via a lateral ventricular extension. Science 315, 1243–1249. ( 10.1126/science.1136281) [DOI] [PubMed] [Google Scholar]
- 13.Suzuki SO, Goldman JE. 2003. Multiple cell populations in the early postnatal subventricular zone take distinct migratory pathways: a dynamic study of glial and neuronal progenitor migration. J. Neurosci. 23, 4240–4250. [DOI] [PMC free article] [PubMed] [Google Scholar]
- 14.Banizs B, Pike MM, Millican CL, Ferguson WB, Komlosi P, Sheetz J, Bell PD, Schwiebert EM, Yoder BK. 2005. Dysfunctional cilia lead to altered ependyma and choroid plexus function, and result in the formation of hydrocephalus. Development 132, 5329–5339. ( 10.1242/dev.02153) [DOI] [PubMed] [Google Scholar]
- 15.Cheng S, Tan K, Bilston LE. 2010. The effects of the interthalamic adhesion position on cerebrospinal fluid dynamics in the cerebral ventricles. J. Biomech. 43, 579–582. ( 10.1016/j.jbiomech.2009.10.002) [DOI] [PubMed] [Google Scholar]
- 16.Gupta S, Soellinger M, Grzybowski DM, Boesiger P, Biddiscombe J, Poulikakos D, Kurtcuoglu V. 2010. Cerebrospinal fluid dynamics in the human cranial subarachnoid space: an overlooked mediator of cerebral disease. I. Computational model. J. R. Soc. Interface 7, 1195–1204. ( 10.1098/rsif.2010.0033) [DOI] [PMC free article] [PubMed] [Google Scholar]
- 17.Howden L, Giddings D, Power H, Aroussi A, Vloeberghs M, Garnett M, Walker D. 2008. Three-dimensional cerebrospinal fluid flow within the human ventricular system. Comput. Methods Biomech. Biomed. Eng. 11, 123–133. ( 10.1080/10255840701492118) [DOI] [PubMed] [Google Scholar]
- 18.Kurtcuoglu V, Soellinger M, Summers P, Poulikakos D, Boesiger P. 2007. Mixing and modes of mass transfer in the third cerebral ventricle: a computational analysis. J. Biomech. Eng. 129, 695–702. ( 10.1115/1.2768376) [DOI] [PubMed] [Google Scholar]
- 19.Stadlbauer A, Salomonowitz E, van der Riet W, Buchfelder M, Ganslandt O. 2010. Insight into the patterns of cerebrospinal fluid flow in the human ventricular system using MR velocity mapping. Neuroimage 51, 42–52. ( 10.1016/j.neuroimage.2010.01.110) [DOI] [PubMed] [Google Scholar]
- 20.Sweetman B, Xenos M, Zitella L, Linninger AA. 2011. Three-dimensional computational prediction of cerebrospinal fluid flow in the human brain. Comput. Biol. Med. 41, 67–75. ( 10.1016/j.compbiomed.2010.12.001) [DOI] [PMC free article] [PubMed] [Google Scholar]
- 21.Soellinger M, Rutz AK, Kozerke S, Boesiger P. 2009. 3D cine displacement-encoded MRI of pulsatile brain motion. Magn. Reson. Med. 61, 153–162. ( 10.1002/Mrm.21802) [DOI] [PubMed] [Google Scholar]
- 22.Schmid Daners M, Knobloch V, Soellinger M, Boesiger P, Seifert B, Guzzella L, Kurtcuoglu V. 2012. Age-specific characteristics and coupling of cerebral arterial inflow and cerebrospinal fluid dynamics. PLoS ONE 7, e37502 ( 10.1371/journal.pone.0037502) [DOI] [PMC free article] [PubMed] [Google Scholar]
- 23.Bloomfield IG, Johnston IH, Bilston LE. 1998. Effects of proteins, blood cells and glucose on the viscosity of cerebrospinal fluid. Pediatr. Neurosurg. 28, 246–251. ( 10.1159/000028659) [DOI] [PubMed] [Google Scholar]
- 24.Kurtcuoglu V, Soellinger M, Summers P, Boomsma K, Poulikakos D, Boesiger P, Ventikos Y. 2007. Computational investigation of subject-specific cerebrospinal fluid flow in the third ventricle and aqueduct of Sylvius. J. Biomech. 40, 1235–1245. ( 10.1016/j.jbiomech.2006.05.031) [DOI] [PubMed] [Google Scholar]
- 25.Jasak H. 2009. OpenFOAM: open source CFD in research and industry. Int. J. Nav. Arch. Ocean Eng. 1, 89–94. ( 10.3744/Jnaoe.2009.1.2.089) [DOI] [Google Scholar]
- 26.Guirao B, et al. 2010. Coupling between hydrodynamic forces and planar cell polarity orients mammalian motile cilia. Nat. Cell Biol. 12, 520 ( 10.1038/Ncb0510-520a) [DOI] [PubMed] [Google Scholar]
- 27.Czosnyka M, Czosnyka Z, Momjian S, Pickard JD. 2004. Cerebrospinal fluid dynamics. Physiol. Meas. 25, R51–R76. ( 10.1088/0967-3334/25/5/R01) [DOI] [PubMed] [Google Scholar]
- 28.Afzelius BA. 2004. Cilia-related diseases. J. Pathol. 204, 470–477. ( 10.1002/path.1652) [DOI] [PMC free article] [PubMed] [Google Scholar]
- 29.Qvarlander S, Lundkvist B, Koskinen LO, Malm J, Eklund A. 2013. Pulsatility in CSF dynamics: pathophysiology of idiopathic normal pressure hydrocephalus. J. Neurol. Neurosurg. Psychiatry 84, 735–741. ( 10.1136/jnnp-2012-302924) [DOI] [PubMed] [Google Scholar]
- 30.Bottan S, Schmid Daners M, de Zelicourt D, Fellner N, Poulikakos D, Kurtcuoglu V. 2013. Assessment of intracranial dynamics in hydrocephalus: effects of viscoelasticity on the outcome of infusion tests. J. Neurosurg. 119, 1511–1519. ( 10.3171/2013.8.JNS122497) [DOI] [PubMed] [Google Scholar]
- 31.Knobloch V, Binter C, Kurtcuoglu V, Kozerke S. 2014. Arterial, venous, and cerebrospinal fluid flow: simultaneous assessment with Bayesian multipoint velocity-encoded MR imaging. Radiology 270, 566–573. ( 10.1148/radiol.13130840) [DOI] [PubMed] [Google Scholar]
- 32.Yamada S, et al. 2013. Influence of respiration on cerebrospinal fluid movement using magnetic resonance spin labeling. Fluids Barriers CNS 10, 36 ( 10.1186/2045-8118-10-36) [DOI] [PMC free article] [PubMed] [Google Scholar]
- 33.Balédent O. 2014. Imaging of the cerebrospinal fluid circulation. In Adult hydrocephalus (ed. Rigamonti D.), pp. 121–138. Cambridge, UK: Cambridge University Press. [Google Scholar]
- 34.Fin L, Grebe R. 2003. Three dimensional modeling of the cerebrospinal fluid dynamics and brain interactions in the aqueduct of sylvius. Comput. Methods Biomech. Biomed. Eng. 6, 163–170. ( 10.1080/1025584031000097933) [DOI] [PubMed] [Google Scholar]
- 35.Jacobson EE, Fletcher DF, Morgan MK, Johnston IH. 1996. Fluid dynamics of the cerebral aqueduct. Pediatr. Neurosurg. 24, 229–236. ( 10.1159/000121044) [DOI] [PubMed] [Google Scholar]
- 36.Jonas S, Bhattacharya D, Khokha MK, Choma MA. 2011. Microfluidic characterization of cilia-driven fluid flow using optical coherence tomography-based particle tracking velocimetry. Biomed. Opt. Express 2, 2022–2034. ( 10.1364/BOE.2.002022) [DOI] [PMC free article] [PubMed] [Google Scholar]
- 37.Miskevich F. 2010. Imaging fluid flow and cilia beating pattern in Xenopus brain ventricles. J. Neurosci. Methods 189, 1–4. ( 10.1016/j.jneumeth.2010.02.015) [DOI] [PubMed] [Google Scholar]
- 38.Eshel D, Gibbons IR. 1989. External mechanical control of the timing of bend initiation in sea urchin sperm flagella. Cell Motil. Cytoskeleton 14, 416–423. ( 10.1002/cm.970140311) [DOI] [PubMed] [Google Scholar]
- 39.Gueron S, Levit-Gurevich K. 1998. Computation of the internal forces in cilia: application to ciliary motion, the effects of viscosity, and cilia interactions. Biophys. J. 74, 1658–1676. ( 10.1016/S0006-3495(98)77879-8) [DOI] [PMC free article] [PubMed] [Google Scholar]
- 40.Machemer H. 1972. Ciliary activity and the origin of metachrony in Paramecium: effects of increased viscosity. J. Exp. Biol. 57, 239–259. [DOI] [PubMed] [Google Scholar]
- 41.Hilfinger A, Chattopadhyay AK, Julicher F. 2009. Nonlinear dynamics of cilia and flagella. Phys. Rev. E 79, 051918 ( 10.1103/PhysRevE.79.051918) [DOI] [PubMed] [Google Scholar]
- 42.Chen D, Norris D, Ventikos Y. 2011. Ciliary behaviour and mechano-transduction in the embryonic node: computational testing of hypotheses. Med. Eng. Phys. 33, 857–867. ( 10.1016/j.medengphy.2010.10.020) [DOI] [PubMed] [Google Scholar]
- 43.Smith DJ, Blake JR, Gaffney EA. 2008. Fluid mechanics of nodal flow due to embryonic primary cilia. J. R. Soc. Interface 5, 567–573. ( 10.1098/rsif.2007.1306) [DOI] [PMC free article] [PubMed] [Google Scholar]
- 44.Jayathilake PG, Tan Z, Le DV, Lee HP, Khoo BC. 2012. Three-dimensional numerical simulations of human pulmonary cilia in the periciliary liquid layer by the immersed boundary method. Comput. Fluids 67, 130–137. ( 10.1016/j.compfluid.2012.07.016) [DOI] [Google Scholar]
- 45.Lee WL, Jayathilake PG, Tan Z, Le DV, Lee HP, Khoo BC. 2011. Muco-ciliary transport: effect of mucus viscosity, cilia beat frequency and cilia density. Comput. Fluids 49, 214–221. ( 10.1016/j.compfluid.2011.05.016) [DOI] [Google Scholar]