Abstract
Receptive field properties of neurons in A1 can rapidly adapt their shapes during task performance in accord with specific task demands and salient sensory cues (Fritz et al., Hearing Research, 206:159–176, 2005a, Nature Neuroscience, 6: 1216–1223, 2003). Such modulatory changes selectively enhance overall cortical responsiveness to target (foreground) sounds and thus increase the likelihood of detection against the background of reference sounds. In this study, we develop a mathematical model to describe how enhancing discrimination between two arbitrary classes of sounds can lead to the observed receptive field changes in a variety of spectral and temporal discrimination tasks. Cortical receptive fields are modeled as filters that change their spectro-temporal tuning properties so as to respond best to the discriminatory acoustic features between foreground and background stimuli. We also illustrate how biologically plausible constraints on the spectro-temporal tuning of the receptive fields can be used to optimize the plasticity. Results of the model simulations are compared to published data from a variety of experimental paradigms.
Keywords: Auditory, Cortical, Rapid task-related plasticity, Computational model
1 Introduction
Receptive field properties of neurons in A1 can rapidly and adaptively be reshaped during task performance in accord with specific behavioral demands and salient sensory cues (Fritz et al. 2003, 2005b; Soto et al. 2006). Such modulatory changes selectively enhance overall cortical responsiveness to target sounds and thus increase the likelihood of detection against the background of reference sounds. Therefore, different auditory tasks induce unique changes in cortical receptive fields that depend on the structure of the task as well as on the specific spectrotemporal receptive field (STRF) of the neurons under investigation (Fritz et al. 2003, 2005b).
We develop here a mathematical model to predict the STRF changes needed for optimal discrimination between two arbitrary classes of sounds. The STRFs are modeled as filters that change their spectro-temporal tuning properties in order to extract the discriminatory features relevant to the ongoing behavioral task. Receptive field changes are optimal in the sense that they maximize the quadratic distance between the responses to two classes of sounds over the time course of the stimuli. In addition, we describe how this optimization can be achieved under arbitrary constraints on the STRFs reflecting plausible physiological limitations and finite resources that set boundary constraints on the extent of neural plasticity, e.g., limited synaptic input to a neuron or finite temporal integration. We tested the model’s ability to account for the observed plasticity in different types of spectral and temporal discrimination tasks: (1) detecting a tone (Fritz et al. 2003) or (2) multiple tones (Fritz et al. 2007) against a contrasting background (reference) of spectro-temporally modulated noise; (3) detecting a tone embedded in the spectro-temporally modulated noise (Atiani et al. 2009) (4) discriminating between two tones with different frequencies (Fritz et al. 2005b), and (5) between two click trains of different rates (Fritz 2005). Finally, we shall use the model to predict optimal receptive field changes for (6) discriminating spectrotemporal patterns (ripples) and complex sounds (phonemes) that have not yet been experimentally tested.
2 Methods
2.1 Behavioral auditory tasks and animal training
All experimental procedures reported in this study were approved by the University of Maryland Animal Care and Use Committee and were in accord with National Institutes of Health guidelines. Ferrets were trained to perform auditory tasks using a modified conditioned avoidance procedure (Heffner and Heffner 1995). The tasks included tone and tone in noise detection (Atiani et al. 2009; Fritz et al. 2003), multi-tone detection (Fritz et al. 2007), tone frequency discrimination (Fritz et al. 2005b) and temporal click discrimination (Fritz 2005). For the tone detection task (Fritz et al. 2003) (Fig. 1(a)), ferrets licked water from a spout while listening to a sequence of broadband spectro-temporally modulated noise (reference) stimuli until they heard a narrowband tone (target), upon which they stopped licking to avoid a mild shock. A trial run consisted of a random-length sequence of reference stimuli followed by the target (or by catch trials with seven reference stimuli and no targets). The reference sound consisted of a broadband noise-like stimulus with a spectro-temporally modulated envelope called a Temporally Orthogonal Ripple Combination, or TORC (Klein et al. 2000). The particular TORC stimulus used in each instance was chosen from a set of 30 different TORCs that were designed to serve during physiological experiments to characterize the spectro-temporal receptive field (STRF) of the cell under study using the reverse-correlation method (Klein et al. 2000). In the tone-in-noise detection task (Fig. 1(b)), the same reference sounds (TORCs) were used. However, the target was a tone embedded in one randomly chosen TORC with varying signal-to-noise ratios ranging from low (difficult; −10dB) to high (easy; +10 dB). The level of the background TORC was constant throughout during the reference and target epochs, and the SNR of the target was adjusted by changing the level of the tone relative to the noise (Atiani et al. 2009). The structure of the multi-tone detection task (Fig. 1(c)) was the same as the tone-detection task, except that a combination of tones was used as the target sound (Fritz et al. 2007).
Fig. 1.
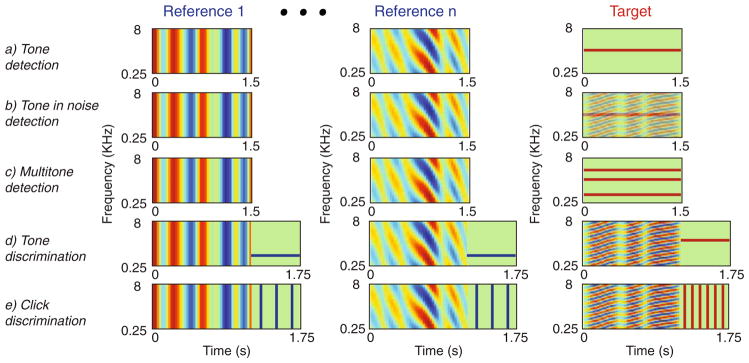
Structure and spectrograms of stimuli in the auditory tasks. Ferrets were trained to discriminate reference from target sounds using a condition avoidance procedure. (a) Tone-detection task: the reference sounds are modulated broadband noise (TORC – see text for details) and the target is a tone at a fixed frequency. (b) Tone-in-noise detection: same as tone-detection task except that the target tone is embedded in a randomly chosen TORC with varying signal to noise ratio. (c) Multitone detection task: same as tone-detection task except that target stimulus is a fixed combination of simultaneous tones; (d) Tone discrimination task: the reference sound is a TORC followed by a tone at a fixed frequency (fR), while the target is a TORC followed by a tone at a different fixed frequency (fT). (e) Click-rate discrimination task: the reference is a TORC followed by a click train at specific temporal rate (ωR), while the target sound is TORC followed by a click train at a different rate (ωT)
The frequency discrimination task (Fig. 1(d)) was similar in basic structure to the tone detection task (Fritz et al. 2005b), except that the key discrimination was between two different pure tones. Here, each reference TORC was followed by a short tone at a specific frequency (fR). The TORC in the target was followed by a different short tone (fT) that was 0.25–2.5 octaves higher or lower depending on the animal training. The last experimental task we modeled was a click-rate discrimination task in which the ferrets discriminated the rate of two click-trains (Fig. 1(d)). Like in the two-tone discrimination task, in the click-rate discrimination task, the reference TORCs were followed by a short click-train at a specific repetition rate (ωR) and the target was a TORC followed by a short click with a different rate (ωT) (Fritz 2005).
2.2 Acoustic stimuli
All sound samples used in the experiments were generated off-line and presented via an equalized earphone inserted in the contralateral ear (Fritz et al. 2005b). Speech stimuli used in the prediction of phoneme discriminations were phonetically transcribed continuous speech from the TIMIT database (Fisher et al. 1986). For the “ripple” discrimination task, multiple upward and downward spectrotemporal ripples (Kowalski et al. 1996) were constructed with random temporal and spectral frequencies and phase but with the same orientation (up) for one class and the opposite orientation (down) for the other class.
2.3 STRF estimation and analysis
The linear spectro-temporal receptive fields (STRF) model has been used to describe the properties of neurons in the auditory (Aertsen et al. 1981; Theunissen et al. 2001) and other sensory modalities (DeAngelis et al. 1995). The STRF is a linear transformation between a time-varying spectrum of a sound and the neural response and is usually measured with spectrotemporally broadband white noise (such as the TORCs) using the reverse-correlation method (Klein et al. 2000). During the experiments, for each suitably isolated unit, we measured the STRF using TORC stimuli while the animal was in a behaviorally passive resting state in which there were no task demands, no water flow in the reward waterspout, and no target or reference tones. Then, a series of STRF measurements ensued while the animal was in an active behavioral state, in which it performed a sequence of discrimination or detection tasks. Additional STRF measurements in the passive state were made between successive auditory task conditions. In tone-discrimination tasks, the reference and target-tone frequencies (fR and fT) were chosen as suitable probes after inspection of the initial passive STRF of the cell and were usually positioned at or near specific excitatory or inhibitory regions of interest in the receptive field (Fritz et al. 2005b). The effect of the behavioral state on the STRF of neurons was estimated by finding the difference between the passive and behavior STRFs (Fig. 2(a)).
Fig. 2.
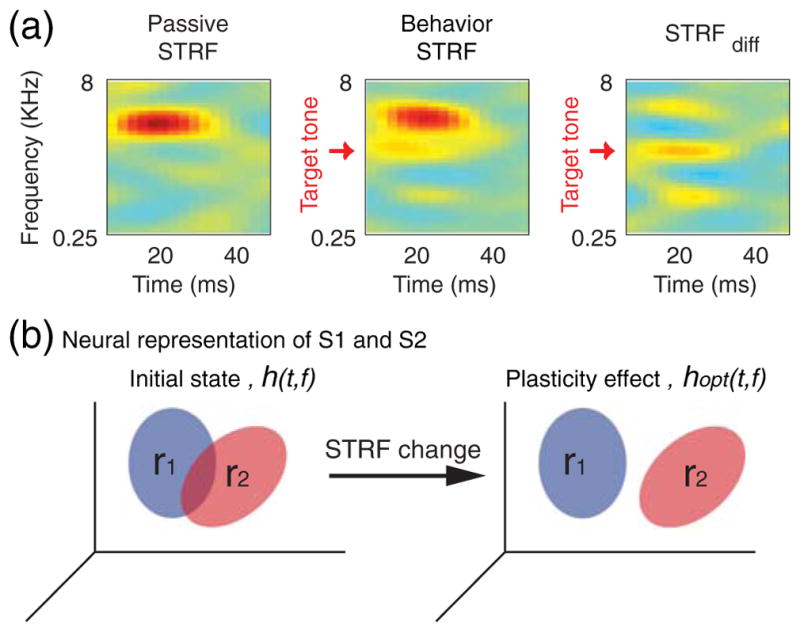
Estimation of STRF change. (a) (Left panel) Spectro-temporal receptive field of a single-unit is estimated during behaviorally passive state. (Middle panel) The STRF is then estimated when the animal performs one of the auditory tasks (tone-detection in this case). (Right panel) STRF change (STRFdiff) is defined as the difference between passive and behavioral STRFs and indicates the effect of the behavioral state on the spectro-temporal tuning of the neuron. All STRFs are measured with the same stimuli, and hence changes reflect only the behavioral state of the animals. (b) (Left) A schematic of a neuron with STRF h(t, f). It transforms the two sounds S1 and S2 to the response space r1 and r2. (Right) An optimal change in the STRF of the neuron (hopt(t,f)) increases the separation between the responses r1 and r2 to the stimuli, thereby facilitating their discrimination
2.4 Predicting the optimal STRF change
The STRF is defined mathematically as a spectro-temporal impulse response, h(t, f) that relates the spectrogram of sound s(t, f), to the neural response r(t):
We consider two classes of sounds in a discrimination task, s1(t, f) and s2(t, f), which we assume to be of equal power, an assumption equivalent to carrying out the discrimination task with roved stimuli (i.e., attending only to the spectro-temporal patterns of s1(t, f) and s2(t, f)). The neural responses corresponding to these stimuli are r1(t) and r2(t):
The neural responses of r1(t) and r2(t) are the representation of the two sounds in the response space. We assume the purpose of rapid STRF plasticity is to increase the distance between theses two representations (Fig. 2(b)). We define the distance between the two responses as the average mean square difference between the responses of two sounds over the duration of the stimuli:
This expression can be simplified (see Appendix) as:
| (1) |
Where Π contains the rows of the STRF:
Ω1,1 and Ω2,2 are the autocorrelation of sound classes S1 and S2 and Ω1,2 is the cross-correlation of S1 and S2:
where Cl,k(i, j) is the cross-correlation between frequency channels i and j of two sound classes of l and k, defined as
and Cl,k(n, i, j) is the lag n correlation between the frequency channels i and j of Sl and Sk defined as:
The optimal STRF (STRFopt) is the Π that maximizes Eq. (1) subject to some constraint.
2.5 Constraints on the STRF change
The distance between the responses of two class of sounds obtained above is a quadratic form which is a convex function and requires a constraint for maximization. Here we describe general temporal, spectral, and energetic constraints that can be applied to the change at each frequency band and time lag of the STRF reflecting the limitation imposed by the finite resources available to a neuron. In general, one way to define the constraint is as:
| (2) |
where Π is the STRF as defined in Eq. (1), A is a diagonal matrix with each point on the diagonal representing the cost of change at the corresponding time and frequency and α is a constant. We used the method of Lagrange multipliers (Arfken 1985) to maximize Eq. (1) under constraint 2:
This results in the generalized-eigenvector problem (Moler and Stewart 1973):
Since A is invertible, this can be written as:
| (3) |
meaning the optimal STRF change under constraint A is the eigenvector of A−1Ω.
3 Results
The theoretical analysis and simulations described here are compared to published population average STRF changes collected from many neurons in each of the spectral detection and discrimination tasks. However, for the click rate discrimination task, only single-unit examples are available at present for comparison. Finally, several more simulations of more complex stimuli are discussed which provide specific predictions that can be tested in future experiments.
3.1 Review of the physiological findings
Figure 3 depicts the average STRF changes observed in four spectral and temporal tasks, some of which already described in details in previous publications as noted below. The first is the tone-detection task (Fig. 3(a),), in which the total change around the target tone (Fritz et al. 2003) is computed by first aligning the difference STRF (STRFdiff in Fig. 2(a)) from all single units recorded, each at the target frequency used during the measurement (indicated by the arrow in Fig. 3(a)), and then taking the average over all STRFdiff’s from all units as illustrated in Fig. 3(a)). The resulting pattern accumulates the changes near the target tone and demonstrates that it induces a positive change in the STRFs at its frequency. A broadly similar pattern of change is seen in Fig. 3(b) where the target tone was replaced by a pattern of three simultaneous octave-separated tones in a multi-tone-detection task (Fritz et al. 2007). In this case, the enhancement of excitability occurs at the three target tones (indicated by the three arrows in Fig. 3(b)) but with added strong suppression induced between them.
Fig. 3.
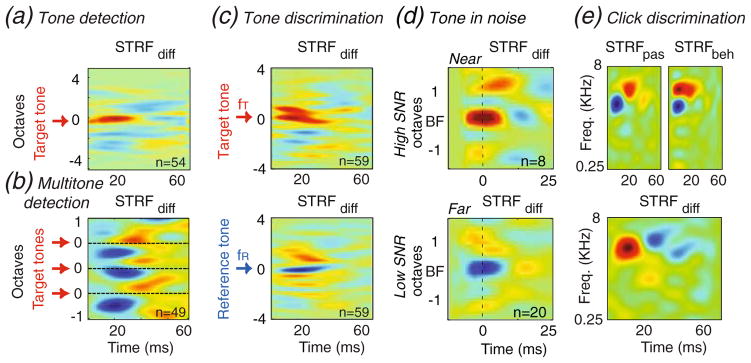
Average experimentally observed STRF changes for various auditory tasks. (a) Tone detection induces an enhancement (excitatory area) of the STRF at the frequency of the target tone. (b) Multi-tone detection task induces an enhancement of responsiveness to all tones while suppressing frequencies in-between. (c) Two-tone discrimination task induces an enhancement at the target tone (top panel) and a suppression at the reference tone (bottom panel). (d) Tone-in-noise task in the high SNR case induces excitatory change in the near target neurons (top-left panel), and little change in far ones (top-right). In the low SNR condition, near target neurons do not show significant change (bottom-left), while the far neurons show a strong suppression (bottom-right). (e) Click-rate discrimination induces STRF changes along the temporal dimension. Example from one unit STRF shows a shortening in the latency of the STRF during the behavior (top-right) compare to the passive state (top-left). The STRF difference (STRFdiff, bottom) acts effectively as a differentiator (highpass filter) in time
Figures 3(c) illustrates results from two-tone discrimination tasks (Fritz et al. 2005b). When STRFdiff are aligned at the target tone fT, the average (top panel of Fig. 3(c),) exhibits the same kind of enhancement seen earlier in the tone-detection task (Fig. 3(a)). When the STRFdiff’s are aligned at the reference tone fR (bottom panel of Fig. 3(c)), the opposite pattern emerges in which the reference tone induces a strong suppression of the STRF near its frequency. In Fig. 3(d), the task is to detect a tone in noise. The plasticity patterns are more complex and depend both on the SNR of the target signal (low or high SNR), and on the best frequency of the STRFs being near or far from the target tone frequency (Atiani et al. 2009). Therefore the alignment of the average STRFdiff’s is performed relative to the units’ BFs rather than relative to the target tone, and the results are organized in four separate averages: high and low SNR targets, and (within each) near and far STRFs. During tasks with high SNR targets, the average STRFdiff for units tuned near the target tones exhibits strong excitatory enhancement similar to that seen in the tone-detection tasks (top left panel of Fig. 3(d)). For far from target STRFs the enhancement is much weaker (top right panel of Fig. 3(d)). For the low SNR condition, the far STRFs (Fig. 3(d), bottom right panel) exhibit strong suppression while those nearby are only weakly suppressed (Fig. 3(d), bottom left panel).
Finally, during a temporal discrimination task such as click-rate discrimination (Fritz 2005), the changes observed occur mostly along the temporal dimension unlike previous cases in which the observed changes were mostly spectral. As an example, Fig. 3(e) illustrates the STRF of a single-unit in the passive state (STRFpas, Fig. 3(e), top left) and during click discrimination task (STRFbeh, Fig. 3(e) top right). The unit exhibited faster dynamics during the task, shifting from a longer initial latency (top left panel) to a shorter latency during the behavior (top right panel), and resulting in the STRFdiff seen in the bottom panel. The functional effect of such an STRFdiff is to act roughly as a derivative in the time-domain, which implies that responses during the task become more high-passed and temporally sharper.
3.2 Simulations of rapid plasticity with simple stimuli
To illustrate how the optimal STRF changes ( ) computed with the model match those of the experimental patterns, we must first impose spectral and temporal constraints on the plasticity allowed, and assume that the power of the two discriminated stimuli are equal, i.e., the loudness of the stimuli is an irrelevant cue to the performance of the tasks (see Section 2).
Figure 4(a) depicts two possible types of constraints that we shall consider (for the constraint matrix A in Section 2). The first choice (Top panel) depicts a purely temporal limitation on the , which intuitively limits the STRF to change over relatively short times, and hence restricts its access to the history of the stimulus exponentially in time (consistent with physiological results of <60 ms seen in Fig. 3). This constraint is particularly useful in the spectral cases (Fig. 3(a–d)) since it allows the STRF to change freely along the frequency axis.
Fig. 4.
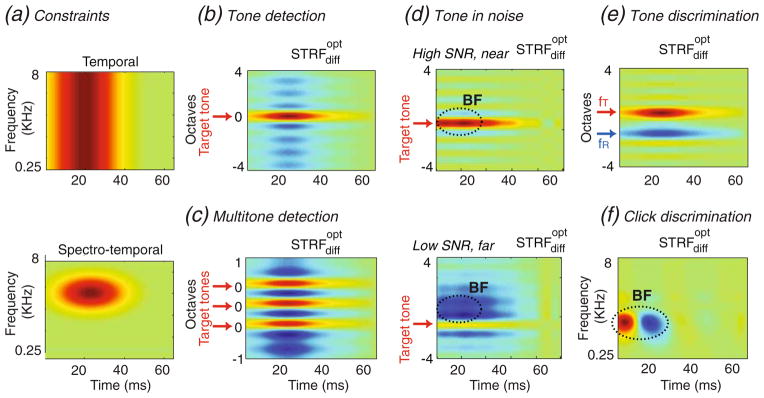
(a) Two possible constrains on the STRF change. (top) A purely temporal constraint: change is more costly as the time-lag increases (bottom) A spectro-temporal constraint on the way an STRF can change: It is more costly as the time-lag increases and for frequencies farther from the best frequency of the neuron (b–f) Predictions of average STRF changes by the computational model for various auditory tasks. Predictions in cases (b–f) match closely the form of the observed STRF changes depicted in Figure 3(a–e)
Using this constraint and the stimuli used in the four spectral tasks, the computed are shown in Fig. 4(b–e). In the tone and multi-tone detection and tone discrimination tasks (Fig. 4(b,c,e)), the target tones induce excitatory changes at their frequency, while the reference tone suppresses the STRF (e.g., Fig. 4(e)). Note also the suppression induced between the tones in the Multi-tone detection task (Fig. 4(c)), which corresponds well to the characteristic features observed in the experimental data (Fig. 3(b)). Intuitively, these results are sensible and arise from the fact that enhancing target sensitivity in the STRF while suppressing that to the reference increases the difference between the responses to the two signals, making them easier to discriminate.
We also simulated successfully the pattern of plasticity seen in the tone-in-noise detection experiments of Fig. 3(d). The results are shown in Fig. 4(d) for the four conditions corresponding to the high and low SNR tasks, and in near and far STRFs within each panel. As in the physiological data, we found that in the high SNR conditions (Fig. 4(d), top panel), the predicted showed a strong excitatory response near the target tone (indicated by the arrow), and only weak effects in STRF locations far from the tone (similar to the observed effect in near and far neurons in Fig. 3(d), Top). In the difficult low SNR task (Fig. 4(d), bottom), the model predicts a much weaker enhancement in STRFs at the best frequencies near the target tone, and stronger suppression at frequencies far from the target (similar to the effect seen in far neurons in Fig. 3(d), bottom right).
The second choice of a constraint is more general in that it is both temporally and spectrally confined as shown in Fig. 4(a), bottom panel. This spectro-temporal constraint implies that the cost of change in the STRF increases with time-lag and distance from the best frequency of the neuron. The result is that most changes in the STRFs occur around the already existing input synapses of the STRF, or equivalently, near the outlines of the STRF, as is mostly the case in experimental data (Fritz et al. 2007). The spectro-temporal constraint in Fig. 4(a) (bottom panel) was used to compute the for the click discrimination task shown in Fig. 4(f). This pattern of change mimics closely that seen earlier in the STRFdiff in Fig. 3(e). When convolved with the spectrogram of a stimulus (as described in Section 2), this acts effectively as a temporal derivative (or a highpass) that responds differentially better to more rapid stimuli such as the target rapid click trains compared to the slower reference clicks.
3.3 Simulations of changes with spectro-temporally complex stimuli
We used the model to predict the for discrimination tasks for which physiological data do not exist yet. Figure 5 depicts the spectrograms (Fig. 5(a)) and predicted (Fig. 5(b)) for discrimination of spectrotemporal ripple orientation. In the ripple discrimination, two categories of spectrotemporal ripples were constructed (Kowalski et al. 1996). The first category consisted of 100 ripples with random temporal and spectral frequencies and phase but all with upward orientation, one of which is illustrated in Fig. 5(a) (left panel). The ripples in the second category had the same range of parameters (temporal and spectral frequencies and phase) but with downward orientation (Fig. 5(a), right panel). Figure 5(b) illustrates the for discrimination of ripple orientation showing a strong preferred orientation.
Fig. 5.
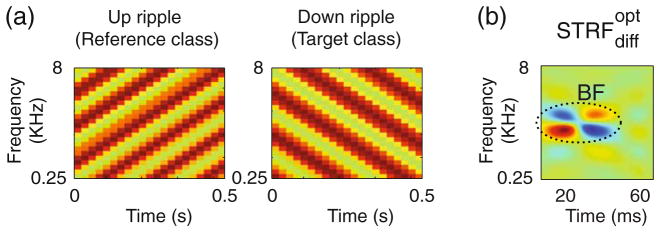
Prediction of the computational model for future experiments with ripples. (a) The ripple spectrograms as reference and target stimuli in a ripple-discrimination task. (b) The STRF changes ( ) predicted for this task
Examples of the for phoneme discriminations are shown in Fig. 6(a–b) for two pairs: fricatives (/s/ vs. /sh/) and vowels /ix/ vs. /ah/. For each pair, the left and middle panels display the average phoneme spectrograms estimated from a minimum of 100 exemplars per phoneme. For the /s, sh/ pair, /s/ is articulated with a more forward place of constriction compared to /sh/, a difference that is reflected by the latter’s lower spectral edge (Ladefoged 2005). The edge position is a key distinguishing feature which is captured by the having a positive (red) weight at the edge location, and a negative (blue) weight for the lower frequencies (Fig. 6(a), top panel), making the adapted STRF more responsive to the /s/ relative to the /sh/.
Fig. 6.
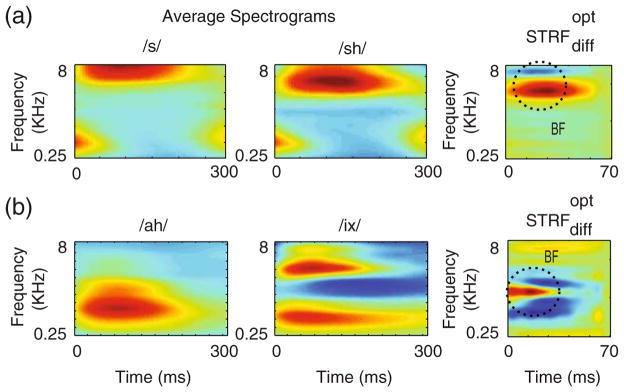
Plasticity with phoneme discriminations. (a) The left and middle panels show the average spectrograms of the two fricatives /s/ and /sh/ to be discriminated. The right panel is the that discriminates them. The reflects the spectral and temporal differences between the representations of two phonemes. (b) Same as in (a) but for the two vowels /ix/ and /ah/ as in “debit” and “but”
The vowel pair, /ix/ and /ah/ differ mostly in their spectral (formant) energy distributions. Thus, /ix/ is a “closed” vowel with two distinct spectral peaks: a low frequency first formant (F1) near ~0.5KHz, and a high second formant (F2) at around 4KHz. By contrast, /ah/ is an “open” vowel with formant frequencies closely spaced in the mid frequency region (near 1 KHz). The optimal STRF adaptation mirrors this spectral distinction between the two formant distributions (Fig. 6(b), bottom panel), with enhancements for the /ix/ formants and suppression at the /ah/ formants.
4 Discussion
Auditory cortical STRFs have been shown to adapt during a variety of behavioral tasks involving discrimination between target and reference stimuli that differ in their spectral or temporal features. It has been hypothesized that STRF changes are optimum in that they maximize the difference between responses to the two stimuli so as to enhance performance. Clearly, as with any optimization criterion, it must be subject to some constraints that reflect the biological and behavioral limitations imposed on the animal and the neurons’ receptive fields. This implies that, depending on the exact choice of the applied constraints, “optimal solutions” can lead to widely varying enhancements of response differences. Nevertheless, what matters is that the adaptive process increases the animal’s ability to perform the task.
The mathematical realization of this idea described here supported this hypothesis in that it predicted the patterns of changes observed in a variety of experiments, especially along the spectral dimension. Specifically, we demonstrated that in tone, tone-in-noise, and multi-tone detection tasks, and in the two-tone discrimination task, the STRF changes computed along the spectral axis reflected the net result of enhancing the target and suppressing the reference spectra, which effectively increased the distance between the two patterns. The tone-in-noise task on the other hand, examined the effect of task difficulty and relative position of the target tone to the initial tuning of neurons on plasticity. The model predicted the same results as the physiological data: the plasticity effect for cells tuned to frequencies near the target tone is bigger when the reference and target are more distinct (high SNR). However in the case of far cells, the plasticity is bigger when the SNR is low. In temporal tasks such as click-rate discrimination, the model explained the changes induced in the dynamics of the STRFs. Finally, we illustrated how the model could be used to predict STRF changes to be tested in future experiments with more complex target and reference stimuli such as phonemes and ripples.
It is important to emphasize the role of the proximity constraints imposed in the optimization procedure in order to limit the STRF changes and give meaningful results. Imposing this “locality” constraint is consistent with findings that STRF changes occur mostly when target and reference stimuli are in the vicinity of the best frequency of the cell (Fritz et al. 2007). More generally, this argument can be also extended to situations where target and reference stimuli differ along more complex feature dimensions (such as frequency sweep direction or the pitch of harmonic complex). In such cases, we predict that changes will occur mostly in STRFs that are proximal along the relevant feature dimensions. However, this brings up certain limitations in our model that have to be rectified in the future. These concern the inability of the model as formulated to predict changes that are more abstract in nature, for example, the task of discriminating between up versus down changes in two-tone sequences regardless of their absolute frequencies (Yin et al. 2007). This task is relatively easy to tackle when all tones are at fixed frequencies. Making them variable, however, means that the model has to be optimized in a frequency invariant domain (e.g., in the magnitude Fourier transform), which complicates considerably the statement of the optimization criterion and its solution (Eqs. (4) in the Appendix). Other limitations include tasks involving higher-order features that transcend the purely spectral and temporal dimensions of the STRF (e.g., pitch and timbre). In all such cases, a possible modification to the model is to include intervening stages that transform the stimuli to new input representations in which the target and reference stimuli are stabilized with respect to the model dimensions, and to replace the STRF with a computational receptive field defined along those new feature dimensions.
The plasticity we emphasized in these simulations has been termed “rapid” in the sense that it occurs as the animals engage in a behavioral task. Clearly, such changes can persist and become “long-term” changes as the animal learns the discriminations, as would happen when humans learn the phonemes of their language. We assume that the predicted STRF changes would become permanent and reflect the dimensions along which these phonemes are most optimally discriminated (presumably to the detriment of discriminations of other “non-native” phonemes). Therefore, when an animal performs in a task with well-practiced stimuli, such changes may not necessarily occur any longer, and only simpler attentional effects might come into play to engage the neurons in the task. In a different scenario, however, this rapid plasticity would continue to be critical for performance when a listener is exposed to noisy or mixed speech, or an unfamiliar dialect, and has to understand and track the speaker. In such a task, we hypothesize that STRFs adapt “on-line” to heighten the necessary distinctions to separate the speakers or to map the unfamiliar phonemes to the more practiced ones.
Finally, we hope that this streamlined model will be significantly elaborated upon once more is known about the feedback circuits that provide information on the meaning of the task stimuli and its rewards and aversive values. Such a model should predict not only the end result of the adapted STRFs, but also the buildup process and its dependence on the specific properties of the STRFs under observation. For such a model to materialize, it is essential that physiological data be collected during task performance from brain regions likely involved in rapid plasticity, including the frontal cortex, sub-cortical nuclei such as nucleus basalis and VTA, as well as the auditory belt areas surrounding the primary auditory cortex.
Acknowledgments
This work was supported by the National Institutes of Health (grants R01DC005779 and F32DC008453).
Appendix I
Derivation of Eq. (1)
| (4) |
Expanding the first term:
| (5) |
Where H and C1 are defined as:
But the Eq. (5) is a quadratic form itself:
Expanding the other two terms of Eq. (4) in the same way, d can be written as:
References
- Aertsen AM, Olders JH, Johannesma PI. Spectro-temporal receptive fields of auditory neurons in the grassfrog. III. Analysis of the stimulus-event relation for natural stimuli. Biological Cybernetics. 1981;39:195–209. doi: 10.1007/BF00342772. [DOI] [PubMed] [Google Scholar]
- Arfken G. Mathematical methods for physicists. Orlando: Academic; 1985. Lagrange multipliers; pp. 945–950. [Google Scholar]
- Atiani S, Elhilali M, David SV, Fritz JB, Shamma SA. Task difficulty and performance induce diverse adaptive patterns in gain and shape of primary auditory cortical receptive fields. Neuron. 2009;61(3):467–480. doi: 10.1016/j.neuron.2008.12.027. [DOI] [PMC free article] [PubMed] [Google Scholar]
- DeAngelis GC, Ohzawa I, Freeman RD. Receptive-field dynamics in the central visual pathways. Trends in Neurosciences. 1995;18:451–458. doi: 10.1016/0166-2236(95)94496-r. [DOI] [PubMed] [Google Scholar]
- Fisher WM, Doddingtion GR, Goudie-Marshall KM. The DARPA speech recognition research database: Specifications and status. Proc DARPA Workshop on Speech Recognition. 1986 Feb;:93–99. [Google Scholar]
- Fritz JB. Do Salient Temporal Cues Play a Role in Dynamic Receptive Field Plasticity in A1? Association for Research in otolaryngology. 2005 Abstract 1323. [Google Scholar]
- Fritz J, Elhilali M, Shamma S. Active listening: task-dependent plasticity of spectrotemporal receptive fields in primary auditory cortex. Hearing Research. 2005a;206:159–176. doi: 10.1016/j.heares.2005.01.015. [DOI] [PubMed] [Google Scholar]
- Fritz JB, Elhilali M, Shamma SA. Differential dynamic plasticity of A1 receptive fields during multiple spectral tasks. Journal of Neurophysiology. 2005b;25:7623–7635. doi: 10.1523/JNEUROSCI.1318-05.2005. [DOI] [PMC free article] [PubMed] [Google Scholar]
- Fritz JB, Elhilali M, Shamma SA. Adaptive changes in cortical receptive fields induced by attention to complex sounds. Journal of Neurophysiology. 2007;98:2337–2346. doi: 10.1152/jn.00552.2007. [DOI] [PubMed] [Google Scholar]
- Fritz J, Shamma S, Elhilali M, Klein D. Rapid task-related plasticity of spectrotemporal receptive fields in primary auditory cortex. Nature Neuroscience. 2003;6:1216–1223. doi: 10.1038/nn1141. [DOI] [PubMed] [Google Scholar]
- Heffner HE, Heffner RS. Conditioned Avoidance. In: Klump GM, Dooling RJ, Fay RR, Stebbins WC, editors. Methods in comparative psychoacoustics. Switzerland: Birkhauser Verlag; 1995. pp. 79–94. [Google Scholar]
- Klein DJ, Depireux DA, Simon JZ, Shamma SA. Robust spectrotemporal reverse correlation for the auditory system: optimizing stimulus design. Journal of Computational Neuroscience. 2000;9:85–111. doi: 10.1023/a:1008990412183. [DOI] [PubMed] [Google Scholar]
- Kowalski N, Depireux DA, Shamma SA. Analysis of dynamic spectra in ferret primary auditory cortex. I. Characteristics of single-unit responses to moving ripple spectra. Journal of Neurophysiology. 1996;76:3503–3523. doi: 10.1152/jn.1996.76.5.3503. [DOI] [PubMed] [Google Scholar]
- Ladefoged P. A course in phonetics. 5. Wadsworth Publishing; 2005. Jun 24, [Google Scholar]
- Moler CB, Stewart GW. An algorithm for generalized matrix eigenvalue problems. SIAM Journal on Numerical Analysis. 1973;10:241–256. [Google Scholar]
- Soto G, Kopell N, Sen K. Network architecture, receptive fields, and neuromodulation: computational and functional implications of cholinergic modulation in primary auditory cortex. Journal of Neurophysiology. 2006;96:2972–2983. doi: 10.1152/jn.00459.2006. [DOI] [PubMed] [Google Scholar]
- Theunissen FE, David SV, Singh NC, Hsu A, Vinje WE, Gallant JL. Estimating spatio-temporal receptive fields of auditory and visual neurons from their responses to natural stimuli. Network. 2001;12:289–316. [PubMed] [Google Scholar]
- Yin P, Fritz JB, Shamma SA. Association for research in otolaryngology. Denver: 2007. Can ferrets perceive relative pitch? Abstract 843. [Google Scholar]


