

Abstract
Besides its cooperating effects on stem cell proliferation and survival, Kit ligand (KL) is a potent chemotactic protein. While transwell assays permit studies of the frequency of migrating cells, the lack of direct visualization precludes dynamic chemotaxis studies. In response, we utilize microfluidic chambers that enable direct observation of murine bone marrow-derived mast cells (BMMC) within stable KL gradients. Using this system, individual Kit+ BMMC were quantitatively analyzed for migration speed and directionality during KL-induced chemotaxis. Our results indicated a minimum activating threshold of ~3 ng ml−1 for chemoattraction. Analysis of cells at KL concentrations below 3 ng ml−1 revealed a paradoxical chemorepulsion, which has not been described previously. Unlike chemoattraction, which occurred continuously after an initial time lag, chemorepulsion occurred only during the first 90 minutes of observation. Both chemoattraction and chemorepulsion required the action of G-protein coupled receptors (GPCR), as treatment with pertussis toxin abrogated directed migration. These results differ from previous studies of GPCR-mediated chemotaxis, where chemorepulsion occurred at high ligand concentrations. These data indicate that Kit-mediated chemotaxis is more complex than previously understood, with the involvement of GPCRs in addition to the Kit receptor tyrosine kinase and the presence of both chemoattractive and chemorepellent phases.
Introduction
Mast cells are important effectors of inflammation, releasing mediators involved in the response to bacterial and helminthic infection, as well as in allergic disease.1–3 Mast cell progenitors are derived from hematopoietic stem cells (HSC) and circulate in the peripheral blood before entry into tissues and differentiation to form tissue-specific mast cell populations.4 The development of mast cells from progenitors is dependent on proliferative and anti-apoptotic signals mediated by the c-kit receptor (Kit) and Kit ligand (KL, aka stem cell factor, SCF).5–7 Two major subsets of mast cells, connective tissue and mucosal, have been described with different functional capacities. Connective tissue mast cells in the skin, peritoneum, and perivascular areas have granules containing tryptase and chymase, while mucosal mast cells in the lungs and intestine express tryptase but not chymase.8 Although they are tissue resident, mature mast cells undergo migratory redistribution in response to various stimuli. For example, parasitic infection in mice causes jejunal mast cells to migrate from the submucosa or crypt areas to the lamina propria and intraepithelial regions.9 Mast cells are responsive to multiple chemotactic stimuli, including KL, IgE and IgE-antigen complexes through the FcεRI, CC, CXC, C, and CX3C chemokines, and non-protein mediators such as sphingosine-1-phosphate, eicosanoids, and adenosine.10 In addition to its known role in mast cell chemotaxis, Kit signaling also results in synergistic activation of FcεRI, resulting in greater degranulation and cytokine release.11 Thus, Kit signaling has critical roles in both the development of mast cell progenitors and the functions of mature mast cells, including chemotaxis and activation.
Kit is a type III receptor tyrosine kinase that is expressed by mast cells at high levels and is also expressed at different levels by a variety of hematopoietic stem and progenitor cell populations, including hematopoietic stem cells, erythroid and myeloid progenitors, lymphoid progenitors and thymocytes. In addition, Kit is expressed in non-hematopoietic lineages, notably embryonic stem cells, germ cells, neural and cardiac progenitors, and interstitial cells of Cajal.12–15 Kit signaling is critical for the development and maintenance of such populations. Mice mutated for Kit have the dominant White spotting defect (W), while those mutated for KL have the phenotypically similar Steel (Sl) defect.16 Both are marked by abnormal melanocyte development and migration, resulting in hypopigmentation, varying degrees of HSC and hematopoietic defects, and impaired fertility.
Studies of chemotaxis in mast cells have been performed with a variety of methods, including transwell assays and measurements of chemotaxis in cells covered by a semisolid medium.17,18 These assays measure net movement of populations of cells and are limited by the lack of direct observation of individual cell behavior and by lack of a stable chemokine gradient. A common challenge in the interpretation of data from these experiments is the confounding effects of chemokinesis (an increase in random motility) and chemotaxis (an increase in directional migration).19 To address these limitations, we directly observed and quantified the chemotactic behavior of individual murine bone marrow-derived mast cells (BMMC) in microfluidic chambers containing stable KL gradients. The results revealed previously undescribed complexities in the mast cell response to KL, namely a concentration- and temporal-dependent bimodal movement. KL concentrations greater than a threshold value of ~3 ng ml−1 resulted in chemoattraction following a concentration-dependent lag time. Unexpectedly, concentrations less than 3 ng ml−1 caused transient mast cell chemorepulsion, i.e. movement away from the KL source, followed by a period of random motility. Both the chemoattractive and chemorepulsive behaviors were found to require the activity of WASP, a regulator of cytoskeletal structure that is a phosphorylation target of activated Kit, as well as G-protein coupled receptors (GPCR). While GPCR are well known chemotactic receptors, they have not been previously implicated in KL-mediated chemotaxis and have not been reported to induce transient chemorepulsion at low chemokine concentrations.
Materials and methods
BMMC culture and preparation
Murine BMMC cultures were established as previously described.20 Bone marrow cells from 4–8 week old C57BL6/J and WASP(−/−) mice21 were cultured for 4–6 weeks in BMMC medium with 20% Fetal Calf Serum (FCS) in the presence of murine IL-3 and KL (20 ng ml−1 each; BioSource International). BMMC medium consisted of RPMI-1640 (Gibco), 1 mM sodium pyruvate (Gibco), 0.1 mM nonessential amino acids (Gibco), and 50 μM β-mercaptoethanol (Thermo Fisher Scientific). Cells were factor deprived for 12 hours prior to chemotaxis assays. For pertussis toxin experiments, 100 ng ml−1 of pertussis toxin (Sigma Aldrich) was added to the factor-depleted medium. After 12 hours of exposure, cells were rinsed in BMMC medium prior to chemotaxis assays. All animal work performed are approved by the Administrative Panel on Laboratory Animal Care (APLAC) at Stanford University.
Transwell assay
Transwell migration assays were conducted using 5 μm pore size Transwell devices (Corning, NY). Various concentrations (0, 1, 2, 4, 8, 10, 20, 30, 100 ng ml−1) of recombinant mouse KL were placed into the bottom chamber of the Transwell device, and 2.5 × 10⁵ BMMC in 100 μL medium were placed in the top chamber. After 3 hours of incubation at 37 °C, cells were collected from the bottom chamber and counted using a hemocytometer. Three independent trials using BMMC from three mice were performed.
Microfluidic device fabrication
Devices were designed using AutoCAD software and fabricated from polydimethylsiloxane (PDMS) using standard soft lithography methods.22 The microfluidic device consists of a central cell chamber that extends 4.0 mm in length, 1.0 mm across, and 100 μm in depth. The cell chamber is flanked by two rows of micro-capillaries that are 14 μm wide, 260 μm long, and 7 μm deep and are spaced 16 μm apart. These capillaries connect the cell chamber and the two outer “source” and “sink” channels, enabling Fickian diffusion to occur throughout the device while preventing convective fluid flow into the cell chamber.23–26 The Stanford Microfluidics Foundry fabricated a 4 inch silicon mold with positive relief features using negative photoresist (SU-8) and ultraviolet light exposure through a Mylar transparency mask. After coating with chlorotrimethylsiloxane (Sigma), a 1 : 10 mixture of silicone elastomer curing agent and base (Dow Corning Sylgard© 182, Midland, MI) was poured evenly across the silicon mold. The hardened PDMS devices were removed from the mold, and inlets and outlets were punched using a 20 gauge needle. Finally, the devices were irreversibly bound to glass substrates by exposing both surfaces to oxygen plasma before placing the device onto the substrate with gentle pressure.
Microfluidic chemotaxis assays
Two devices were mounted onto a single well within a six-well plate. Devices were washed with 70% ethanol, rinsed using Dulbecco’s Phosphate-Buffered Saline (DPBS), and coated overnight with a 25 ng ml−1 solution of bovine fibronectin. BMMCs were loaded into the cell chamber at a concentration of 1 × 10⁷ cells per ml and allowed to adhere for 30 minutes at 37 °C and 5.0% CO2. Cells that failed to adhere were washed away using migration medium (BMMC medium with 2% FCS and no KL or IL-3) and the cell chamber inlets were plugged to prevent flow in the cell chamber. Migration medium alone was introduced into the sink channel, while migration medium plus 5 μM FITC-dextran (20 kD, Sigma) and 20 ng ml−1 murine KL was introduced into the source channel via tubing connected to 100 μl Hamilton syringes. The source and sink solutions were introduced into the device at a flow rate of 0.6 ml h−1 using a syringe pump. After 1 hour, stable gradient formation was confirmed by fluorescence imaging of the FITC-dextran marker. This is defined as time = 0 for chemotaxis analysis, and the initial positions of all cells were recorded using phase contrast imaging. Following this, time-lapse images were collected every 2 minutes over a period of 3 hours using an inverted confocal microscope (Zeiss LSM510 Meta) with an environmental control chamber operating at 37 °C and 5% CO2. Control experiments omitted KL from the sink channel and were run in parallel with all test conditions. Three independent trials were performed for each condition, and approximately 120 cell tracks were recorded per trial.
Image analysis and quantification
To determine the KL concentration, Image J (NIH freeware) was used to measure the fluorescence intensity of the FITC-dextran tracer molecule, and the ratio of the intensity at each position in the cell chamber to the source channel was multiplied by the known initial concentration. Control experiments confirmed that the fluorescence intensity was linearly related to FITC-dextran concentration across the entire concentration range used. Each phase contrast image of the cell chamber was divided into quadrants along the length of the gradient such that quadrants 1 to 4 represent high to low KL concentrations, respectively. Thirty randomly selected cells from each quadrant were tracked manually using MTrackJ, an Image J plug-in. Cell quadrants were determined according to the starting position of the cell; thus, a cell that started in quadrant 1 would still be included in the data for quadrant 1 even if it traveled into quadrant 2 during the analysis. Cell tracks were analyzed for average speed and chemotactic index. The chemotactic index was defined as the distance the cell migrated in the direction parallel to the gradient divided by the accumulated distance the cell traveled. Therefore, perfectly random migration will have a chemotactic index of 0, perfect chemo-attraction (i.e., migration in a straight line towards higher concentrations) will have a chemotactic index of 1, and perfect chemorepulsion (i.e., migration in a straight line towards lower concentrations) will have a chemotactic index of −1. Speed was defined as the accumulated distance the cell traveled over time. Compass plots of cell tracks (with all track starting points superimposed on the origin) were created with the Chemotaxis Tool Image J plug-in (Ibidi, Martinsried, Germany).
Results
Threshold and range of chemotactic KL concentrations
To determine the range of KL concentrations to test in the micro-fluidic chambers, standard transwell assays were used to establish the dose–response relationships in BMMC (Fig. 1). A range of KL concentrations from 0–100 ng ml−1 was tested. There was a concentration-dependent increase in chemotaxis until maximal chemotaxis was observed at KL 8–10 ng ml−1. A decrease in chemotaxis was observed at higher concentrations. As a negative control, BMMC derived from mice deficient for WASP were simultaneously tested. WASP, the gene which is mutated in Wiskott–Aldrich syndrome, is downstream of Kit signaling, regulates cytoskeletal rearrangements, and is necessary for blood cell chemotaxis.20 In WASP-negative BMMC, there was significantly less chemotaxis than in wild-type cells (10–20% of wild-type, data not shown). As for normal BMMC, maximal chemotaxis was observed at 10 ng ml−1.
Fig. 1.
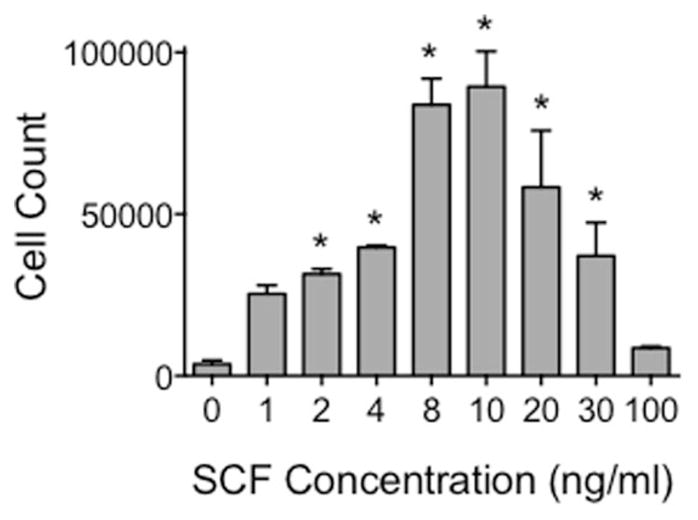
Maximal mast cell chemotaxis in transwells occurs at 8–10 ng ml−1. Transwell assays were employed to determine the optimal KL concentration for induction of mast cell chemotaxis. Cells were subjected to a concentration range between 0–100 ng ml−1 KL, and cells that migrated towards the source of KL were quantified using a hemocytometer. Error bars indicate standard deviation from the mean; n = 3; * indicates statistical significance compared to 0 ng ml−1 KL, p < 0.05.
Chemotaxis in microfluidic chambers
Based on the transwell results, BMMC chemotaxis was assessed in microfluidic chambers that generated a range of KL concentrations from 0 to 12 ng ml−1. The capillaries create a diffusion-enabled gradient across the chamber as the ligand moves from a source channel, which delivers KL, across the chamber to a sink channel, which contains medium alone and removes KL (Fig. 2A). To determine the cellular responses to different average concentrations of KL, images of the chambers were divided into quadrants prior to analyzing cell migration (Fig. 2B and C). The same syringe pump simultaneously drove flow into the KL gradient device as well as flow into a control device containing media alone in both the source and sink channels. With equal flow rates of the source and sink channels, no shear forces are generated within the cell chambers,24 which was confirmed by the random movement of cells observed in the control chambers (Fig. 3A).
Fig. 2.
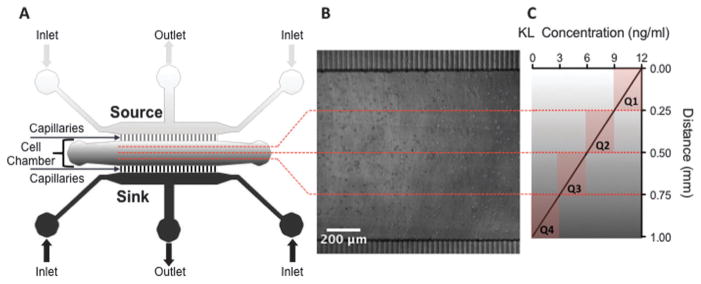
Schematic of microfluidic device designed to administer a stable linear KL gradient. (A) Stable linear gradients of KL were created within devices by delivering KL containing medium through a source channel to a cell chamber containing the BMMC, while an opposite sink channel delivered medium without KL. (B) Phase contrast image of BMMCs loaded into the cell chamber. (C) Following chemotaxis assays, images of the cell chamber were partitioned into quadrants for migration analysis. Individual cell tracks were grouped into one of the quadrants based on their initial position. Quadrant 1 (Q1) represents cells that began at the highest KL concentration (9–12 ng ml−1), followed by quadrants 2 (Q2, 6–9 ng ml−1) and 3 (Q3, 3–6 ng ml−1). Quadrant 4 (Q4) represents cells that began at the lowest KL concentration (0–3 ng ml−1). Fluorescent images of the distribution of a FITC-dextran tracer molecule were used to determine the average concentrations in each quadrant.
Fig. 3.
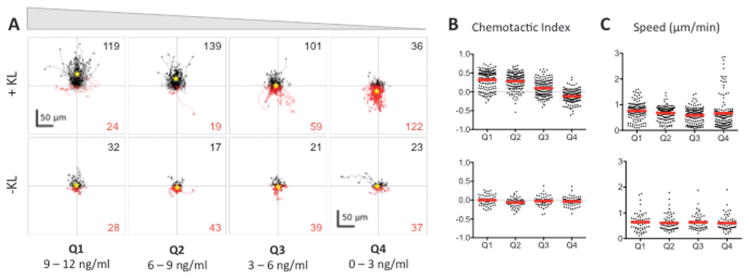
BMMC cells exhibit a bimodal chemotactic response to Kit ligand (KL) gradients. (A) The tracks of individual BMMC with initial positions located in Q1–Q4 in the presence (+KL) or absence (−KL) of a KL gradient. Individual cell tracks were plotted with the starting position of each cell at the graph origin. Cell tracks that possessed a positive net displacement towards the source channel are plotted in black, while absolute movement away from the source are in red. The total number of observed cells with net movement towards or away from the source is given in black and red fonts, respectively. A yellow star indicates the center of mass of all tracks. (B) Chemotactic indices of each individual cell (black dots) and population averages (red line) for cells in Q1–Q4 with (top) or without (bottom) exposure to a KL gradient. (C) Individual cell speeds (black dots) and population averages (red line) for each condition. Three individual trials were run; n ≥ 143 cells for each +KL quadrant, and n ≥ 60 for each −KL quadrant.
To measure chemotaxis in response to KL, BMMC were randomly distributed in a fibronectin-coated microfluidic chamber and then placed in an incubator at 37 °C and 5.0% CO2 for approximately 30 minutes to allow cells to adhere before initiating flow in the source and sink channels to generate the KL gradient. A stable KL gradient was established within one hour and was confirmed by fluorescence imaging of a FITC-dextran tracer molecule (Fig. S1, ESI†). After gradient verification and quantification, the initial cell positions were recorded using phase contrast microscopy (designated as time = 0) and further monitored every 2 minutes for the duration of the experiment. As previously confirmed by fluorescence imaging of tracer molecules, the concentration gradient within the cell chamber remains constant once it has reached equilibrium.24,27
Bimodal chemotactic response of BMMC to KL
To analyze the dose–response relationship between chemotaxis and KL concentration, the cells were divided into quadrants according to the KL concentration they were initially located in, e.g., for a gradient of 0–12 ng ml−1, quadrant 1 (Q1) contained cells initially in a KL gradient of 9–12 ng ml−1, Q2 contained those at 6–9 ng ml−1, Q3 contained those at 3–6 ng ml−1, and Q4 contained those at 0–3 ng ml−1. The dose–response analyses showed that there were two distinct chemotactic patterns of KL-induced chemotaxis, which were concentration dependent. At KL concentrations greater than 3 ng ml−1 (Q1–Q3) cells moved towards the source channel in a dose dependent manner (Fig. 3A). Within these quadrants, the chemotactic index, i.e., directionality of migration, was related to the KL concentration, while speed of cell migration was not significantly affected (Fig. 3B and C). Unexpectedly, cells initially in the lowest KL concentrations of 0–3 ng ml−1 (Q4) underwent chemorepulsion away from the KL source channel (Fig. 3A). Accordingly, the average chemotactic index for Q4 was negative, indicating chemorepulsion at low KL concentrations (Fig. 3B). The average cell speed in Q4 was similar to that in other quadrants, although the population distribution was altered (Fig. 3C). The control chambers lacking KL showed neither forward nor reverse movements (Fig. 3A–C), indicating that there were no shear or other mechanical forces causing the observed movement in the KL chambers. Thus, the microfluidic chambers revealed a chemorepulsive response at low concentrations of KL, which has not been described previously.
Different durations of Kit mediated chemoattraction and chemorepulsion
We analyzed cell movements of BMMC at multiple time points from 0–150 minutes in each quadrant of KL concentration to determine if chemoattraction and chemorepulsion were equally persistent (Fig. 4A). Within Q1–Q3, after a lag phase of random migration, Kit-mediated chemoattraction persisted over the entire period of observation a total of 150 min. The duration of the lag phase appeared to be KL concentration dependent, with random migration taking place for 30 min in Q1, 60 min in Q2, and 90 min in Q3 as evidenced by both the individual cell tracks (Fig. 4A) and the population averaged chemotactic index (Fig. 4B). In contrast, cells in the lowest quadrant of KL concentration experienced no lag phase and displayed chemorepulsion at the earliest time points. This chemorepulsion persisted for a limited period of time, 90 min, after which further migration exhibited random directionality (Fig. 4). Consequently, the net movement of cells away from the source channel only increased for the first 90 minutes, after which minimal chemorepulsive movement was observed. The cells in control wells lacking a KL gradient underwent no directional chemotaxis during the entire 120 minute observation (Fig. 5). Thus, the time-dependence of Kit-mediated chemo-attraction and chemorepulsion differed.
Fig. 4.

Kit-mediated BMMC chemoattraction and chemorepulsion is dependent on both time and average KL concentration. (A) Time dependence of mast cell chemotaxis in the presence of a KL gradient was evaluated by analyzing cell migration over discrete 30 min time intervals. Thus, the first row displays the individual cell tracks, chemotactic indices, and cell speeds during the first 30 min, and the second row shows data for the next 30 min, etc. Individual cell tracks are presented as in Fig. 3. During the first 30 minutes, chemorepulsion is observed in Q4 and Q1–Q3 exhibit random migration. Conversely, chemoattraction is observed in Q1–Q3, while Q4 exhibits random migration during the last 30 min interval (120–150 min). (B) The chemotactic index of BMMC in each quadrant of the KL gradient is plotted with respect to time. An initial lag time was observed before the onset of chemoattraction in Q1–Q3. The length of the lag time was related to KL concentration, with higher concentrations (e.g., Q1) resulting in shorter lag times. Once chemoattraction was initiated, it persisted for the remaining duration of the 150 min experiment. Conversely in Q4, no lag time was detected, and transient chemorepulsion was observed from 0–90 min before the onset of random migration.
Fig. 5.

BMMCs do not exhibit chemoattraction or chemorepulsion in the absence of a KL gradient. Individual cell tracks, chemotactic indices, and cell speeds for BMMCs cultured in control devices with no KL gradient and observed in parallel with devices from Fig. 4. The BMMCs exhibited random non-biased migration regardless of time or position within the devices.
Dependence of chemoattraction and chemorepulsion on WASP signaling
We have previously demonstrated that WASP, a regulator of cytoskeletal structure, is a phosphorylation target of activated Kit and is essential for Kit-mediated cytoskeletal changes, Ca++ flux, and gene expression.20 Therefore, we investigated whether WASP was also necessary for both Kit-mediated chemoattraction and chemorepulsion. Observation of WASP-deficient BMMCs exposed to a KL gradient revealed that WASP-deficient cells exhibited migration that was statistically random, with chemotactic index averages close to zero (Fig. 6A). The lack of a both chemoattraction and chemorepulsion in WASP-deficient cells was similar to that observed for WT cells in the absence of KL gradient. Thus, it can be concluded that the bimodal chemotactic behavior of BMMCs, i.e., both chemoattraction and chemorepulsion, involves active processes that are dependent upon Kit-WASP signaling for cytoskeletal changes and consequent migration. To further probe the mechanism behind Kit-mediated chemotaxis, we also studied the behavior of WT BMMCs treated with pertussis toxin (PTx) in the presence of a KL gradient. Previous studies have shown that PTx can block chemotaxis through the inhibition of G-protein coupled receptors (GPCR), which would normally interact with the chemokines driving directed migration.28 PTx inhibited Kit-mediated chemotaxis of WT BMMCs in the presence of a KL gradient, and cells exhibited non-directional, random movement similar to that observed with control, WT BMMCs in absence of KL gradient, and WASP-deficient experiments (Fig. 6B). These results indicate that Kit-mediated chemotaxis is dependent upon GPCRs, which has not been reported previously.
Fig. 6.

Kit-mediated chemotaxis is inhibited by loss of WASP signaling or treatment with pertussis toxin. (A) Individual cell tracks, chemotactic indices, and cell speeds presented as in Fig. 3 for BMMC isolated from WASP−/ − mice (top panel, n ≥ 60 for each quadrant) and (B) BMMC treated with pertussis toxin (PTx, bottom panel, n ≥ 100 for each quadrant) and exposed to a KL gradient. Both groups of cells exhibited random motility at all KL concentrations.
The presence of KL induces the formation of filopodia in wild-type BMMCs (Fig. 7). However, loss of WASP signaling inhibits filopodia formation (Fig. 7C).
Fig. 7.

Filopodia formation is induced by the presence of KL and inhibited by loss of WASP signaling. (A) Phalloidin-stained wild-type BMMCs in the absence of KL exhibit a rounded morphology and lack filopodia. (B) Wild-type BMMCs in the presence of KL exhibit active spreading and filopodia formation in all quadrants. White arrows indicate filopodia. (C) BMMC isolated from WASP−/ − mice lack the ability to form filopodia in the presence of KL.
Discussion
Our results reveal that Kit signaling generates a uniquely complex chemotactic response featuring both dose-dependent chemoattraction and chemorepulsion. Previous experiments using conventional transwell assays permitted observations of the chemoattractive response to Kit signaling, similar to those shown in Fig. 1, but they were not able to capture the chemo-repulsive response. The use of a microfluidic device, which allowed direct surveillance of individual cell movements within a stable KL gradient ranging in concentration from 0–12 ng ml−1, allowed observation of a previously unseen chemorepulsion at KL concentrations less than 3 ng ml−1. As shown by its abrogation in WASP-negative cells, the observed chemorepulsion was an active process, dependent upon the rearrangement of the actin cytoskeleton. The limited duration of Kit mediated chemo-repulsion may be due either to an intrinsic signal refractory period after low dose stimulation or to the cumulative effect of chemorepulsion moving the cells to regions of the chamber where the KL concentration was below a minimal threshold for any chemotaxis, either forward or backwards.
Previous studies of chemokine-induced chemotaxis have demonstrated both chemoattraction and chemorepulsion, but the dose–response in these cases is the converse of what we observed with Kit-mediated chemotaxis. Poznansky, et al.28 reported induction of chemorepulsion of CXCR4(+) cells, e.g., T lymphocytes, at high concentrations and chemoattraction at low concentrations of SDF1/CXCL12. Other chemorepulsive effects that depend upon a high concentration of ligand have been shown for chemokine/receptor pairs CXCR2/IL-8 (CXCL8), CXCL9/CXCR3, and CXCL10/CXCR3.29 It has been proposed that these chemorepulsive movements could impact how the responsive cells distribute themselves in relation to the ligand source; in other words, these chemorepulsive signals could help to pattern cell localization in vivo. One effect of these chemorepulsive movements is that areas of high ligand concentration may be depleted of cells expressing the cognate receptor. For example, melanoma cells that overexpress SDF1/CXCL12 escape from immune control by repulsion of tumor-specific T lymphocytes.30 Similarly, chemorepulsion induced by high levels of intrathymic SDF1 contribute to the emigration of thymocytes from the fetal thymus.30,31 Our results indicate that a converse process occurs during Kit-mediated signaling in mast cells, i.e., low levels of KL induce chemorepulsion. Such a process could be important for regulating the distribution of mast cells in the tissue such that they are more likely to be recruited to areas of high KL concentration and less likely to be present in areas of low KL expression. Thus, chemorepulsion of mast cells from areas of low KL expression may have anti-inflammatory effects. Xenotransplantation experiments have shown that both mucosal and connective tissue mast cells are derived from transplanted HSC, but with different kinetics of reconstitution and distribution in different tissues and anatomical regions.32 The bimodal response to KL signal intensity might be a mechanism to explain such differences: tissues expressing low level Kit ligand may actively repel mast cell progenitors.
In addition to the KL gradient concentration profile, the intensity of Kit signaling might also be modulated by receptor density. For example, Kit expression in BMMC is uniformly high,20 but much greater variation is observed among hematopoietic progenitors.33 Experiments with other Kit-expressing cell types will be important in determining whether the bimodal chemoattractive and chemorepellent responses observed in BMMC are generalizable and how KL concentration affects cells with differing receptor density.
The mechanisms by which different concentrations of chemotactic molecules can result in differential chemoattractive and repulsive signals are not well understood. In SDF1-mediated axonal guidance, the direction of axonal outgrowth is controlled by differential contributions of secondary signals downstream of phospholipase C (PLC).34 Activation of protein kinase C (PKC) results in repulsion of the axonal growth cone, while activation of the inositol triphosphate (InsP3) receptor (InsP3R) resulted in attractive turning. In neutrophils, the balance of levels of InsP3 generated by phosphoinositol-3 kinase (PI3K) vs. phosphatidic acid generated by catalysis of InsP3 by phospholipase D (PLD), controls the direction of neutrophil signaling in response to bacterial chemoattractants.35 PLC-gamma and PLD are prominent targets of Kit signaling, and both PKC activation and InsP3 generation are known to occur after Kit stimulation.13,36,37 The mechanism, by which the intensity of Kit signals could cause differential levels of activation of PKC, PLC-gamma, or PLD, is not known. We have previously described topological changes in the distribution of Kit, the PI3K p85 regulatory subunit, and the phosphatase and tensin homologue (PTEN) after Kit stimulation.38 These experiments were performed with cells suspended in high concentrations of KL, which were chosen to maximize Kit responses. Lower intensity of Kit signaling, e.g., those occurring at the chemorepulsive concentrations described in this paper, may alter the relative activation of PI3K, PTEN, PKC, PLC-gamma or PLD, and thereby alter the balance of phospholipids that regulate the direction of chemotaxis.
In addition to the discovery of dose-dependent chemoattraction and chemorepulsion, we have also established that both chemorepulsion and chemoattraction depend on activation of a heterotrimeric G-protein dependent pathway, since pre-treating cells with PTx blocked any directed migration. Although previous studies of Kit-mediated chemotaxis have shown dependence on Fyn phosphorylation, PTEN, and Jak-Stat signaling,10 they have never before shown dependence on a G-protein. Activation of a G-protein might occur directly downstream of either Kit tyrosine kinase activity or via a secondary mediator, such as Src or Jak-Stat proteins. Previous evidence has shown that cross-receptor interactions between Kit and type I cytokine receptors, e.g., the Epo or interleukin-7 receptors (EpoR, IL-7R) are essential downstream effectors of Kit signaling;39,40 the type I cytokine receptor is tyrosine phosphorylated and activated by Kit in these interactions. For example, Kit-mediated support of erythroid differentiation is dependent on the expression of the Epo receptor. An alternative mechanism for the dependence of Kit chemotaxis on a G-protein pathway could be analogous cross-receptor interaction of Kit with a chemokine receptor, which in turn acts as a guanine exchange factor for a heterotrimeric G-protein. Such a mechanism would be the converse of a previously described interaction in which a leukotriene receptor activates Kit.41
The studies described here emphasize the importance of direct observation at the cellular level for cells undergoing chemotaxis within a chemical gradient. Standard transwell assays, e.g., those shown in Fig. 1, and similar assays that are based on counting the total number of cells that have reached a designated target produce a binary output, i.e. either the cells have moved to the target or they have not. These assays do not provide sufficient information to detect complex chemotactic responses, such as those described here. In a transwell assay the chemo-repelled cells at the lower ligand concentrations would have simply been scored as unresponsive to the chemo-attractant. In contrast, the microfluidic device described for these experiments provides a trove of information including migration speed, directionality, and persistence of individual cells over a range of concentrations as a function of time. In addition, the microfluidic device can maintain a stable linear chemical gradient for long periods of time (well over 12 hours),27 contrary to transwell assays, which create a time-dependent gradient. This enables exact specification and quantification of the chemokine gradient profile to identify concentration-dependent effects. The ability to directly observe cells over time in these microfluidic devices will prove an invaluable asset to the discovery and deconstruction of these complex chemotactic responses of BMMC and other Kit+ cell types, e.g. hematopoietic progenitor cells.
Conclusion
In conclusion, the microfluidic chambers used for these experiments allowed single-cell analysis of cell migration in response to a KL gradient. These experiments lead to the discovery of a complex chemotactic response that involves both chemoattraction and chemorepulsion. The novelty of the response observed lies in both its dose response, that chemorepulsion occurs at low KL concentrations and attraction at high concentrations, as well as its dependence on G-proteins, which had not been previously reported in Kit signaling. These observations would not have been possible using traditional chemotaxis assays, such as transwells, indicating the need for single-cell analysis techniques to study the complexities of cell migration.
Supplementary Material
Insight, innovation, integration.
We present a microfluidic device that enabled us to perform a single-cell analysis of the chemotactic response of bone-marrow derived mast cells (BMMCs) to a linear gradient of Kit ligand (KL). This technological innovation led us to the discovery of a complex time-dependent chemotactic response that involves chemoattraction at high concentrations of KL and chemorepulsion at low concentrations, which may help explain how mast cells pattern themselves within the body during maturation. Further experimentation using pertussis toxin revealed that the response observed must involve the tyrosine kinase receptor, c-kit, as well as a G-protein-couple receptor. These biological insights would not have been possible without integrating a microfluidic device engineered by a materials science lab and techniques developed in a hematology lab.
Acknowledgments
Supported by NIH grant CA049605 (KW), the Lucile Packard Foundation for Children’s Health (KW), and NIH grant DP2-OD006477-01 (SH). The early, consistent support of Benja-min and Patty Anixter, and Stephen and the late Harriet Zelencik is gratefully acknowledged. M. Manchandia was a recipient of a Stanford Undergraduate Advising and Research grant. CN was a Rose Hills Researcher of the Office of the Vice Provost of Undergraduate Education at Stanford University. MF was a recipient of the Diversifying Academia, Recruiting Excellence fellowship from the Office of the Vice Provost of Graduate Education at Stanford University and the National Science Foundation Graduate Research Fellowship.
Footnotes
Electronic supplementary information (ESI) available. See DOI: 10.1039/c3ib40025e
References
- 1.Malaviya R, Abraham SN. Immunol Rev. 2001;179:16–24. doi: 10.1034/j.1600-065x.2001.790102.x. [DOI] [PubMed] [Google Scholar]
- 2.Shelburne CP, Abraham SN. Adv Exp Med Biol. 2011;716:162–185. doi: 10.1007/978-1-4419-9533-9_10. [DOI] [PubMed] [Google Scholar]
- 3.Echtenacher B, Männel DN, Hültner L. Nature. 1996;381:75–77. doi: 10.1038/381075a0. [DOI] [PubMed] [Google Scholar]
- 4.Hu ZQ, Zhao WH, Shimamura T. Curr Med Chem. 2007;14:3044–3050. doi: 10.2174/092986707782793998. [DOI] [PubMed] [Google Scholar]
- 5.Galli SJ, Tsai M, Wershil BK, Tam SY, Costa JJ. Int Arch Allergy Immunol. 1995;107:51–53. doi: 10.1159/000236928. [DOI] [PubMed] [Google Scholar]
- 6.Mekori YA, Oh CK, Metcalfe DD. Int Arch Allergy Immunol. 1995;107:136–138. doi: 10.1159/000236955. [DOI] [PubMed] [Google Scholar]
- 7.Gilfillan AM, Beaven MA. Crit Rev Immunol. 2011;31:475–530. doi: 10.1615/critrevimmunol.v31.i6.30. [DOI] [PMC free article] [PubMed] [Google Scholar]
- 8.Collington SJ, Williams TJ, Weller CL. Trends Immunol. 2011;32:478–485. doi: 10.1016/j.it.2011.08.002. [DOI] [PubMed] [Google Scholar]
- 9.Friend DS, Ghildyal N, Austen KF, Gurish MF, Matsumoto R, Stevens RL. J Cell Biol. 1996;135:279–290. doi: 10.1083/jcb.135.1.279. [DOI] [PMC free article] [PubMed] [Google Scholar]
- 10.Halova I, Draberova L, Draber P. Front Immunol. 2012;3:119. doi: 10.3389/fimmu.2012.00119. [DOI] [PMC free article] [PubMed] [Google Scholar]
- 11.El-Agamy DS. Eur J Pharmacol. 2012;690:1–3. doi: 10.1016/j.ejphar.2012.06.030. [DOI] [PubMed] [Google Scholar]
- 12.Akin C, Metcalfe DD. J Allergy Clin Immunol. 2004;114:13–19. doi: 10.1016/j.jaci.2004.04.046. [DOI] [PubMed] [Google Scholar]
- 13.Broudy VC. Blood. 1997;90:1345–1364. [PubMed] [Google Scholar]
- 14.Gambini E, Pompilio G, Biondi A, Alamanni F, Capogrossi MC, Agrifoglio M, Pesce M. Cardiovasc Res. 2011;89:362–373. doi: 10.1093/cvr/cvq292. [DOI] [PubMed] [Google Scholar]
- 15.Zhang ZJ, Sieber-Blum M. Dev Neurosci. 2009;31:202–211. doi: 10.1159/000193396. [DOI] [PubMed] [Google Scholar]
- 16.Kitamura Y, Hirota S, Nishida T. Mutat Res. 2001;477:165–171. doi: 10.1016/s0027-5107(01)00117-8. [DOI] [PubMed] [Google Scholar]
- 17.Heit B. J Cell Biol. 2002;159:91–102. doi: 10.1083/jcb.200202114. [DOI] [PMC free article] [PubMed] [Google Scholar]
- 18.Poole TJ, Zetter BR. Cancer Res. 1983;43:5857–5861. [PubMed] [Google Scholar]
- 19.Kim BJ, Wu M. Ann Biomed Eng. 2011;40:1316–1327. doi: 10.1007/s10439-011-0489-9. [DOI] [PMC free article] [PubMed] [Google Scholar]
- 20.Mani M, Venkatasubrahmanyam S, Sanyal M, Levy S, Butte A, Weinberg K, Jahn T. Blood. 2009;114:2900–2908. doi: 10.1182/blood-2009-01-200733. [DOI] [PMC free article] [PubMed] [Google Scholar]
- 21.Snapper SB, Rosen FS, Mizoguchi E, Cohen P, Khan W, Liu CH, Hagemann TL, Kwan SP, Ferrini R, Davidson L, Bhan AK, Alt FW. Immunity. 1998;9:81–91. doi: 10.1016/s1074-7613(00)80590-7. [DOI] [PubMed] [Google Scholar]
- 22.Duffy DC, McDonald JC, Schueller OJA, Whitesides GM. Anal Chem. 1998;70:4974–4984. doi: 10.1021/ac980656z. [DOI] [PubMed] [Google Scholar]
- 23.Kuhnert F, Mancuso MR, Shamloo A, Wang HT, Choksi V, Florek M, Su H, Fruttiger M, Young WL, Heilshorn SC, Kuo CJ. Science. 2010;330:985–989. doi: 10.1126/science.1196554. [DOI] [PMC free article] [PubMed] [Google Scholar]
- 24.Shamloo A, Ma N, Poo MM, Sohn LL, Heilshorn SC. Lab Chip. 2008;8:1292–1299. doi: 10.1039/b719788h. [DOI] [PubMed] [Google Scholar]
- 25.Shamloo A, Heilshorn SC. Lab Chip. 2010;10:3061–3068. doi: 10.1039/c005069e. [DOI] [PubMed] [Google Scholar]
- 26.Shamloo A, Xu H, Heilshorn S. Tissue Eng, Part A. 2012;18:320–330. doi: 10.1089/ten.tea.2011.0323. [DOI] [PMC free article] [PubMed] [Google Scholar]
- 27.Xu H, Heilshorn SC. Small. 2013;9:585–595. doi: 10.1002/smll.201202208. [DOI] [PMC free article] [PubMed] [Google Scholar]
- 28.Poznansky MC, Olszak IT, Foxall R, Evans RH, Luster AD, Scadden DT. Nat Med. 2000;6:543–548. doi: 10.1038/75022. [DOI] [PubMed] [Google Scholar]
- 29.Kohrgruber N, Gröger M, Meraner P, Kriehuber E, Petzelbauer P, Brandt S, Stingl G, Rot A, Maurer D. J Immunol. 2012;173:6592–6602. doi: 10.4049/jimmunol.173.11.6592. [DOI] [PubMed] [Google Scholar]
- 30.Vianello F, Kraft P, Mok YT, Hart WK, White N, Poznansky MC. J Immunol. 2005;175:5115–5125. doi: 10.4049/jimmunol.175.8.5115. [DOI] [PubMed] [Google Scholar]
- 31.Poznansky MC. J Clin Invest. 2002;109:1101–1110. doi: 10.1172/JCI13853. [DOI] [PMC free article] [PubMed] [Google Scholar]
- 32.Kambe N, Hiramatsu H, Shimonaka M, Fujino H, Nishikomori R, Heike T, Ito M, Kobayashi K, Ueyama Y, Matsuyoshi N, Miyachi Y, Nakahata T. Blood. 2004;103:860–867. doi: 10.1182/blood-2003-04-1160. [DOI] [PubMed] [Google Scholar]
- 33.Katayama N, Shih JP, Nishikawa S, Kina T, Clark SC, Ogawa M. Blood. 1993;82:2353–2360. [PubMed] [Google Scholar]
- 34.Xiang Y, Li Y, Zhang Z, Cui K, Wang S, Yuan XB, Wu CP, Poo MM, Duan S. Nat Neurosci. 2002;5:843–848. doi: 10.1038/nn899. [DOI] [PubMed] [Google Scholar]
- 35.Côté JF, Vuori K. Science. 2009;324:346–347. doi: 10.1126/science.1173646. [DOI] [PMC free article] [PubMed] [Google Scholar]
- 36.Kozawa O, Blume-Jensen P, Heldin CH, Rönnstrand L. Eur J Biochem. 1997;248:149–155. doi: 10.1111/j.1432-1033.1997.00149.x. [DOI] [PubMed] [Google Scholar]
- 37.Dráber P, Sulimenko V, Dráberová E. Front Immunol. 2012;3:130. doi: 10.3389/fimmu.2012.00130. [DOI] [PMC free article] [PubMed] [Google Scholar]
- 38.Jahn T, Leifheit E, Gooch S, Sindhu S, Weinberg K. Blood. 2007;110:1739–1747. doi: 10.1182/blood-2006-05-020925. [DOI] [PMC free article] [PubMed] [Google Scholar]
- 39.Wu H, Klingmüller U, Besmer P, Lodish HF. Nature. 1995;377:242–246. doi: 10.1038/377242a0. [DOI] [PubMed] [Google Scholar]
- 40.Jahn T, Sindhu S, Gooch S, Seipel P, Lavori P, Leifheit E, Weinberg K. Blood. 2007;110:1840–1847. doi: 10.1182/blood-2005-12-028019. [DOI] [PMC free article] [PubMed] [Google Scholar]
- 41.Jiang Y, Borrelli LA, Kanaoka Y, Bacskai BJ, Boyce JA. Blood. 2007;110:3263–3270. doi: 10.1182/blood-2007-07-100453. [DOI] [PMC free article] [PubMed] [Google Scholar]
Associated Data
This section collects any data citations, data availability statements, or supplementary materials included in this article.