

Abstract
Non-phagocytic NAD(P)H oxidases have been implicated as major sources of reactive oxygen species in blood vessels. These oxidases can be activated by cytokines, thereby generating , which is subsequently converted to H2O2 and other oxidant species. The oxidants, in turn, act as important second messengers in cell signaling cascades. We hypothesized that reactive oxygen species, themselves, can activate the non-phagocytic NAD(P)H oxidases in vascular cells to induce oxidant production and, consequently, cellular injury. The current report demonstrates that exogenous exposure of non-phagocytic cell types of vascular origin (smooth muscle cells and fibroblasts) to H2O2 activates these cell types to produce via an NAD(P)H oxidase. The ensuing endogenous production of contributes significantly to vascular cell injury following exposure to H2O2. These results suggest the existence of a feed-forward mechanism, whereby reactive oxygen species such as H2O2 can activate NAD(P)H oxidases in non-phagocytic cells to produce additional oxidant species, thereby amplifying the vascular injury process. Moreover, these findings implicate the non-phagocytic NAD(P)H oxidase as a novel therapeutic target for the amelioration of the biological effects of chronic oxidant stress.
Reactive oxygen species (ROS)1-mediated oxidative stress is believed to produce tissue injury in a wide variety of disease processes, including aging, neurodegenerative disorders, infections, atherosclerosis, and other cardiovascular diseases. H2O2 is a ubiquitous ROS that can activate signaling processes and induce cytotoxicity in many mammalian cell types, including vascular smooth muscle cells (SMC), cardiomyocytes, and neurons (1, 2). The mechanisms by which H2O2 induces cytotoxicity are not completely understood, but studies with superoxide dismutase (SOD)-deficient strains of Escherichia coli have suggested that intracellular may contribute to H2O2-induced cytotoxicity (3).
Recently, a new class of NAD(P)H oxidases have been found to be major sources of in many non-phagocytic cells (4–7). These enzymes are structurally and functionally unique from the widely studied phagocytic oxidases and are believed to mediate the biological effects of cytokines, such as platelet-derived growth factor (PDGF) and angiotensin II. Since cytokine-activated intracellular signaling pathways can also be stimulated by H2O2 (8, 9), we hypothesized that H2O2-induced NAD(P)H oxidase-dependent production of , in non-phagocytic cells, could contribute to H2O2-induced cell injury.
The current report demonstrates that exogenous exposure of non-phagocytic cell types of vascular origin (SMC and fibroblasts) to H2O2 activates these cell types to produce via an NAD(P)H oxidase. The ensuing endogenous production of by fibroblasts and SMC is shown to contribute significantly to cell injury following exposure to H2O2. These results suggest that H2O2 induced stimulation of NAD(P)H oxidase activity in nonphagocytic cell types could represent a mechanism by which oxidant-mediated injury is amplified in vivo and identify these NAD(P)H oxidase enzymes as therapeutic targets for the amelioration of the biological effects of chronic oxidant stress.
EXPERIMENTAL PROCEDURES
Cell Culture
SMC were prepared from 250 to 300-g male Harlan-Sprague Dawley rats as previously described (10, 11). Aortic adventitial fibroblasts were prepared from C57 BL/6 and from gp91phox knock-out mice (Jackson Lab, Bar Harbor, ME) as described (12, 13). The cells were grown in minimum essential media supplemented with 10% fetal bovine serum and penicillin (100 IU/ml) and streptomycin (100 μg/ml) in a humidified atmosphere containing 5% CO2 at 37 °C. Stocks were subcultured at subconfluence by trypsinization. All experiments were performed on cells between passages 8 and 20 grown to 70% to 95% confluence in 24-well plates, 35- or 60-mm dishes, or 4-well chamber slides.
Superoxide Measurement by Enhanced Chemiluminescence
Lucigenin luminescence measurements were carried out using 5 μm lucigenin, a concentration which is unlikely to induce redox cycling (14). Cells were grown to subconfluence in 35-mm dishes and growth arrested in serum-free medium for 24 h. After exposure to H2O2 at the indicated concentrations and times, cells were washed twice with PBS, and 5 mm lucigenin was added. Immediately afterward, NADPH (0.1 mm) was added, and after dark adaptation, luminescence was measured every 15 s for 5 min in a luminometer (Zylux Corp). Changes in luminescence were expressed as relative luminescent units per 105 cells per minute. No changes in luminescence were observed in the absence of NADPH, and addition of H2O2 to lucigenin in PBS in the absence of cells did not increase chemiluminescence. Some experiments were also performed with coelenterazine (5 mm), a structurally distinct luminescent probe which reportedly is not capable of redox cycling via autoxidation (15). Data were analyzed by ANOVA followed by Bonferroni t testing.
Intracellular Determination by Confocal Microscopy
SMC grown on chamber slides were treated as indicated under “Results” and in the figure legends, washed, and incubated with dihydroethidium (HE, 5 μm), a probe which detects , for 40 min at 37 °C in a humidified chamber. The cells were then imaged with a Bio-Rad MRC-1024 laser scanning confocal microscope equipped with a krypton/argon laser (excitation 488 nm, emission 610 nm). Fluorescence was detected with a 585-nm long pass filter. Control and treatment groups were always imaged in parallel to ensure that the processing techniques and laser settings were identical. All images were collected using a 512 × 512-pixel format and archived for subsequent analysis, as reported previously (10). Fluorescence intensity (expressed in arbitrary units) was analyzed using Confocal Assistant™, version 3.10 and NIH Image: Use in Fluorescence and Confocal Microscopy, version 2.0. The relative fluorescence intensity was calculated by dividing the total fluorescence intensity by total cell number in the measuring field (10). Mean fluorescence intensity measurements obtained from three separate wells in each group were analyzed by ANOVA followed by Bonferroni t testing.
Human coronary arteries were obtained from freshly explanted hearts and processed for detection of in situ ROS as described (16). Sections (30 μm thick) were incubated with HE (10 μm) for 30 min at 37 °C in a humidified chamber. Afterward, coverslips were applied, and confocal microscopy was performed as described above. Under these conditions, only highly elastic structures (i.e. elastic laminae) exhibit autofluorescence. For all confocal microscopy experiments, results shown are representative of those obtained in experiments performed in duplicate or triplicate and repeated at least one time to ensure reproducibility.
In some experiments, the fluorescence of HE was quantitated using flow cytometry. Mouse aortic fibroblasts were grown to subconfluence in 60-mm dishes, treated with or without 200 μm H2O2 for 40 min, washed, and incubated with HE (10 μm) for 40 min. The cells were removed by trypsinization, which was neutralized with PBS containing 10% fetal calf serum, and then analyzed by flow cytometry (Becton Dickinson FACScan). Mean fluorescence values among the groups were analyzed by ANOVA followed by Bonferroni t testing.
Cell Viability Assays
Cell viability was assessed by 3-(4,5-dimethalthiazol-2-yl)-5-(3-carboxymethyloxphenyl)-2-(4-sulfenyl)-2H-tetrazolium, inner salt (MTS) assay using a test kit (Promega) or by trypan blue exclusion (Sigma) according to the manufacturer's instructions (10, 11). SMC were exposed to 100 μm H2O2 for 1 h in the absence or presence of pretreatment with 10 μm DPI, 500 units/ml catalase, 1 mm Tiron, 500 milliunits/ml PEG-SOD, 1 mm DETC, or 10 μm rotenone. The duration of pretreatment was 30 min for all agents except PEGSOD, with which the cells were preincubated for 16 h. Alternatively, fibroblasts from C57 or gp91phox knock-out mice were exposed to 0–200 μm H2O2 for 1 h. Subsequently, MTS viability assay was performed 24 h after exposure to oxidants. After normalizing the MTS results to % of control values, data were analyzed by ANOVA followed by Bonferroni t testing.
In separate experiments, SMC were treated with vehicle or 10 μm DPI, or transfected with scrambled, sense, or antisense oligonucleotides against p22phox, as described below. Afterward, cells were exposed to 0 (vehicle), 100, or 200 μm H2O2 for 1 h. H2O2. Trypan blue staining was performed 5 h later, and the data were analyzed by ANOVA followed by Bonferroni t testing.
In situ Nick-end Labeling and Propidium Iodide Staining
Terminal deoxyribonucleotidyl transferase-mediated dUTP-digoxigenin nick-end labeling (TUNEL) assay for detecting DNA fragmentation in situ was performed as described previously with a commercially available kit (ApopTagTM Plus, Oncor, Gaithersburg, MD) (11). Briefly, following completion of the experimental protocols, the samples were preincubated with equilibration buffer for 5 min and subsequently incubated with deoxyribonucleotidyl transferase in the presence of digoxigenin-conjugated dUTP for 1 h at 37 °C. The reaction was terminated by incubating the samples in stopping buffer for 30 min. After three rinses with PBS, samples were incubated with the fluorescein-labeled anti-digoxigenin antibody for 30 min, and three rinses with PBS were repeated. Finally, the samples were stained and mounted with Oncor Propidium Iodide/Antifade, and then examined by laser confocal microscopy.
Transfection with p22phox Oligonucleotides
Cells were transfected with 1 μm oligonucleotides (prepared by the DNA facility at the University of Iowa College of Medicine) with the aid of Lipofectin (Life Technologies, Inc.) in serum-free medium for 18 h. The sequences were as follows: antisense p22phox: 5′-GATCTGCCCCATGGTGAGGACC-3′; sense p22phox: 5′-GGTCCTCACCATGGGGCAGATC-3′; and a scrambled sequence 5′-TGGCGAGGTGCCCAGTTCAACC-3′. After washing, 2% fetal calf serum medium was applied for 24 h, after which the cells were treated as indicated under “Results” and in the figure legends, and then assayed for intracellular or viability.
All reagents were purchased from Sigma unless otherwise stated. Procurement of all animal and human tissues was approved by, and performed in accordance with, the Review Committees at the University of Iowa College of Medicine.
RESULTS
H2O2 induces Production in Rat Aortic Smooth Muscle Cells
To investigate whether H2O2 stimulates release of , rat aortic smooth SMC were exposed to various concentrations of H2O2 for 40 min. The cells were washed, and lucigenin-enhanced chemiluminescence was performed for detection of . Treatment with H2O2 resulted in concentration-dependent increases in NADPH-stimulated lucigenin-enhanced chemiluminescence, with maximal values observed at 200 μm H2O2 (Fig. 1a). Examination of the time course with 200 μm H2O2 indicated that an increase in the chemiluminescence signal was detected as early as 10 min after application of H2O2 and reached maximum by 40 min (Fig. 1b). The increase in lucigenin-enhanced chemiluminescence was maintained for at least 3 h after exposure to a single dose of 100 μm H2O2 (not shown). Pretreatment with allopurinol, an inhibitor of xanthine oxidase, indomethacin, an inhibitor of cyclooxygenase, or L-NAME, an inhibitor of nitric-oxide synthase, did not attenuate the H2O2-induced enhancement in chemiluminescence, suggesting that these enzymatic pathways were not responsible for production (not shown). In contrast, the signal was abolished by diphenylene iodonium (DPI, 10 μm), which inhibits flavin-containing enzymes, including NAD(P)H oxidase (Fig. 1c). Consistent with the lucigenin data, H2O2 also produced an increase in coelenterazine-enhanced chemiluminescence, which was likewise inhibitable by DPI, suggesting that autoxidation of lucigenin was not responsible for the observed effects (data not shown).
Fig. 1. H2O2 increases as detected by lucigenin-enhanced chemiluminescence.

Cells were exposed to H2O2 at the indicated concentrations (panel a) and times (panel b), after which lucigenin-enhanced chemiluminescence was performed. Panel c shows the effects of pretreatment with 10 μm DPI on increases in chemiluminescence induced by 200 μm H2O2. n = 4 in each group. *, p < 0.05 versus 0 μm H2O2 (a), 0 min (b), or control (c); #, p < 0.05 versus H2O2 (c).
Next, cells were exposed to 200 μm H2O2 for 40 min, washed, incubated with HE, and examined by confocal laser scanning microscopy. HE reacts with intracellular to produce a red cellular fluorescence (10, 16). Treatment with H2O2 resulted in a 4-fold increase in HE fluorescence, which was blocked by preincubation with polyethylene glycol-conjugated SOD (PEGSOD), indicating that the signal resulted from (Fig. 2, Table I). Pretreatment with DPI eliminated the increase in HE fluorescence produced by H2O2, suggesting that the was derived from NAD(P)H oxidase. In contrast, preincubation with diethyldithiocarbamate (DETC), an inhibitor of Cu/Zn-SOD (17), resulted in an increase in HE fluorescence under basal conditions as well as following treatment with H2O2. This latter observation raised the possibility that the increase in might be due to H2O2-induced inhibition of endogenous SOD activity. Therefore, we performed SOD activity assays. Exposure to H2O2 did not inhibit Cu/Zn-SOD activity (determined by gel assay) (18) in control cells or in cells whose SOD activity was increased ≅2-fold by preincubation with PEG-SOD (not shown). In contrast, DETC, as expected, markedly inhibited Cu/Zn-SOD activity in control cells and in cells treated with H2O2 (not shown). Mn-SOD activity (determined by colorimetric assay) (18) was not different among control and H2O2-treated cells (not shown). Also, rat SMC do not express the extracellular isoform of SOD (19). Thus, H2O2 increased intra-cellular by inducing the production, rather than inhibiting the destruction, of .
Fig. 2. H2O2 increases intracellular as detected by HE fluorescence.

Confluent cells were growth-arrested and then pretreated with cell-permeable PEG-SOD (500 units/ml) for 16 h, or with vehicle (control), DPI (10 μm), DETC (1 mm), or rotenone (10 μm) for 1 h. Cells were then exposed to 0 or 200 μm H2O2 for 40 min. After removing the H2O2, cells were incubated with HE (10 μm) for 30 min and then examined by confocal laser scanning microscopy. HE is oxidized by and intercalates with DNA, yielding a bright red fluorescence. Similar results were obtained in one or more additional experiments (performed in duplicate) for each condition.
Table I. Quantitative effects of H2O2 on HE fluorescence in SMC.
SMC were grown on 4-well chamber slides and treated with vehicle, PEG-SOD (500 units/ml), DPI (10 μm), DETC (1 mm), or rotenone (10 μm), as described in the legend to Fig. 2. Cells were then exposed to 0 (control) or 200 μm H2O2 for 40 min, incubated with HE (10 μm), and examined by confocal laser scanning microscopy. Mean fluorescence intensity measurements (expressed as arbitrary units, normalized to the percentage of the field occupied by fluorescent cells) obtained from three separate wells in each group were analyzed by ANOVA followed by Bonferroni t testing.
| Relative fluorescence |
|||||
|---|---|---|---|---|---|
| Vehicle | PEG-SOD | DETC | DPI | Rotenone | |
| Control | 2.7 ± 0.4 | 2.4 ± 0.5 | 5.8 ± 0.3 | 2.6 ± 0.4 | 9.1 ± 1.1 |
| H2O2 | 11.0 ± 0.6a | 3.0 ± 0.5b | 16.7 ± 1.5a,b | 2.2 ± 0.2b | 16.1 ± 0.8a,b |
p < 0.05 compared with corresponding control value.
p < 0.05 compared with vehicle H2O2 value.
Mitochondria are important sources of and may contribute to cytotoxicity induced by peroxides (20). To investigate whether the generated by treatment with H2O2 might be derived from mitochondrial sources, we tested the effects of rotenone, an inhibitor of complex I of the mitochondrial electron transport chain (21). Like H2O2, rotenone, by itself, increased HE fluorescence (Fig. 2, Table I), suggesting that blockade of the mitochondrial electron transport chain can promote electron leakage to generate . Pretreatment with 10 μm DPI did not inhibit rotenone-induced production (not shown). Moreover, exposure to H2O2 resulted in further enhancement of HE fluorescence in rotenone pretreated cells (Fig. 2, Table I). Antimycin A, an inhibitor of complex III of the mitochondrial electron transport chain, also increased intracellular but did not block the increase in production following H2O2 (not shown). Taken together, these results suggest that H2O2 increases through a mechanism distinct from the mitochondrial electron transport chain, with the most likely source being NAD(P)H oxidase.
p22phox Antisense Oligonucleotides Inhibit H2O2-induced Production
As pharmacological inhibitors are not absolutely specific to one cellular target, we transfected SMC with anti-sense oligonucleotides against p22phox, a subunit required to form activated NAD(P)H oxidase complexes in SMCs (22, 23). The antisense sequence we employed has been shown to inhibit NAD(P)H oxidase-dependent production in SMC (22, 23). Transfection with p22phox antisense oligonucleotides markedly attenuated the increase in HE fluorescence induced by a 40-min application of 20 ng/ml PDGF, whereas sense oligonucleo-tides were without effect (Fig. 3a, Table II), confirming the efficacy and specificity of the antisense oligonucleotides to functionally block NAD(P)H oxidase in our SMC. Transfection with p22phox antisense oligonucleotides also markedly attenuated the increase in HE fluorescence induced by exposure to H2O2 (Fig. 3b, Table II). In contrast, the increase in HE fluorescence induced by the mitochondrial inhibitor, rotenone, was unaffected by transfection with p22phox antisense oligonucleotides. Furthermore, scrambled p22phox antisense oligonucleotides did not inhibit the H2O2-induced increase in intracellular (not shown).
Fig. 3. P22phox antisense, but not sense, oligonucleotides inhibit PDGF- and H2O2-induced production.

Cells were transfected for 18 h with the indicated oligonucleotides (1 μm) and then maintained in 2% fetal calf serum medium for an additional 24 h. Cells were washed and placed in serum-free medium and then exposed to vehicle (control), PDGF (20 ng/ml, panel a), H2O2 (200 μm, panel b), or rotenone (10 μm, panel b) for 40 min. Subsequently, intracellular was examined by confocal microscopy, as described in the legend to Fig. 2.
Table II. Quantitative effects of transfection with p22phox oligonucleotides on HE fluorescence.
SMC were grown on 4-well chamber slides and transfected for 18 h with the indicated oligonucleotides (1 μm) and then maintained in 2% FCS medium for an additional 24 h. Cells were then exposed to vehicle, PDGF (20 ng/ml), H2O2 (200 μm), or rotenone (10 μm) for 40 min. Subsequently, cells were incubated with HE, and fluorescence was quantitated as described in Table I.
| Relative fluorescence |
||||
|---|---|---|---|---|
| Vehicle | PDGF | H2O2 | Rotenone | |
| p22phox sense | 3.9 ± 0.60 | 16.7 ± 1.5a | 15.3 ± 0.2a | 16.0 ± 1.9a |
| p22phox antisense | 3.1 ± 0.6 | 5.7 ± 0.6a,b | 6.0 ± 0.6a,b | 16.3 ± 2.6a |
p < 0.05 compared with sense or antisense vehicle value.
p < 0.05 compared with corresponding sense value.
H2O2-induced Production Is Reduced in Fibroblasts from gp91phox Knock-out Mice
Gp91phox is a plasma membrane subunit of NAD(P)H oxidase in fibroblasts, but not in SMC (24). To further investigate the role of NAD(P)H oxidase in H2O2-induced production, aortic fibroblasts were cultured from gp91phox knock-out mice and from control C57 mice. H2O2 produced greater increases in intracellular in fibroblasts from C57 mice as compared with those from gp91phox knock-out mice (Fig. 4, a and b). In contrast, rotenone produced similar increases in intracellular in fibroblasts cultured from C57 and gp91phox-deficient mice. These results further support the notion that the H2O2-induced production is mediated by NAD(P)H oxidase.
Fig. 4. H2O2-induced production is reduced in fibroblasts from gp91phox knock-out mice.

Aortic fibroblasts derived from either gp91phox knock-out mice (gp91) or C57 mice were treated with vehicle (control), 200 μm H2O2, or 10 μm rotenone for 40 min, after which intracellular was examined by incubating with HE followed by confocal microscopy (panel a). In separate experiments, fluorescence of HE in the absence or presence of 40 min exposure to H2O2 was quantitated by flow cytometry (panel b). n = 3 per group. *, p < 0.05 compared with corresponding value in the absence of H2O2; #, p < 0.05 compared with gp91 + H2O2.
A DPI-inhibitable Source of Is Present in Human Coronary Arteries
To assess the potential role of NAD(P)H oxidase in generation of in human blood vessels, we examined coronary arteries removed from the hearts of patients with atherosclerosis at the time of cardiac transplantation. Vessel segments were pretreated with vehicle or DPI, incubated with HE, and then examined by confocal microscopy, as described previously (10, 16). HE fluorescence was detected throughout the neointima, media, and adventitia of segments pretreated with vehicle (Fig. 5). Preincubation with PEG-SOD markedly attenuated the HE fluorescence, confirming that it originated from (not shown). The HE fluorescence was strongly attenuated by pretreatment with DPI, suggesting that NAD(P)H oxidase contributes importantly to production in SMC and fibroblasts in atherosclerotic human coronary arteries.
Fig. 5. In situ detection of ROS in human coronary arteries.
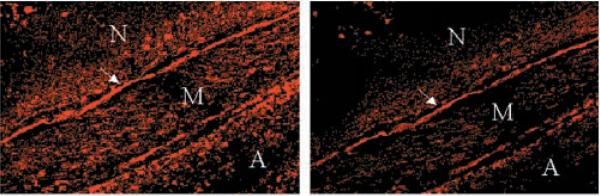
Sections of an atherosclerotic human coronary artery were treated without (left panel) or with (right panel) DPI, followed by incubation with HE and examination by confocal microscopy; red fluorescence of HE indicates the presence of . The arrow points to the internal elastic lamina; N indicates the neointima, M the media, and A the adventitia. The results are representative of those obtained in multiple sections of arteries obtained from three different patients.
NAD(P)H Oxidase-derived Contributes to H2O2-induced Cytotoxicity
Next, we examined whether NAD(P)H oxidase-mediated production contributes to H2O2-induced cytotoxicity. Exposure of SMC to 100 μm H2O2 for 1 h resulted in ≅40% reduction in cell viability as determined 24 h later by MTS assay, which could be prevented by adding catalase to the incubation medium (Fig. 6a). Pretreatment with DPI blocked the reduction in cell viability induced by H2O2. When the exposure to H2O2 was extended from 1 to 3 h, ≅65% reduction in viability was observed in cells not pretreated with DPI, whereas DPI-pretreated cells maintained full viability (not shown). Similar results were obtained in cells continuously exposed to serum, suggesting that the protective effect of DPI was not dependent on the growth status of the cells (not shown). The protective effects of DPI were observed when cells were exposed to <800 μm H2O2; higher concentrations of H2O2 were uniformly toxic regardless of pretreatment with DPI.
Fig. 6. Effects of modulation of on H2O2-induced cytotoxicity.

SMC were pretreated with the indicated pharmacological agents as described in the legend to Fig. 2, or to 1 mm Tiron or 500 units/ml catalase for 1 h. Cells were then exposed to 0 (control) or 100 μm H2O2 for 1 h (panel a), or to 0–200 μm H2O2 (panel b). Viability was assessed by MTS assay after 24 h (panel a) or by trypan blue staining after 6 h (panel b). In separate experiments, SMC were transfected with scrambled, sense, or antisense oligonucleotides against p22phox and then treated with 0–200 μm H2O2 for 1 h. Six h later, cell viability was assessed by trypan blue staining (panel c). Alternatively, fibroblasts from C57 or gp91phox knock-out mice were treated with 100 μm H2O2 for 1 h, and viability was assessed by MTS after 24 h (panel d). n = 3 in each group. *, p < 0.05 compared with control (vehicle), #, p < 0.05 compared with 100 μm H2O2 (a and b); *, p < 0.05 compared with corresponding value for sense or scrambled (c); *, p < 0.05 compared with 0 μm H2O2; #, p < 0.05 compared with corresponding value for C57 cells (d).
Because reduction of MTS depends upon mitochondrial function, which can be influenced by H2O2, we also examined cell viability by staining with trypan blue. Up to 1 h after exposure to 200 μm H2O2, no trypan blue-positive cells were observed (not shown). Six h after exposure to H2O2, however, we observed dose-dependent increases in the percentage of trypan blue-positive cells, which were blocked by DPI (Fig. 6b) or by transfection with antisense oligonucleotides against p22phox (Fig. 6c).
H2O2 has been shown to induce SMC apoptosis (1). To investigate whether activation of NAD(P)H oxidase might participate in this process, TUNEL staining was performed. Cells were transfected with p22phox sense or antisense oligonucleotides as described previously, and then exposed to 200 μm H2O2 or vehicle (control) for 1 h. After 24 h, TUNEL staining was performed. Following transfection with sense oligonucleotides, 15.0 ± 2.0% of H2O2-treated cells were TUNEL-positive, whereas only 0.6 ± 0.1% of control cells were TUNEL-positive (p < 0.05). Transfection with the p22phox antisense oligonucleotides markedly attenuated the increase in TUNEL-positive cells following treatment with H2O2 (3.4 ± 0.4%, p < 0.05 compared with sense transfection). Similar results were obtained following pretreatment with 10 μm DPI (not shown). These results suggest that activation of NAD(P)H oxidase may play an important role in H2O2-induced apoptosis of SMC.
Moreover, pretreatment with Tiron (a cell-permeable intracellular scavenger of ) or PEG-SOD attenuated, while DETC or rotenone enhanced, H2O2-induced SMC cytotoxicity (Fig. 6a). Finally, as compared with aortic fibroblasts from C57 mice, the fibroblasts derived from gp91phox knock-out mice were resistant to H2O2-induced cytotoxicity (Fig. 6d). Collectively, these results suggest that H2O2 induces NAD(P)H oxidase-dependent production of , which in turn participates in vascular cell cytotoxicity, perhaps in part through induction of apoptosis.
DISCUSSION
Levels of reactive oxygen species are increased in, and participate in the pathophysiology of, many diverse conditions involving chronic oxidative stress. In inflammatory processes, the phagocytic NADH oxidase of activated leukocytes is a primary source of , which is converted, in part by the action of SOD, to H2O2 (25). H2O2 is a highly permeable yet relatively non-reactive molecule in the absence of proper reductants; consequently, micromolar levels of H2O2 can be attained in cells and tissues exposed to oxidative stress. Furthermore, in intracellular compartments such as peroxisomes, it is estimated that even greater concentrations of H2O2 can be produced. Here, we demonstrate that physiologically relevant concentrations of H2O2 (up to 200 μm) stimulate NAD(P)H oxidase-dependent production in non-phagocytic cells of vascular origin. This finding could potentially be very significant in regards to intracellular signaling by H2O2. Moreover, as SMC are important sources of ROS in atherosclerotic blood vessels (16), our findings could be relevant to cytotoxic and proliferative responses induced during oxidative stress in chronic vascular inflammatory diseases such as atherosclerosis.
In addition to NAD(P)H oxidase, several other enzymes, such as xanthine oxidase, cyclooxygenase, and nitric-oxide synthase, have been suggested to be capable of generating in SMC; however, inhibitors of these enzymes did not block H2O2-induced production of by our cells. The mitochondrial electron transport chain is also a potential source of , as demonstrated by the results obtained with rotenone and antimycin A. While both of these agents increased intracellular , neither was able to block H2O2-induced production. Furthermore, p22phox antisense oligonucleotides selectively blocked H2O2-induced production, without affecting the increase in induced by rotenone. Finally, H2O2-induced production in fibroblasts derived from C57 mice exceeded that observed in cells derived from gp91phox knock-out mice. Together, these data clearly implicate an NAD(P)H oxidase as the primary source of production induced by physiologically relevant concentrations of H2O2 in non-phagocytic cell types present in the vascular wall. The marked reduction in HE fluorescence by DPI in atherosclerotic human coronary arteries suggests that NAD(P)H oxidase is present in fibroblasts and SMC and may contribute significantly to vascular production in vivo.
The mechanism by which H2O2 activates the non-phagocytic NAD(P)H oxidase remains to be determined. Since increases in were observed as soon as 10 min after exposure to H2O2, gene transcription and translation do not appear to be required. The NAD(P)H oxidase in non-phagocytic cells is known to be comprised of several subunits, including the α subunit of cytochrome b558, p22phox, the β subunit of cytochrome b558, gp91phox (or a homologue in SMC and in some other cells), p47phox, and p67phox (5–7, 22, 26). In addition, cytoplasmic Rac protein must associate with the membrane-bound complex to form active enzyme (27). Previous reports suggest that the oxidase can be rapidly activated by arachidonic acid, and that angiotensin II-mediated activation of the oxidase is dependent upon release of endogenous arachidonic acid (24). Concentrations of H2O2 similar to those used in this study have also been demonstrated to induce arachidonic acid release in SMCs (28), suggesting that this mechanism is possible. Moreover, angiotensin II-induced activation of the non-phagocytic oxidase was reported to be dependent upon p38 mitogen-activated protein kinase (29), which also appears to be activated by H2O2 in some cells (5). In addition, H2O2 could activate the NAD(P)H oxidase by phosphorylating p22phox or, perhaps, another subunit of the enzyme. Finally, concentrations of H2O2 similar to those used in this study (100–500 μm) have been shown to increase levels of intracellular calcium (30), which might serve as a second messenger to activate the oxidase.
Besides demonstrating that H2O2 stimulates NAD(P)H oxidase to increase intracellular production, we have shown that inhibiting NAD(P)H oxidase protected cells against toxicity induced by the same concentrations of H2O2. As transfection with p22phox antisense oligonucleotides markedly reduced the number of TUNEL-positive cells after treatment with H2O2, our results suggest that inhibition of NAD(P)H oxidase may protect SMC against H2O2-induced apoptosis. Since oxidant-induced SMC apoptosis has been implicated in neointimal regression and atherosclerotic lesion destabilization, these findings could be relevant to clinical vascular disease (11). Moreover, inhibiting NAD(P)H oxidase with DPI protected against cytotoxicity induced by similar concentrations of a lipid hydroperoxide, tert-butylhydroperoxide (data not shown), suggesting that the non-phagocytic NAD(P)H oxidase might be activated by endogenous lipid hydroperoxides, which are present in abundance in oxidized low-density lipoprotein particles. Tiron or SOD, which reduced intracellular , also protected against H2O2-induced cytotoxicity, while DETC, which increased , enhanced it. Therefore, NAD(P)H oxidase appears to contribute to H2O2-induced cytotoxicity, at least in part, by generating . Interestingly, has been implicated as a growth-promoting agonist in SMC, and inhibiting NAD(P)H oxidase blocked growth responses induced by angiotensin II and PDGF (22, 31). Our results show for the first time that production via the non-phagocytic oxidase can promote oxidant-mediated vascular cell injury. The precise mechanism by which this occurs, and whether additional oxidants (such as HOz and/or redox-active metal ions) are involved, remain to be determined.
In summary, these data suggest the existence of a self-promoting cycle, whereby reactive oxygen species such as H2O2 can activate NAD(P)H oxidases in non-phagocytic cells to produce , which in turn can lead to the generation of more H2O2. This mechanism could help to explain why micromolar concentrations of H2O2 cause oxidant-mediated injury to many different types of cells during chronic oxidative stress. Moreover, H2O2-induced activation of NAD(P)H oxidase in non-phagocytic cells could be an important mechanism by which the degree of oxidative stress, and the subsequent cellular damage, is amplified during inflammatory disorders. Accordingly, the non-phagocytic NAD(P)H oxidase would appear to be a promising target for the amelioration of the biological effects of oxidant stress in chronic inflammatory states.
Acknowledgments
We thank G. R. Aylsworth, P. Chatterjee, L. Hu, P. Q. Wang, and M. G. Piegore, Jr. for technical assistance and other important contributions.
Footnotes
This work was supported in part by Grants HL49264 and HL62984 (to N. L. W. and F. J. M.), RO1 HL51469 (to D. R. S.), and CA66081 (to L. W. O.) from the National Institutes of Health, and by an American Heart Association Postdoctoral Fellowship Award (to W. G. L.). The costs of publication of this article were defrayed in part by the payment of page charges. This article must therefore be hereby marked “advertisement” in accordance with 18 U.S.C. Section 1734 solely to indicate this fact.
The abbreviations used are: ROS, reactive oxygen species; SMC, smooth muscle cells; SOD, superoxide dismutase; PDGF, platelet-derived growth factor; PBS, phosphate-buffered saline; HE, dihydroethidium; MTS, 3-(4,5-dimethalthiazol-2-yl)-5-(3-carboxymethyloxphenyl)-2-(4-sulfenyl)-2H-tetrazolium; DPI, diphenylene iodonium; DETC, diethyldithiocarbamate; PEG, polyethylene glycol.
REFERENCES
- 1.Li PF, Dietz R, Harsdorf VR. FEBS Lett. 1997;404:249–252. doi: 10.1016/s0014-5793(97)00093-8. [DOI] [PubMed] [Google Scholar]
- 2.Hoyt KR, Gallagher AJ, Hastings TG, Reynolds IJ. Neurochem. Res. 1997;22:333–340. doi: 10.1023/a:1022403224901. [DOI] [PubMed] [Google Scholar]
- 3.Carlioz A, Touati D. EMBO J. 1986;5:623–630. doi: 10.1002/j.1460-2075.1986.tb04256.x. [DOI] [PMC free article] [PubMed] [Google Scholar]
- 4.Sundaresan M, Yu ZX, Ferrans VJ, Irani K, Finkel T. Science. 1995;270:296–299. doi: 10.1126/science.270.5234.296. [DOI] [PubMed] [Google Scholar]
- 5.Suh Y-A, Arnold RS, Lassegue B, Shi J, Xu X, Sorescu D, Chung AB, Griendling KK, Lambeth JD. Nature. 1999;401:79–82. doi: 10.1038/43459. [DOI] [PubMed] [Google Scholar]
- 6.Geiszt M, Kopp JB, Varnai P, Leto TL. Proc. Natl. Acad. Sci. U. S. A. 2000;97:8010–8014. doi: 10.1073/pnas.130135897. [DOI] [PMC free article] [PubMed] [Google Scholar]
- 7.Deken XD, Wang D, Many MC, Costagliola S, Libert F, Vassart G, Dumont JE, Miot F. J. Biol. Chem. 2000;275:23227–23233. doi: 10.1074/jbc.M000916200. [DOI] [PubMed] [Google Scholar]
- 8.Baas AS, Berk BC. Circ. Res. 1995;77:29–36. doi: 10.1161/01.res.77.1.29. [DOI] [PubMed] [Google Scholar]
- 9.Guyton KZ, Liu Y, Gorospe M, Xu Q, Holbrook NJ. J. Biol. Chem. 1996;271:4138–4142. doi: 10.1074/jbc.271.8.4138. [DOI] [PubMed] [Google Scholar]
- 10.Brown MR, Miller FJ, Li WG, Ellingson AN, Mozena JD, Chatterjee P, Engelhardt JF, Zwacka RM, Oberley LW, Fang X, Spector AA, Weintraub NL. Circ. Res. 1999;85:524–533. doi: 10.1161/01.res.85.6.524. [DOI] [PMC free article] [PubMed] [Google Scholar]
- 11.Li W-G, Miller FJ, Jr., Brown MR, Chatterjee P, Aylsworth GR, Shao J, Spector AA, Oberley LW, Weintraub NL. Arterioscler. Thromb. Vasc. Biol. 2000;20:1473–1479. doi: 10.1161/01.atv.20.6.1473. [DOI] [PMC free article] [PubMed] [Google Scholar]
- 12.Pagano PJ, Clark JK, Cifuentes-Pagano E, Clark SM, Callis GM, Quinn MT. Proc. Natl. Acad. Sci. U. S. A. 1997;94:14483–14488. doi: 10.1073/pnas.94.26.14483. [DOI] [PMC free article] [PubMed] [Google Scholar]
- 13.Pollock JD, Williams DA, Gifford MA, Li LL, Du X, Fisherman J, Orkin SH, Doerschuk CM, Dinauer MC. Nat. Genet. 1995;9:202–209. doi: 10.1038/ng0295-202. [DOI] [PubMed] [Google Scholar]
- 14.Li Y, Zhu H, Kuppusamy P, Roubaud V, Zweier JL, Trush MA. J. Biol. Chem. 1998;273:2015–2023. doi: 10.1074/jbc.273.4.2015. [DOI] [PubMed] [Google Scholar]
- 15.Tarpey MM, White CR, Suarez E, Richardson G, Radi R, Freeman BA. Circ. Res. 1999;84:1203–1211. doi: 10.1161/01.res.84.10.1203. [DOI] [PubMed] [Google Scholar]
- 16.Miller FJ, Jr., Gutterman DD, Rios CD, Heistad DD, Davidson BL. Circ. Res. 1998;82:1298–1305. doi: 10.1161/01.res.82.12.1298. [DOI] [PubMed] [Google Scholar]
- 17.Hiraishi H, Terano A, Tazandi M, Sugimoto T, Harada T, Ivey KJ. J. Biol. Chem. 1992;267:14812–14817. [PubMed] [Google Scholar]
- 18.Zhang HJ, Yan T, Oberley TD, Oberley LW. Cancer Res. 1999;59:6276–6283. [PubMed] [Google Scholar]
- 19.Carlsson LM, Marklund SL, Edlund T. Proc. Natl. Acad. Sci. U. S. A. 1996;93:5219–5222. doi: 10.1073/pnas.93.11.5219. [DOI] [PMC free article] [PubMed] [Google Scholar]
- 20.Castilho RF, Kowaltowski AJ, Meinicke AR, Bechara EJH, Vercesi AE. Free Rad. Biol. Med. 1995;3:479–486. doi: 10.1016/0891-5849(94)00166-h. [DOI] [PubMed] [Google Scholar]
- 21.Dumont A, Hehner SP, Hofmann TG, Ueffing M, Droge W, Schimtz ML. Oncogene. 1999;18:747–757. doi: 10.1038/sj.onc.1202325. [DOI] [PubMed] [Google Scholar]
- 22.Ushio-Fukai M, Zafari AM, Fukui T, Ishizaka N, Griendling KK. J. Biol. Chem. 1996;271:23317–23321. doi: 10.1074/jbc.271.38.23317. [DOI] [PubMed] [Google Scholar]
- 23.Lynn S, Gurr JR, Lai HT, Jan KY. Circ. Res. 2000;86:514–519. doi: 10.1161/01.res.86.5.514. [DOI] [PubMed] [Google Scholar]
- 24.Griendling KK, Sorescu D, Ushio-Fukai M. Circ. Res. 2000;86:494–501. doi: 10.1161/01.res.86.5.494. [DOI] [PubMed] [Google Scholar]
- 25.Fridovich I. J. Exp. Biol. 1998;201:1203–1209. doi: 10.1242/jeb.201.8.1203. [DOI] [PubMed] [Google Scholar]
- 26.Patterson C, Ruef J, Madamanchi NR, Barry-Lane P, Hu Z, Horaist C, Ballinger CA, Brasier AR, Bade C, Runge MS. J. Biol. Chem. 1999;274:19814–19822. doi: 10.1074/jbc.274.28.19814. [DOI] [PubMed] [Google Scholar]
- 27.Kim KS, Takeda K, Sethi R, Pracyk JB, Tanaka K, Zhou YF, Yu ZX, Gerrans VJ, Bruder JT, Kovesdi I, Irani K, Goldschmidt-Clermont P, Finkel T. J. Clin. Invest. 1998;101:1821–1826. doi: 10.1172/JCI1830. [DOI] [PMC free article] [PubMed] [Google Scholar]
- 28.Cane A, Bretion M, Koumanov K, Bereziat G, Colard O. Am. J. Physiol. 1998;274:C1040–C1046. doi: 10.1152/ajpcell.1998.274.4.C1040. [DOI] [PubMed] [Google Scholar]
- 29.Ushio-Fukai M, Alexander RW, Akers M, Griendling KK. J. Biol. Chem. 1998;273:15022–15029. doi: 10.1074/jbc.273.24.15022. [DOI] [PubMed] [Google Scholar]
- 30.Hu Q, Corda S, Zweier JL, Capogrossi MC, Ziegelstein RC. Circ. Res. 1998;97:268–275. doi: 10.1161/01.cir.97.3.268. [DOI] [PubMed] [Google Scholar]
- 31.Marumo T, Schini-Kerth VB, Fisslthaler B, Busse R. Circulation. 1997;96:2361–2367. doi: 10.1161/01.cir.96.7.2361. [DOI] [PubMed] [Google Scholar]