Abstract
Recent studies show that the D′′ layer, just above the Earth's core–mantle boundary, is composed of MgSiO3 post-perovskite and has significant lateral inhomogeneity. Here we consider the D′′ diversity as related to the single-crystal elasticity of the post-perovskite phase. We measure the single-crystal elasticity of the perovskite Pbnm-CaIrO3 and post-perovskite Cmcm-CaIrO3 using inelastic X-ray scattering. These materials are structural analogues to same phases of MgSiO3. Our results show that Cmcm-CaIrO3 is much more elastically anisotropic than Pbnm-CaIrO3, which offers an explanation for the enigmatic seismic wave velocity jump at the D′′ discontinuity. Considering the relation between lattice preferred orientation and seismic anisotropy in the D′′ layer, we suggest that the c axis of post-perovskite MgSiO3 aligns vertically beneath the Circum-Pacific rim, and the b axis vertically beneath the Central Pacific.
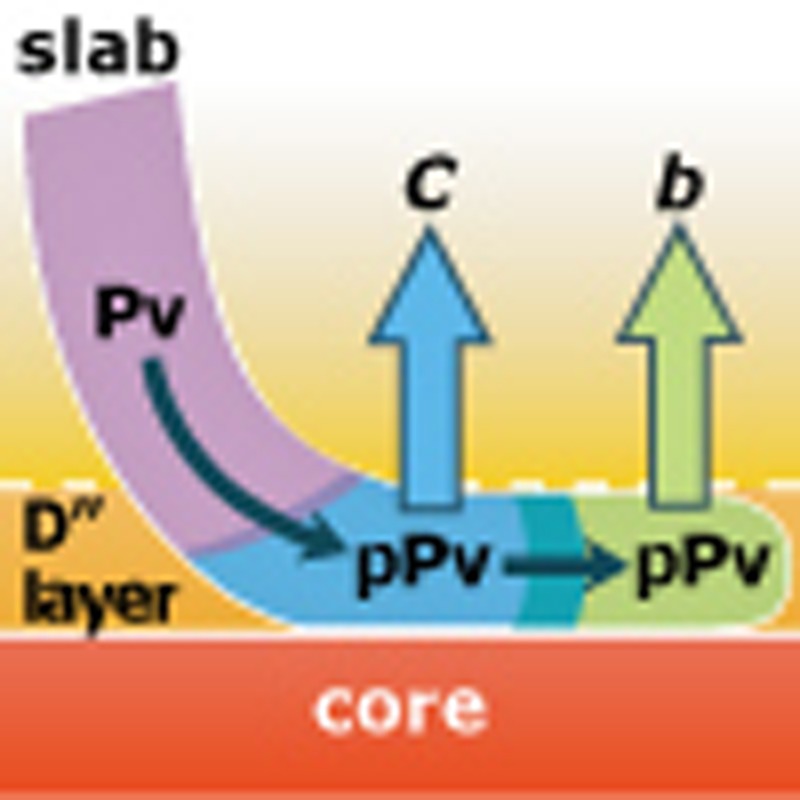 Seismological observations of the D′′ layer near the core–mantle boundary are difficult to interpret and the minerals present are unstable at ambient conditions. Yoneda et al. present experiments using analogues, suggesting the observations are due to preferred crystal orientations.
Since the discovery of the transition from perovskite (Pv) to post-perovskite (pPv) in MgSiO3 (refs 1, 2), pPv-MgSiO3 has been considered to be a major component of the D′′ layer just above the core–mantle boundary (CMB). Seismological observations of the D′′ layer are difficult to interpret as they suggest both non-uniform response at the layer boundary and non-uniform anisotropy inside the layer3,4,5. With this background, elastic anisotropy or single-crystal elasticity of pPv-MgSiO3 has been the focus of theoretical calculations6,7,8,9,10. However, no experimental data are available on the single-crystal elasticity of pPv-MgSiO3, because it is unstable at ambient pressure.
Cmcm-CaIrO3 or pPv-CaIrO3 has been frequently selected as a representative analogue of pPv-MgSiO3 (refs 11, 12, 13). According to the phase diagram14, pPv-CaIrO3 is the stable phase at ambient conditions and Pv-CaIrO3 is the high-temperature and low-pressure phase. Here we report the first experimental data on single-crystal elasticity of Pv and pPv structures in a homogeneous chemical composition of CaIrO3.
Results
Characterization of single-crystal specimen
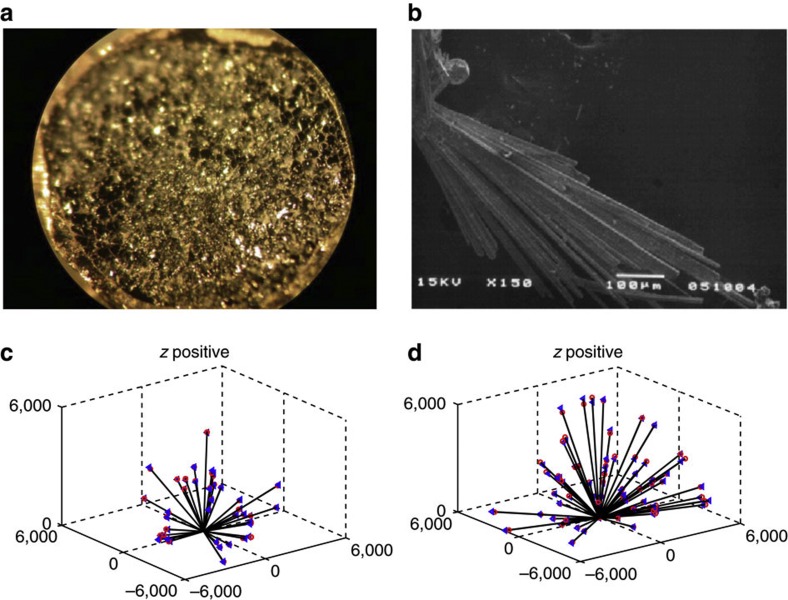
Figure 1a,b shows single crystals of Pv-CaIrO3 and pPv-CaIrO3 used in the present study. The Pv-CaIrO3 sample was synthesized at 2 GPa and 1,450 °C for 15 h in a piston cylinder apparatus at Okayama University. We produced many grains with size of a few tens of microns, although most of them turned out to have multiple domains. We examined more than 20 grains using a four-circle X-ray diffractometer at Yamaguchi University and selected a quasi-single-domain crystal with size of ~20 μm. Its lattice constants were determined as a=5.3527(1), b=5.5969(5) and c=7.6804(6) Å, which yields density (ρ) of 8,091 kg m−3. The pPv-CaIrO3 sample was synthesized by slow cooling from 1,000 °C in CaCl2 flux15. It had a pine-needle shape with length of a few 100 microns and width of a few 10s of microns. Its lattice constant and densities were respectively a=3.145(2), b=9.861(6), and c=7.297(5) Å, and ρ=8,211 kg m−3, which are consistent with literature values16.
Figure 1. Specimen and measurement data.
Left and right columns refer to Pbnm- and Cmcm-CaIrO3, respectively. (a,b) Photographs of single crystals used. The horizontal edge lengths are ~5 mm and ~800 μm, respectively, for a and b. (c,d) Overall picture for the experimental data and analytical fitting. Black lines indicate the direction of wave propagation in the crystal, and blue triangles and red circles are experimental velocities and recalculated values after least-squares analysis. The vertical direction is positive z direction, while horizontal leftward and rightward directions are positive x and y directions, respectively. Note that the difference between experimental and recalculated velocities is less than 5%. The misfit uniformly distributed indicates untwinned crystal specimens.
Inelastic X-ray scattering measurement and results
Figure 1c,d compare experimental velocities obtained from the inelastic X-ray scattering (IXS) spectra with velocities calculated from the optimized elastic constants. The details of the IXS measurement are described in the Methods section for the measurement of IXS at SPring-8 BL35XU; one of the important advantages of IXS compared with Brillouin scattering is its geometrical freedom (see Supplementary Methods). The analytical procedures for determining single-crystal elastic constants are described in the Methods section for data analysis for elastic constants. The measurement data are summarized in Supplementary Tables 1 and 2.
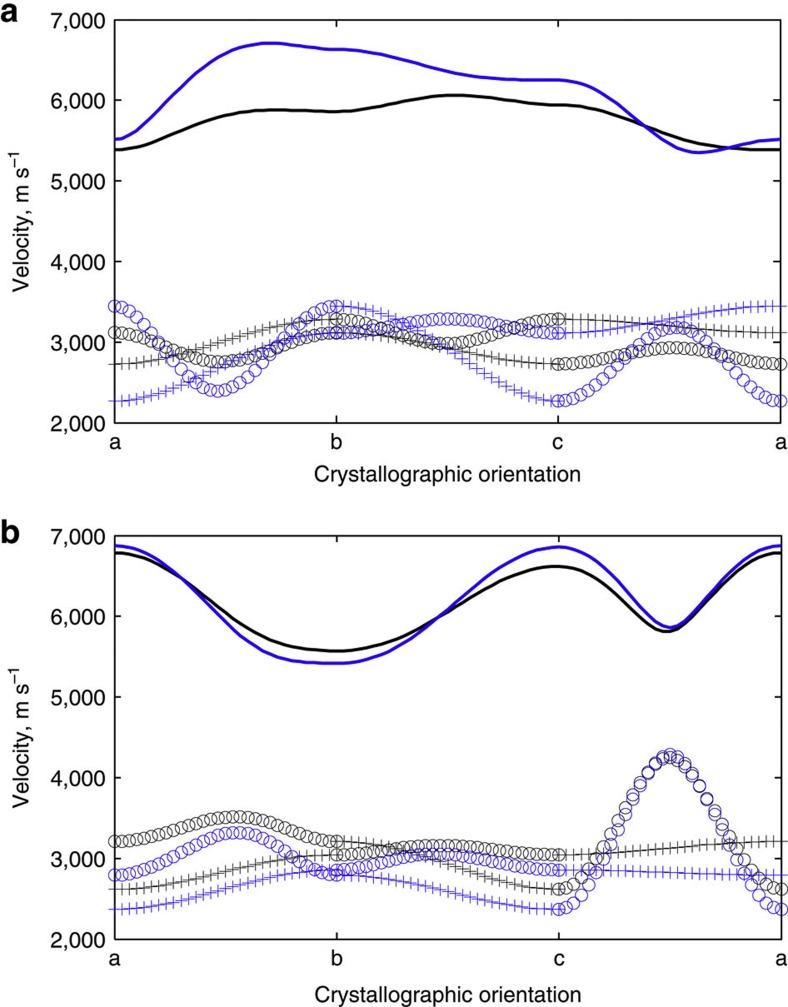
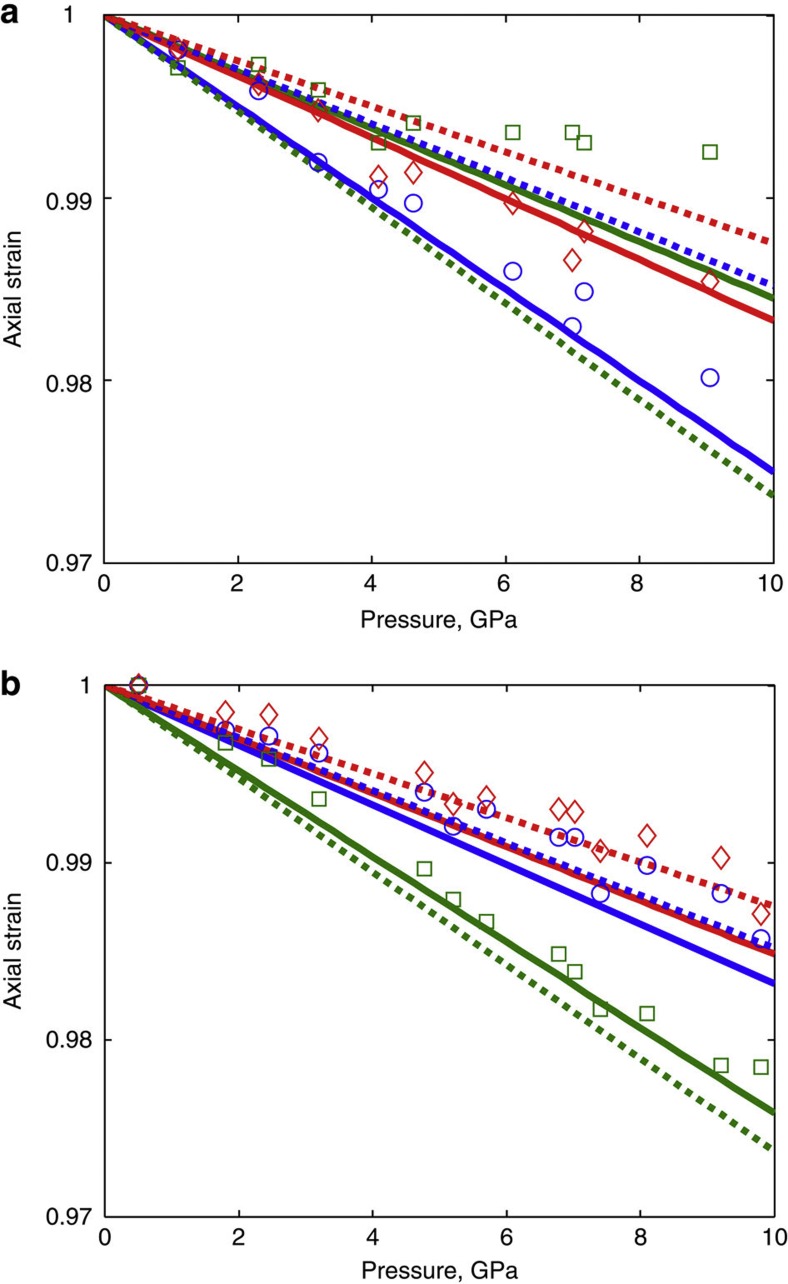
Table 1 summarizes the results of elastic constants and gives isotropic averages. The values are reasonably consistent with the theoretical results17 except for a few discrepancies. The high-pressure phase of pPv-CaIrO3 is less compressible than Pv-CaIrO3 whereas the theoretical prediction suggests the opposite relation. In addition, isotropic averages of VP and VS are significantly larger for pPv-CaIrO3 than for Pv-CaIrO3 according to the present results. Figure 2 compares the present results and theoretical calculations for the velocity surfaces of Pv-CaIrO3 and pPv-CaIrO3. We see fairly good agreement between the two results for pPv-CaIrO3, although we recognize significant differences between them for Pv-CaIrO3. Figure 3 shows the compatibility of the elastic constants with compression data18. The present data are consistent with the compression data for Pv- and pPv-CaIrO3; the theoretical result for Pv-CaIrO3, however, yields a different slope from the others.
Table 1. Single-crystal elastic moduli of Pbnm- and Cmcm-CaIrO3.
| C11 | C22 | C33 | C12 | C23 | C31 | C44 | C55 | C66 | KR | KH | GH | VP | VS | |
|---|---|---|---|---|---|---|---|---|---|---|---|---|---|---|
| Pbnm (Pv) | 235 (6) | 278 (6) | 286 (11) | 132 (6) | 138 (11) | 120 (10) | 87 (4) | 60 (2) | 79 (2) | 173 (6) | 174 (6) | 72 (2) | 5,776 (54) | 2,976 (42) |
| 248 | 359 | 319 | 204 | 162 | 115 | 79 | 42 | 97 | 195 | 202 | 68 | 6,001 | 2,892 | |
| Cmcm (pPv) | 378 (4) | 255 (11) | 360 (5) | 104 (7) | 137 (9) | 73 (6) | 76 (5) | 56 (2) | 85 (3) | 178 (4) | 179 (4) | 84 (1) | 5,955 (46) | 3,201 (27) |
| 388 | 241 | 386 | 121 | 149 | 85 | 67 | 46 | 64 | 186 | 189 | 98 | 5,913 | 2,990 |
Several isotropic moduli and velocities are shown on the right-hand side. The upper two rows are for Pbnm or Pv structure, while the lower two rows are for Cmcm or pPv structure. In each case, the first row gives the present experimental results with accuracy and the second row the theoretical results obtained by Tsuchiya and Tsuchiya17. The unit is ‘GPa’ except for velocities which have a unit of ‘m s−1’ in the last two columns. The numbers in parentheses correspond to fitting error in the least square analysis.
Figure 2. Velocity surface of Pbnm- and Cmcm-CaIrO3.
Upper (a) and lower (b) plots correspond to Pbnm- and Cmcm-CaIrO3, respectively. Black lines are drawn for the present results, while blue lines are drawn for the results obtained by Tsuchiya and Tsuchiya17. Upper lines correspond to the P-wave velocity, and lower lines to the S-wave velocity. Open circles ‘o’ and crosses ‘+’ for VS specify in-plane and out-of-plane particle motions.
Figure 3. Comparison of compression curves.
Upper (a) and lower (b) plots correspond to Pbnm- and Cmcm-CaIrO3, respectively. The lattice constants a, b, and c are shown in blue, green and red respectively. Solid and dotted lines are drawn for the present data and Tsuchiya’s theoretical data17, respectively, while symbols are the compression data.
Discussion
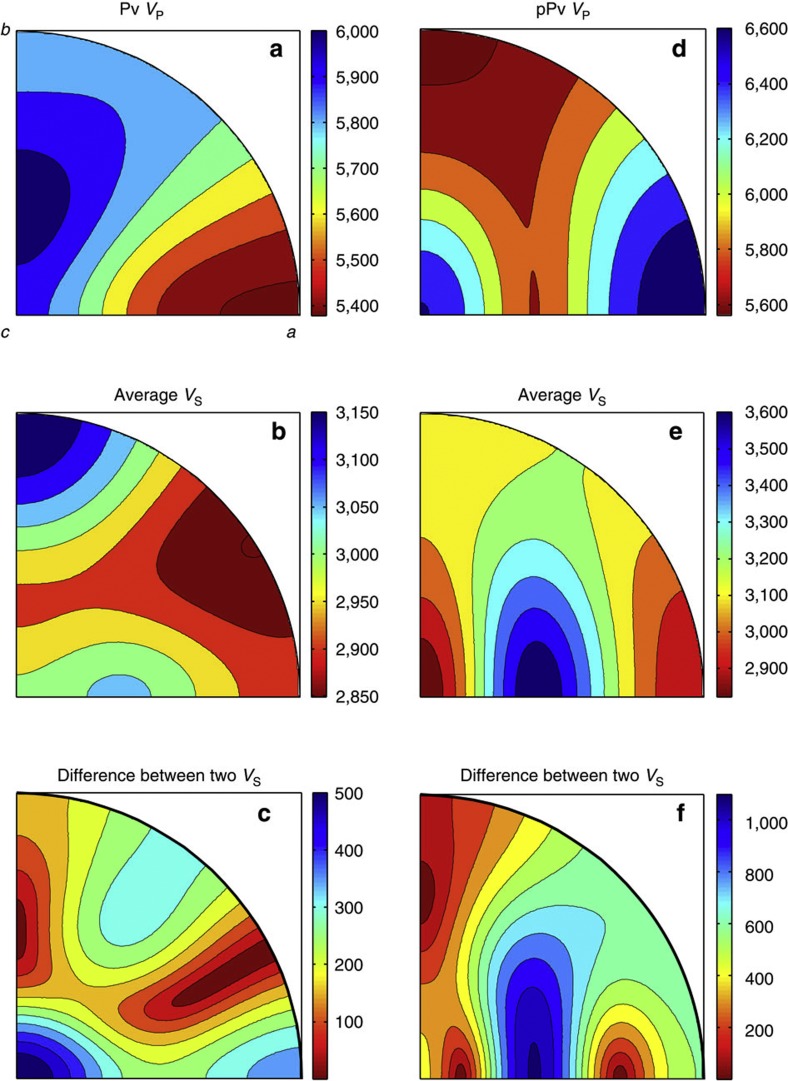
Figure 4 presents stereo projections of elastic wave velocities for Pv and pPv structures of CaIrO3. It shows that the ranges of variation of VP, the average of VS values, and the difference in VS values are ~600, ~300 and ~500 m s−1 for Pv-CaIrO3 and ~1,000, ~800 and ~1,100 m s−1, for pPv-CaIrO3, respectively. We see that pPv-CaIrO3 has approximately double the anisotropy of Pv-CaIrO3 in terms of the elastic wave velocity. For example, anisotropy in the polarization shear wave velocity is ~30% in pPv-CaIrO3 while it is only ~15% in Pv-CaIrO3.
Figure 4. Velocity surface of Pv- and pPv-CaIrO3.
Stereo projections of elastic wave velocities for Pv- and pPv-CaIrO3 based on the present results. The crystallographic directions, a, b, and, c, are identical in each plot as shown in (a). The unit of scale bars is m s−1. (a–c) VP, average of two VS values, and difference between two VS values, respectively, for Pv-CaIrO3. (d–f) Same as a, b, and c but for pPv-CaIrO3.
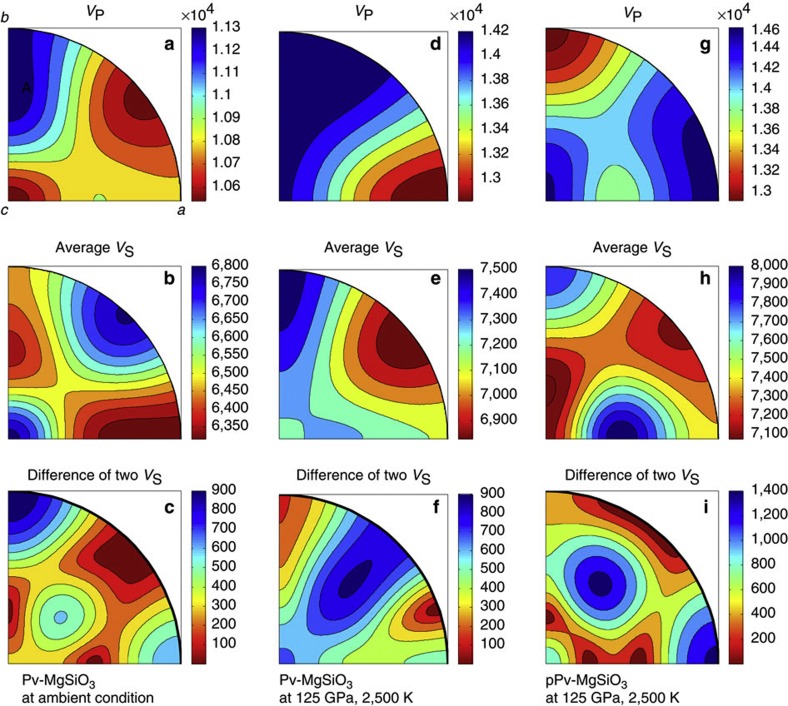
From Fig. 4d,e for pPv phase, the b axis is found to be the direction of the lowest VP, while the highest Vs is between the a and c axes. These pronounced features of the pPv elasticity are understandable as alternate stacking of compliant and stiff layers perpendicular to the b axis; the stiff layer has the largest shear wave constant and lowest longitudinal wave constant between a and c axes. We recognize similarity between a and c axes in pPv-CaIrO3 elasticity, while the a axis is slightly stiffer than the c axis in terms of both longitudinal and shear wave constants. The elasticity of Pv-CaIrO3 resembles that of Pv-MgSiO3 under lower-mantle conditions more than under ambient conditions (Fig. 5). Elasticity of Pv- and pPv-CaIrO3 under ambient conditions seems to be a good indicator of that of Pv- and pPv-MgSiO3 under lowermost mantle conditions; a conversion factor of 2.2–2.4 is found between them.
Figure 5. Stereo projections of elastic wave velocities for Pv- and pPv-MgSiO3.
The crystallographic directions, a, b, and, c, are identical in each plot as shown in (a). The unit of scale bars is m s−1, although a factor of 104 should be multiplied for VP. (a–c) VP, average of two VS values, and difference between two VS values, respectively, for Pv-MgSiO3 under ambient conditions. (d–f) and (g–i) Same as a, b, and c but for Pv-MgSiO3 and pPv-MgSiO3 at 125 GPa and 2,500 K10, respectively.
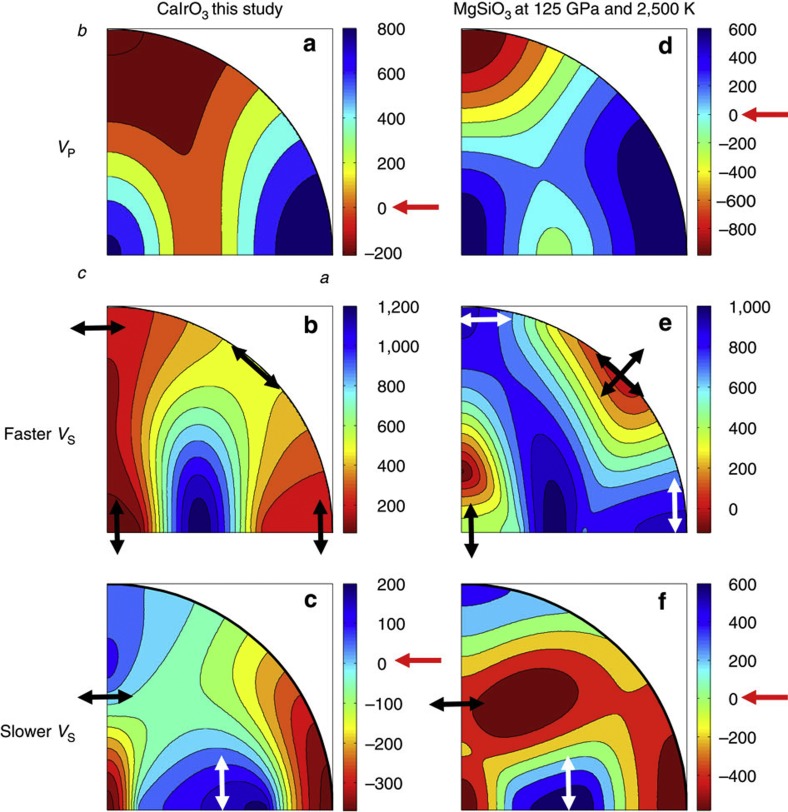
We interpret the D′′ diversity observed seismologically in terms of the single-crystal elasticity of Pv and pPv-CaIrO3. Significant anisotropy of the seismic wave velocity has been observed in the D′′ layer, while the lower mantle above the D′′ layer is nearly isotropic with a high degree of confidence19. Therefore, we plotted the velocity difference between anisotropic pPv and isotropic Pv both for CaIrO3 under ambient conditions and MgSiO3 under mantle conditions (Fig. 6). From the plots for VP and slower VS, we see that any velocity change over the D′′ discontinuity is possible both for P and S waves depending on the lattice preferred orientation (LPO) characteristics of the pPv phase.
Figure 6. Velocity difference between anisotropic pPv and isotropic Pv.
The left column presents the results for CaIrO3 in the present study, while the right column presents the theoretical calculation for MgSiO3 at 125 GPa and 2,500 K10. We recognize common characteristics among the plots for the two materials. Isotropic P-wave velocities of Pv are 5,774 and 13,900 m s−1 and S-wave velocities are 2,975 and 7,200 m s−1 for CaIrO3 and MgSiO3, respectively. The red arrows beside the scale bars highlight the origin of each scale bar, where the velocities of the two phases are the same. Typical polarizations of the S wave are shown by arrows in the S-wave plots. The crystallographic axes are identical for all plots as shown in plot a. In the stereo projections, the propagating waves in the a–b and c–a planes are shown along the quarter arc and the bottom edge, respectively. Note that the two polarization arrows in plot e between a and b axes suggest that the two S-wave velocities are nearly the same, as shown in Fig. 7.
The seismic wave phases used in the D′′ study (S, ScS, Sdiff) travel nearly horizontally in the D′′ layer4. Therefore, the two polarized S waves are classified as SH and SV, whose polarizations are in the horizontal and vertical directions, respectively. In seismological study, vertically transverse isotropy (VTI) and the tilted transverse isotropy have been assumed to explain S-wave polarization anisotropy in the D′′ layer4.
According to seismological studies, the region of the Circum-Pacific rim is interpreted as having VTI with VSH>VSV, while the region of the Central Pacific has complicated VTI without any fixed relation between VSH and VSV4. Polarization anisotropy is not recognized beneath the Atlantic Ocean, or the region is considered as having VTI with VSH≈VSV. On the other hand, from the polarization pattern in the a–b plane of the faster VS plot (Figs 2b and 7), we can expect that VSH>VSV in the D′′ layer if the c axis of pPv aligns vertically. Similarly, if the b axis aligns vertically, the magnitude relation between VSH and VSV can be complicated.
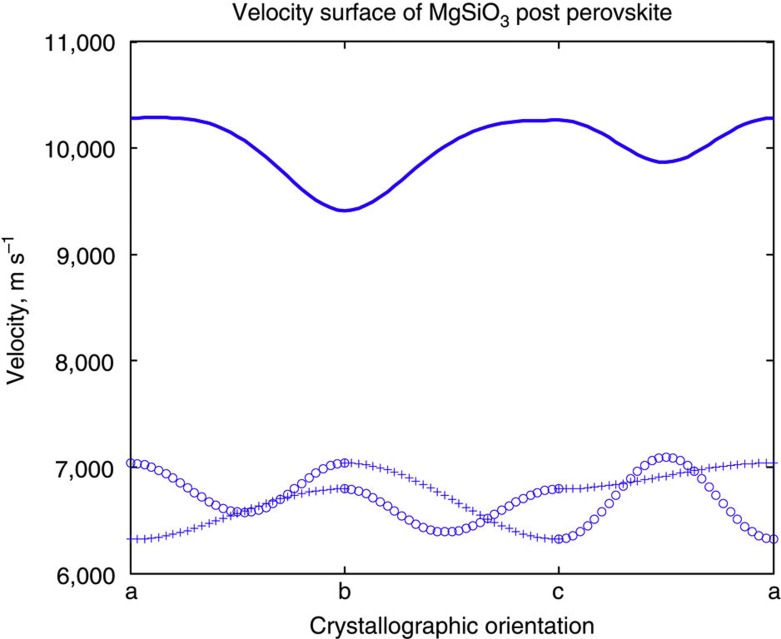
Figure 7. Velocity surfaces of pPv-MgSiO3 at 125 GPa and 2,500 K.
Blue lines are used to specify theoretical results similar to Fig. 2a,b. The upper line is the P-wave velocity and the lower lines are the S-wave velocities. Open circles ‘o’ and crosses ‘+’ for VS specify in-plane and out-of-plane particle motions.
We can summarize the above conclusion in an alternative way: For the c axis vertical case, horizontal wave propagation directions lie in the a–b plane, for which the in-plane shear mode (SH) has consistently higher wave speeds (Figs 2b and 7). If instead the b axis is vertical, horizontal wave propagation directions lie in the a–c plane, for which neither the in-plane (SH) nor the out-of-plane (SV) is consistently faster for all such propagation directions (Figs 2b and 7).
The dominant slip system of pPv-CaIrO3 was determined as [100](010) from shear deformation experiments11. Since the slip system of pPv-MgSiO3 has not yet been determined, we assumed that it is similar to that of pPv-CaIrO311. This assumption leads to LPO of pPv-MgSiO3, in which the b axis aligns vertically along the lateral flow in the D′′ layer. The LPO pattern is consistent with the complicated polarization S-wave anisotropy beneath the Central Pacific (Figs 2b and 7).
Although the texture development during Pv–pPv transition in MgSiO3 has not yet been clarified, we expect the c axis alignment of pPv-MgSiO3 immediately after the phase transition from Pv-MgSiO3 from analogy with the case for MgGeO3 (ref. 20). If the c axis aligns vertically, we expect VTI with VSH>VSV, which is consistent with the seismic feature beneath the Circum-Pacific rim.
Employing this conceptual scheme, we evaluated the feasibility of the LPO model of pPv in the D′′ layer. The volume ratio between (Mg, Fe)SiO3 Pv and (Mg, Fe)O ferropericlase (Fp) is 0.67:0.33 for the lower mantle21. We also used this ratio for (Mg, Fe)SiO3 pPv and Fp in the D′′ layer. This means that the anisotropy resulting from pPv LPO should be weakened by approximately two-thirds in the D′′ layer assuming isotropy of Fp. The observed polarization anisotropy of the S-wave velocity is ~3% at most4. Therefore, pPv in the D′′ layer is expected ~4.5% anisotropy to account ~3% anisotropy observed in the D” layer. This requirement is easily satisfied by partial LPO of pPv (Table 2).
Table 2. Characteristic velocities for crystals of post-perovskite structure.
| VP, km s−1 | VSH, km s−1 | VSV, km s−1 | VSH/VSV | ΔVS/VS | |
|---|---|---|---|---|---|
| pPv-CaIrO3 | |||||
| a–b plane | 6.1 (5) | 3.4 (1) | 2.8 (2) | 1.19 | 0.11 |
| b–c plane | 6.1 (4) | 3.1 (1) | 2.9 (2) | 1.06 | 0.07 |
| c–a plane | 6.3 (3) | 3.4 (6) | 3.1 (1) | 1.08 | 0.17 |
| pPv-MgSiO3 | |||||
| a–b plane | 14.0 (6) | 7.6 (3) | 7.1 (3) | 1.07 | 0.09 |
| b–c plane | 13.9 (6) | 7.2 (3) | 7.4 (5) | 0.98 | 0.07 |
| c–a plane | 14.2 (3) | 7.4 (6) | 7.8 (2) | 0.94 | 0.09 |
VP, VSH and VSV are the average velocities of the P wave, SH wave and SV wave, respectively, on each plane specified on the left. ΔVS is the maximum difference between the SH-wave and SV-wave velocities, and VS is the average of VSH and VSV on the corresponding plane. The source data for pPv-CaIrO3 and pPv-MgSiO3 are the results of the present IXS study and theoretical computation10, respectively. The numbers in parentheses correspond to expected uncertainty.
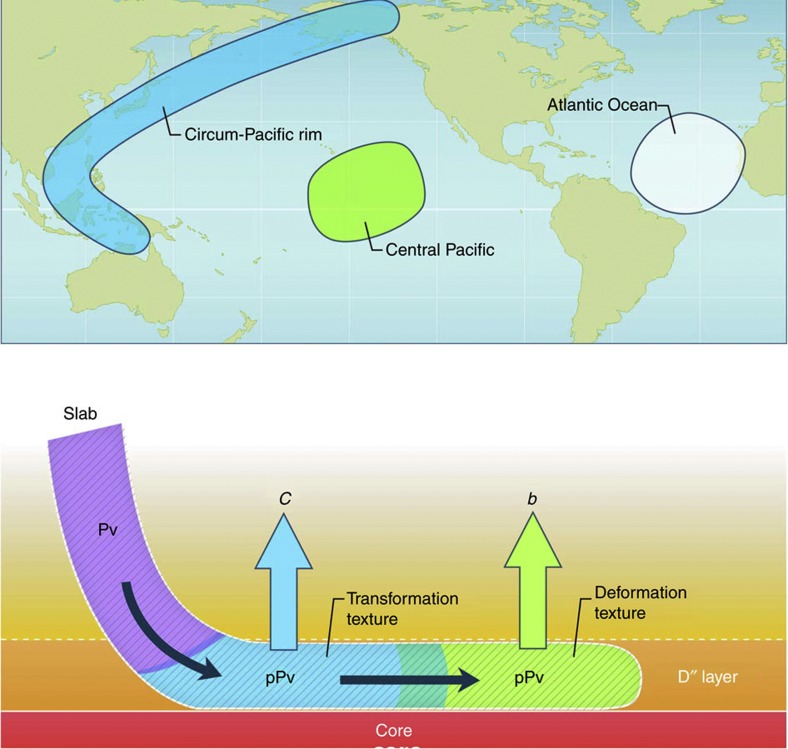
Figure 8 summarizes the present idea for seismic anisotropy and LPO structure in the D′′ layer. The VTI of the vertical c axis and that of the vertical b axis can be interpreted as transformation LPO and deformation LPO, respectively. It is noted that isotropic pPv-MgSiO3 is a reasonable interpretation for the seismic feature beneath the Atlantic Ocean; an alternative interpretation may be the VTI of the vertical a axis because of less lateral polarization anisotropy than in other cases (Table 2). The difference between beneath the Pacific and Atlantic may be attributed to differences in temperature, chemical composition and strain rate. The proposed LPO behaviour for pPv-MgSiO3 obtained from the present mineral physics perspective is consistent with seismic observation.
Figure 8. Schematic illustration of the LPO of pPv-MgSiO3 in the D′′ layer.
From a mineral physics viewpoint, the Pv slab (purple region) transforms to pPv (light blue region) and the pPv slab then moves along the path of mantle convection with deformation (light-green region). In contrast, from seismic observation, the region of the Circum-Pacific rim has VTI anisotropy of VSH>VSV, while the region of the Central Pacific has complicated VTI with any magnitude relation; that is, VSH>VSV, VSH<VSV or VSH≈VSV. The region of the Atlantic Ocean (white circle) has VTI with VSH≈VSV, suggesting isotropy or negligible LPO of pPv-MgSiO3. The speculated aligned axes of pPv LPO are shown by arrows for each region; the vertical c axis beneath the Circum-Pacific rim and the vertical b axis beneath the Central Pacific.
To summarize, we presented a new data set of Pv and pPv-CaIrO3 single-crystal elasticity by means of IXS at SPring-8. We used the present results to interpret seismic wave anisotropy in the D′′ layer, and proposed a model of pPv LPO in the D′′ layer consistent with seismic observations and mineral physics experiments on analogue materials. The present model may allow sophisticated discussion of global mantle convection, which is triggered by heating at the core–mantle boundary and modulated by lateral flow in the D′′ layer.
Methods
Measurement of IXS at SPring-8 BL35XU
The small size and black colour of the present samples limit the techniques that can be used to investigate the elastic properties. In particular, the crystal sizes are too small to employ GHz ultrasonic methods22 or resonant ultrasound spectroscopy23, where both need crystals larger than 100 μm. In addition, the crystal opacity makes it difficult to apply Brillouin scattering. Therefore, IXS with an X-ray beam diameter of ~70 μm was employed. Each specimen was attached to glass fibres (~100 μm in diameter) using manicure resin and mounted on the four-circle goniometer installed at BL35XU of SPring-8 (ref. 24). The incident X-ray beam energy was 17.794 and 21.747 keV for Pbnm-CaIrO3 and Cmcm-CaIrO3 measurements, respectively.
The IXS technique25,26 allows us to determine the elastic properties of a material by measuring the energies of acoustic longitudinal and shear phonon modes. When this information is combined with the precise reciprocal space position (momentum transfer) for each measurement, we can determine the sound velocity27,28. If measurements are made in many different directions, the velocity information can be combined with the density, allowing all the elastic constants of a material to be determined. In the present work, the two-dimensional, 4 × 3, analyser array of BL35XU is especially advantageous as it allows access to 12 different directions of momentum transfer simultaneously.
The IXS is applicable on opaque materials; it is the most important advantage of IXS against Brillouin scattering. Further characteristics and procedures of the IXS measurements are summarized in Supplementary Figs 1–5.
Data analysis for elastic constants
A least-squares fit to Christoffel equation was then used to determine the elastic constants29. Pv-CaIrO3 and pPv-CaIrO3 have orthorhombic symmetry and thus nine independent elastic constants. The six diagonal elastic constants (C11, C22, C33, C44, C55, C66) is related to nearly independent phonon modes propagating along crystallographic axes, while the three off-diagonal constants (C12, C23, C31) can be determined from combination of a few measurements. We carefully planned the measurement to acquire sufficient data to constrain all nine elastic constants. Using the analyser array, we obtained ~40 and ~60 mode energies for Pv-CaIrO3 and pPv-CaIrO3, respectively.
Author contributions
A.Y. and H.F. planned and managed the present study equally. F.X. prepared sample of Pbnm-CaIrO3. A.N. and A. Yoshiasa characterized single-crystal samples. Y.S. and K.O. joined the IXS measurement at SPring-8. S.T., H.U. and A.B. set up the instruments for the IXS measurement. A.Y. wrote the manuscript with input from H.F. and A.B.
Additional information
How to cite this article: Yoneda, A. et al. Elastic anisotropy of experimental analogues of perovskite and post-perovskite help to interpret D′′ diversity. Nat. Commun. 5:3453 doi: 10.1038/ncomms4453 (2014).
Supplementary Material
Supplementary Figures 1-5, Supplementary Tables 1-2, Supplementary Methods and Supplementary References
Acknowledgments
This work was supported in part by Grants-in-Aid for Scientific Research (Grant No. 22224008 awarded to A.Y.) from the Japan Society for the Promotion of Science. The inelastic X-ray scattering measurement was carried out on the BL35XU at SPring-8 (Proposal Nos. 2011B1425 and 2012A1406).
References
- Murakami M., Hirose K., Kawamura K., Sata N. & Ohishi Y. Post-perovskite phase transition in MgSiO3. Science 304, 855–858 (2004). [DOI] [PubMed] [Google Scholar]
- Oganov A. R. & Ono S. Theoretical and experimental evidence for a post-perovskite phase of MgSiO3 in the Earth’s D′′ layer. Nature 430, 445–448 (2004). [DOI] [PubMed] [Google Scholar]
- Wysession M. E. et al. InThe Core-Mantle Boundary Region, Geodynamics Vol. 28, eds Gurnis M.et al. American Geophysics Union (1998). [Google Scholar]
- Nowacki A., Wookley J. & Kendall J. M. New advances in using seismic anisotropy, mineral physics and geodynamics to understand deformation in the lowermost mantle. J. Geodyn. 52, 205–228 (2011). [Google Scholar]
- Lay T. & Garnero E. J. Deep mantle seismic modeling and imaging. Annu. Rev. Earth Planet. Sci. 39, 91–123 (2011). [Google Scholar]
- Iitaka T., Hirose K., Kawamura K. & Murakami M. The elasticity of the MgSiO3 post-perovskite phase in the lowermost mantle. Nature 430, 442–445 (2004). [DOI] [PubMed] [Google Scholar]
- Tsuchiya T., Tsuchiya J., Umemoto K. & Wentzcovitch R. M. Elasticity of post-perovskite MgSiO3. Geophys. Res. Lett. 31, L14603 (2004). [Google Scholar]
- Wookey J., Stackhouse S., Kendall J. M., Brodholt J. & Price G. D. Efficacy of the post-perovskite phase as an explanation for lowermost-mantle seismic properties. Nature 438, 1004–1007 (2005). [DOI] [PubMed] [Google Scholar]
- Stackhouse S., Brodholt J. P., Wookey J., Kendall J. M. & Price G. D. The effect of temperature on the seismic anisotropy of the perovskite and post-perovskite polymorphs of MgSiO3. Earth Planet. Sci. Lett. 230, 1–10 (2005). [Google Scholar]
- Wentzcovitch R. M., Tsuchiya T. & Tsuchiya J. MgSiO3 post perovskite at D’’ conditions. PNAS 103, 543–546 (2006). [DOI] [PMC free article] [PubMed] [Google Scholar]
- Yamazaki D., Yoshino T., Ohfuji H., Ando J. & Yoneda A. Origin of seismic anisotropy in the D" layer inferred from shear deformation experiments on post-perovskite phase. Earth Planet. Sci. Lett. 252, 372–378 (2006). [Google Scholar]
- Martin C. D. et al. Compression, thermal expansion, structure, and instability of CaIrO3, the structure model of MgSiO3 post-perovskite. Am. Mineral. 92, 1048–1053 (2007). [Google Scholar]
- Hunt S. A. et al. Weakening of calcium iridate during its transformation from perovskite to post-perovskite. Nat. Geosci. 2, 794–797 (2009). [Google Scholar]
- Hirose K. & Fujita Y. Clapeyron slope of the post-perovskite phase transition boundary in CaIrO3. Geophys. Res. Lett. 32, L13313 (2005). [Google Scholar]
- McDaniel C. L. & Schneider S. J. Phase relations in the CaO-IrO2-Ir system in air. J. Solid State Chem. 4, 275–280 (1972). [Google Scholar]
- Sugahara M. et al. Single-crystal X-ray diffraction study at CaIrO3. Am. Mineral. 93, 1148–1152 (2008). [Google Scholar]
- Tsuchiya T. & Tyuchiya J. Structure and elasticity of Cmcm CaIrO3 and their pressure dependence: Ab initio calculations. Phys. Rev. B 76, 144119 (2007). [Google Scholar]
- Niwa K., Yagi T. & Ohgushi K. Elasticity of CaIrO3 with perovskite and post-perovskite structure. Phys. Chem. Minerals 38, 21–31 (2011). [Google Scholar]
- Panning M. & Romanowicz B. A three-dimensional radially anisotropic model of shear velocity in the whole mantle. Geophys. J. Int. 167, 361–379 (2006). [Google Scholar]
- Miyagi L., Kanitpanyacharoen W., Stackhouse S., Militzer B. & Wenk H. R. The enigma of post-perovskite anisotropy: deformation versus transformation texture. Phys. Chem. Minerals 38, 665–678 (2011). [Google Scholar]
- Jackson I. Elasticity, composition and temperature of the Earth’s lower mantle: a reappraisal. Geophys. J. Int. 134, 291–311 (1998). [Google Scholar]
- Chen G., Spetzler H. A., Getting I. C. & Yoneda A. Cross temperature and pressure derivatives of selected elastic moduli for olivine from GHz ultrasonic interferometry. J. Geophys. Res. 101, 25161–25171 (1996). [Google Scholar]
- Yoneda A., Cooray T. & Shatskiy A. Single-crystal elasticity of stishovite: new experimental data obtained using high-frequency resonant ultrasound spectroscopy and a Gingham Check structure model. Phys. Earth Planet. Inter. 190-191, 80–86 (2012). [Google Scholar]
- Baron A. Q. R. et al. An X-ray scattering beamline for studying dynamics. J. Phys. Chem. Solids 61, 461–465 (2000). [Google Scholar]
- Sette F. et al. Collective dynamics in water by high-energy resolution inelastic X-ray-scattering. Phys. Rev. Lett 75, 850–853 (1995). [DOI] [PubMed] [Google Scholar]
- Burkel E. Phonon spectroscopy by inelastic x-ray scattering. Rep. Prog. Phys. 63, 171–231 (2000). [Google Scholar]
- Bosak A., Krisch M., Mohr M., Maultzsch J. & Thomson C. Elasticity of single-crystalline graphite: inelastic x-ray scattering study. Phys. Rev. B 75, 153408 (2007). [Google Scholar]
- Lin J. F., Mao Z., Yavaş H., Zhao J. & Dubrovinsky L. Shear wave anisotropy of textured hcp-Fe in the Earth's inner core. Earth Planet. Sci. Lett. 298, 361–366 (2010). [Google Scholar]
- Fukui H. et al. Precise determination of elastic constants by high-resolution inelastic X-ray scattering. J. Synchrotron Radiat. 15, 618–623 (2008). [DOI] [PubMed] [Google Scholar]
Associated Data
This section collects any data citations, data availability statements, or supplementary materials included in this article.
Supplementary Materials
Supplementary Figures 1-5, Supplementary Tables 1-2, Supplementary Methods and Supplementary References


