Abstract
Background
Good decision making about prostate-specific antigen (PSA) screening involves men considering how they value the different potential outcomes. The effects of different methods of helping men consider such values, however, is not clear.
Methods
We conducted a randomized trial to compare three methods of values clarification for decision making about PSA screening in average-risk men ages 50-70 from the US and Australia. Participants were drawn from online panels from a survey research firm in each country and were randomized by the survey firm to one of three values clarification methods (VCM): 1) a balance sheet, 2) rating and ranking task, and 3) a discrete choice experiment (DCE). The main outcome was the difference among groups in most important attribute, based on a single question post-VCM. Secondary outcomes include differences in unlabelled test choice and intent to screen.
Results
We enrolled 911 participants. Mean age was 59.8 years; most were Caucasian and over one-third graduated from college. Over 40% reported a PSA test within 12 months. Those who received the rating and ranking task (n= 307) were more likely to report reducing the chance of death from prostate cancer as being most important (54.4%), compared with either the balance sheet (n= 302, 35.1%) or DCE (n= 302, 32.4%) groups. (p< 0.0001) Those receiving the balance sheet were more likely (43.7%) to prefer the unlabelled PSA-like option (as opposed to the “no screening”-like option) compared with those who received rating and ranking (34.2%) or the DCE (20.2%). However, the proportion who intended to have PSA testing was high and did not differ between groups (balance sheet 77.1%; rating and ranking 76.8%; DCE 73.5%, p = 0.731).
Conclusions
Different values clarification methods produce different patterns of attribute importance and different preferences for screening when presented with an unlabelled choice.
Background
Whether to undergo prostate-specific antigen (PSA) screening is a difficult decision for middle-aged men. Prostate cancer is common, and causes over 28,000 deaths per year in the United States.1 However, PSA screening at best seems to produce only a small reduction in prostate cancer mortality and has considerable downsides.2 These downsides include increases in the number of prostate biopsies (which can be painful and have a risk of causing infection); over-diagnosis, (i.e., the detection of cancers that would never become clinically apparent or problematic); and increased treatment and treatment-related adverse effects (impotence and incontinence).3
High-quality decision processes, including whether or not to be screened for prostate cancer, should inform patients and incorporate patient values.4,5 Decision aids are tools that have been developed to help inform patients of their options related to preference-sensitive decisions, promote understanding of the benefits and downsides of these options, prompt consideration of one’s personal values, and encourage shared decision making.5 Decision aids have been shown to improve patient knowledge, reduce uncertainty and decisional conflict, and promote a shared decision making process for a range of conditions, including PSA screening.6,7
Consensus recommendations for high-quality decision aid design include incorporating some method for eliciting and clarifying patient values and preferences.5 However, the best method for eliciting and incorporating patient values and preferences is not clear.8, 9 Potential options for values elicitation include implicit techniques, in which patients receive information about different domains and are able to consider their potential value on their own (or with a prompt to “consider which factors are most important to you”), and several explicit techniques (e.g. rating, ranking, discrete choice methods) in which patients are asked specifically to compare the relative importance of several potentially relevant characteristics of a decision. Among decision psychologists, there remains considerable theoretical debate about the potential benefits and downsides of explicit techniques.10
Few previous studies have examined the effect of a decision aid with explicit values clarification compared with the same decision aid without explicit values clarification, or compared different values clarification techniques against one another. A recent review11 identified 13 comparative trials, and could not reach a conclusion about the effects of values clarification, as outcome measurement was inconsistent and results mixed. One of these studies12 examined PSA screening, and found no effect of adding a time trade-off task on knowledge, decisional conflict, or testing preference. In a small, single-site trial, we recently compared two different explicit techniques (discrete choice experiment vs. rating and ranking) for decision making about colorectal cancer screening and found some differences in reported most important attribute, but few other effects.13
To help better understand the effect of different values clarification methods, we conducted a randomized trial comparing an implicit method (provision of a balance sheet) and two explicit methods (a rating and ranking task and a discrete choice experiment) to determine whether they produce different effects on decision making about PSA screening.
Methods
Overview
We performed a randomized trial among male members of an online survey panel in the US and Australia who had indicated a willingness to complete surveys. Participants were asked to complete a baseline questionnaire, review basic information about the PSA decision, work through their assigned values clarification task, and then complete a post-task questionnaire.
Selection of attributes and levels
We described PSA screening decision options in terms of 4 key attributes: effect on prostate cancer mortality risk of biopsy, risk of being diagnosed with prostate cancer, and risk of becoming impotent or incontinent as a result of treatment. The attributes and the range of levels of the attributes included were based upon the existing literature, including recently reported randomized trials, and our own previous work. 14-16 See Table 1.
Table 1.
Attributes and levels for prostate cancer screening
| Attribute | Screening Levels | No Screening Level |
|---|---|---|
| Chance of being diagnosed with prostate cancer over 10 years |
|
|
| Chance of dying from prostate cancer over 10 years |
|
|
| Chance of having a prostate biopsy as a result of screening over 10 years |
|
|
| Chance of becoming impotent or incontinent as a result of screening over 10 years |
|
|
Balance Sheet Task
The balance sheet was based on modelling studies of PSA-related outcomes14, and was informed by randomized trials and observational evidence, as well as by our previous research in this area.16 (See Figure 1)
Figure 1.
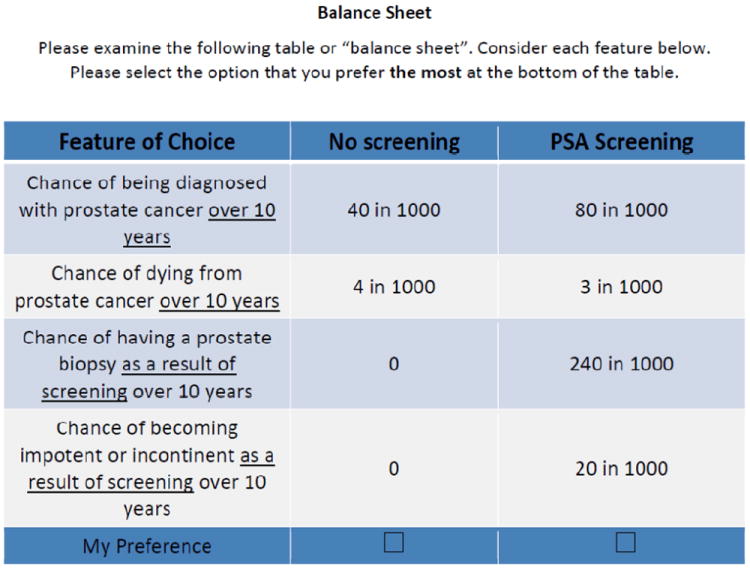
balance sheet
Rating and Ranking Task
The rating and ranking task asked participants to rate (on a scale of 0= not important at all to 5 = very important) and then rank the three most important screening test attributes from sets of the key attributes. (See Figure 2)
Figure 2.
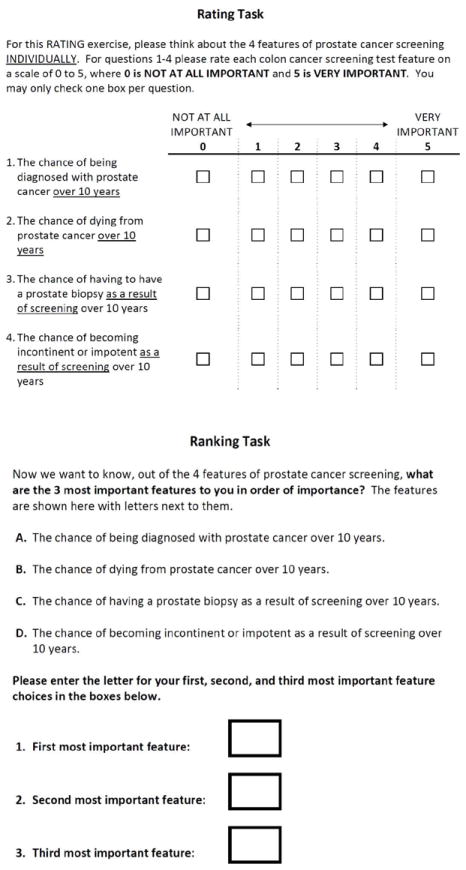
Rating and ranking task
Discrete choice experiment task
In discrete choice experiments (also known as choice-based conjoint analysis), respondents are asked to choose between hypothetical alternatives defined by a set of attributes.17-20 The method is based on the idea that goods and services, including health care services, can be described in terms of a number of separate attributes or factors. The levels of attributes are varied systematically in a series of questions. Respondents choose the option that they prefer for each question. People are assumed to choose the option that is most preferred, or has the highest “value” or “utility.” From these choices, a mathematical function is estimated which describes numerically the value that respondents attach to different choice options. Our study followed the ISPOR Guidelines for Good Research Practices for conjoint analysis in health.20
For the DCE, we used NGENE (www.choice-metrics.com) to generate a statistically efficient choice design that minimized sample size.21, 22 Our design required all participants in the DCE group to evaluate a set of 16 choice scenarios. An example choice task is shown in Figure 3. Each task included an active screening option and a fixed “no screening” option.
Figure 3.
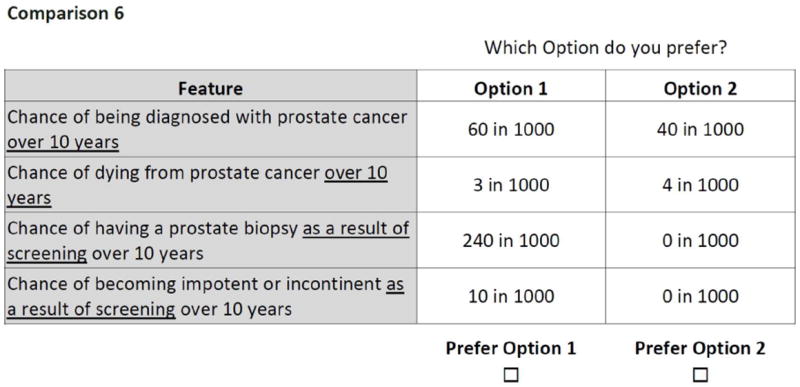
Example discrete choice question
Pretesting
We used online panels maintained by an international research firm, Survey Sampling International (SSI) to recruit 60 men (30 US, 30 Australia) to pre-test the surveys. Pilot data indicated that respondents were able to complete the values clarification tasks without difficulty. Based on information garnered from the pre-test, we modified the survey language slightly and removed the “I prefer neither option” response. Parameter estimates from analysis of the discrete choice pilot data were used to inform the final efficient design of the discrete choice task for the main study.
Participant eligibility and recruitment
We used the SSI online panels to recruit a target of 900 men (450 US, 450 Australia). Participants were average risk (no personal or family history of prostate cancer) and were originally targeted to be between the ages of 50 and 75; however, because SSI has few potential participants over age 70, the sample was instead drawn from men 50-70. Prior testing history was assessed but not used to determine eligibility. Those with visual limitations or inability to understand English were excluded.
Study flow
The entire study was performed online. After eligibility was determined and consent obtained, participants received basic information about prostate cancer and PSA screening (See eFigure 1), completed basic demographic questions, and were then randomized by SSI on a 1:1:1 basis, stratified by country, to: 1) an implicit values clarification method (a balance sheet of key test attributes); 2) a rating and ranking task; or 3) a discrete choice experiment (DCE). Upon task completion, participants then completed the post-task questionnaire.
Study Outcomes
Our main outcome of interest was the participant reported most important attribute (“Which ONE feature of prostate cancer screening is most important to you?” with responses chosen from: the chance of being diagnosed, the chance of dying over 10 years, the chance of requiring a biopsy from screening, the chance of becoming impotent or incontinent from treatment). We chose this outcome to determine if the values clarification method itself influenced how participants valued key features of the decision. Key secondary outcomes included testing preference, based on a question that included two unlabelled options described in terms of the key decision attributes and designed to mimic screening or no screening options (Figure 4) - we call this “unlabelled test preference”; the values clarity sub-scale of the Decisional Conflict Scale (DCS), which ranges from 0 to 100 with lower scores suggesting better clarity; and a single question about intent to be screened with PSA, based on a Likert scale (from strongly disagree to strongly agree, with agree and strongly agree considered as positive intent to be screened and as their labelled preference). In addition, we also report certain VCM task-specific outcomes.
Figure 4.
Study Flow Diagram
Statistical Analysis
We performed initial descriptive analyses with means and proportions. We used chi square and ANOVA for bivariate analyses across the three groups. Because of baseline demographic differences among groups, we then performed multivariate analyses using logistic regression, and adjusting for potential confounders, including age, race, education, income, and prior PSA testing. We also examined whether there was effect modification based on prior PSA screening or country. Because we identified no important effect modification, we present non-stratified results here. A separate paper will examine differences in study outcomes for US vs. Australian participants. We used a mixed multinomial logit (MMNL) (also known as a random parameters logit) model with a panel specification23, 24 to assess differences in preference structure between respondents from the US and Australia within the DCE arm (see eAppendix for details).
Ethical considerations
This study was approved by the University of North Carolina- Chapel Hill Institutional Review Board on April 28, 2011 (Study number 11-0861) and is registered through ClinicalTrials.gov site (NCT01558583).
Results
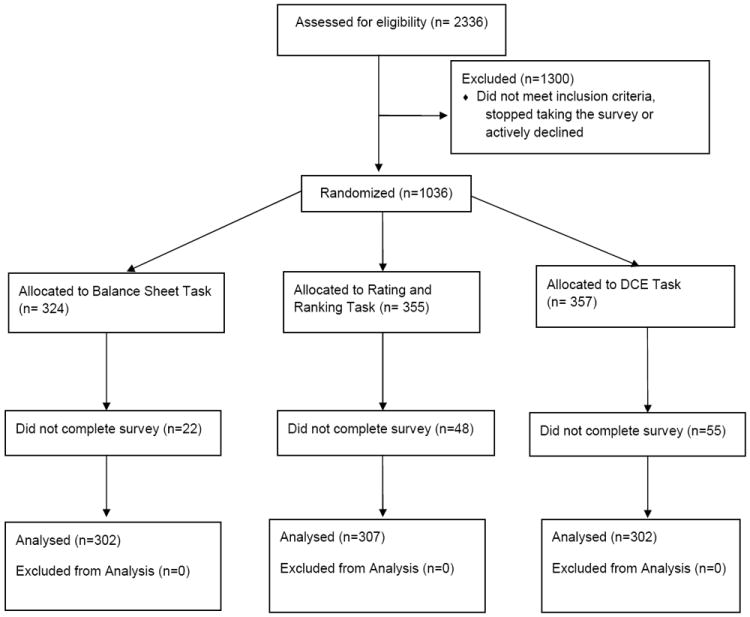
We screened 2,336 individuals from October, 12 – 27, 2011. Of these, 1300 were ineligible or declined participation and 1,036 were randomized. Of these 1,036, 911 (87.9%) completed the full survey (Figure 5). Mean time to complete the survey was 8 minutes, 46 seconds (range 1:16 – 39:32), and differed between groups (balance sheet 6:58, rating/ranking 7:57, DCE 11:24, p < 0.0001). Participant characteristics are shown in Table 2. We noted potentially important differences across randomization groups in the proportion of White participants and the proportion reporting PSA testing within the past 12 months.
Figure 5.
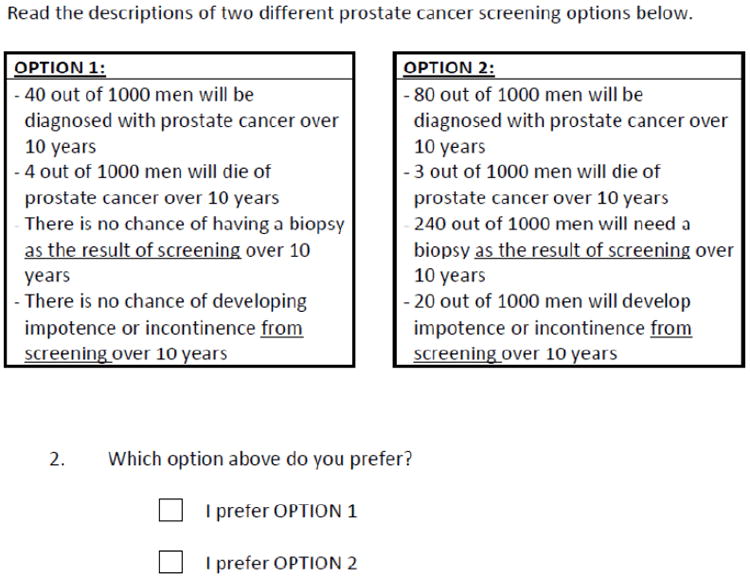
Unlabeled Test Preference Question
Table 2.
characteristics of participants overall and by group
| Overall (n=911) | Balance sheet (n=302) | Rating and Ranking (n=307) | DCE (n=302) | p-value | |
|---|---|---|---|---|---|
| Mean age (SD) | 59.8 (5.6) | 59.8 (5.6) | 59.9 (5.7) | 59.6 (5.5) | p = 0.77 |
| Country | p = 0.948 | ||||
| US | 50.1% | 49.7% | 50.8% | 49.7% | |
| Australia | 49.9% | 50.3% | 49.2% | 50.3% | |
| Ethnicity (% White) | 88.0% | 90.4% | 91.9% | 81.8% | p < 0.0001 |
| Education | p = 0.82 | ||||
| Less than high school graduate | 7.3% | 8.3% | 6.8% | 6.6% | |
| High school graduate or some college | 56.3% | 56.9% | 58.3% | 53.7% | |
| College graduate | 36.4% | 34.8% | 34.9% | 39.7% | |
| Income | p=0.95 | ||||
| <$30,000 | 24.0% | 21.9% | 27.4% | 24.0% | |
| $30,000-59,999 | 30.4% | 33.8% | 28.3% | 29.1% | |
| >= $60,000 | 45.6% | 44.3% | 44.3% | 46.9% | |
| Employment | p=0.58 | ||||
| Employed | 36.4% | 37.4% | 36.8% | 35.1% | |
| Retired | 39.3% | 39.4% | 38.8% | 39.7% | |
| PSA testing | p=0.06 | ||||
| within past year | 42.0% | 47.0% | 39.7% | 39.4% | |
| > 1 year ago | 20.9% | 19.9% | 21.5% | 21.2% | |
| Never / don’t know | 37.1% | 33.1% | 38.8% | 39.4% |
Main outcomes
The three different values clarification methods produced differences in the participant reported most important attribute from the single post-task questionnaire: those who received the rating and ranking task were more likely (54.4%) to report reducing the chance of death from prostate cancer as being most important, compared with either the balance sheet (35.1%) or DCE groups (32.5%). See Table 3. Adjustment for potential confounders, including age, race, education, income, and prior PSA testing, did not affect the findings.
Table 3.
proportion of respondents designating specific attributes as most important (single question) by values clarification task
| Attribute | Balance sheet (n=302) | Rating and Ranking (n=307) | DCE (n=302) |
|---|---|---|---|
| Chance of being diagnosed with prostate cancer | 35.8% | 22.5% | 31.3% |
| Chance of dying from prostate cancer | 35.1% | 54.4% | 32.5% |
| Chance of requiring a biopsy as a result of screening | 10.9% | 8.8% | 13.9% |
| Chance of developing impotence or incontinence as a result of screening | 18.2% | 14.3% | 22.5% |
Pearson chi2 (6) = 39.9882 p < 0.0001
In terms of unlabelled test preference, those receiving the balance sheet (43.7%) were more likely to prefer the PSA-like option (as opposed to the no screening option), compared with those who received rating and ranking (34.2%) or the DCE (20.2%), p < 0.0001. Again, findings were similar after adjustment for potential confounders. Those choosing the screening option were somewhat more likely to select mortality reduction as most important (47%) than those choosing the “no screening” option (37%); conversely, those choosing no screening were more likely to select the chance of developing impotence or incontinence as most important (22%) compared with those choosing screening (10%).
However, the proportion of participants who agreed or strongly agreed that they intended to have PSA testing when labelled as such was high and did not differ between groups (balance sheet 77.1%; rating and ranking 76.8%; DCE 73.5%, p = 0.731) Mean values clarity score was low (suggesting a high degree of clarity) and did not differ importantly between groups, despite the difference being statistically significant. (balance sheet 22.5; rating and ranking 19.0; and DCE 20.3, p=0.0276)
Method-specific outcomes
Among the 302 participants randomized to the balance sheet, 65.6% of participants chose the labelled PSA testing option. Agreement between test preference from the balance sheet and the unlabelled test preference question was low. (eTable 1.)
For the rating and ranking group (n=307), chance of being diagnosed with prostate cancer and chance of dying from prostate cancer were each rated slightly higher in importance (3.8 for each) compared with chance of needing a biopsy (3.5) or chance of developing impotence of incontinence from screening (3.6). A majority (52.8%) of the 302 participants in this group ranked the chance of dying from prostate cancer as most important. Agreement between the ranking task and the single question about most important attribute from the post-task questionnaire was modest: 71 of 307 participants (23%) chose different attributes as most important on the single question compared with their ranking. (eTable 2).
For the 302 participants randomized to the DCE, the mean part-worth utilities are shown in eTable 3. All attributes performed in the direction expected: more value was attached to lower chance of dying from prostate cancer, lower risk of being diagnosed, and lower chance of impotence or incontinence compared with higher levels. There were no significant differences in utility based on chance of needing a biopsy. The attribute most likely to be chosen as the most important one, based on DCE-derived importance scores, was the chance of dying from prostate cancer (chosen by 53.5% of participants).
Comment
Different methods of values clarification produced different patterns of attribute importance and different preferences for PSA testing when presented with unlabelled testing options designed to correspond to the PSA test and the option of not being screened. Those receiving the rating and ranking task were more likely to select reduction in prostate cancer mortality as most important compared with those assigned to the balance sheet or DCE; those receiving the balance sheet were more likely to select the unlabelled option that corresponded with the PSA test than those assigned to rating and ranking or the DCE. Those assigned to the DCE were somewhat less likely to select reduction of mortality as most important, and were least likely to select the PSA-like option on the unlabelled preference question. These findings are consistent with the theory that DCE encourages people to more fully consider all attributes and not rely on simple heuristics.25
However, there was high intent to be screened and no difference between groups when asked directly with a labelled question. Among those in the balance sheet group, there were moderately large differences in the proportion selecting PSA screening when it was presented as a labelled vs. an unlabelled choice. Mean values clarity sub-scale was low across all three groups, suggesting that most users were clear about their values after completing their task.
These findings have several implications. First, they suggest that the method of values clarification chosen affects how participants report their values (in terms of most important attribute) in this sample of online panel members making hypothetical choices. The DCE may have led to more deliberation and hence less monolithic results for attribute importance; conversely, the rating and ranking may have focused respondents more on the most “accessible” attribute: mortality reduction. Our current study cannot determine which technique is “better” or a more accurate reflection of each man’s true values; additional, larger studies should be performed that examine men making actual screening decisions, account for other factors affecting decisions, and include longitudinal follow-up to allow measurement of more distal outcomes such as appropriate test use (test received by those who prefer it and not received by those who choose against it), decision satisfaction, and decisional regret.
Second, this study shows the potentially large effect of labelling on decision making. The proportion of men in the balance sheet arm who chose labelled PSA testing on the balance sheet (65.6%) was higher than the proportion choosing the unlabelled but otherwise identical PSA-like option immediately afterwards (43.7%). Labelling may affect preferences by different mechanisms: it can allow decision makers to “value” important aspects of the decision that are not reflected in the attributes we used to describe the tests – this could be a desirable effect. However, labelling may also allow decision makers to simply choose the familiar option, which can help resolve cognitive dissonance but may not reflect one’s underlying values.26 More studies, including qualitative work, are needed to “unpack” the causes of this labelling effect.
Our study adds to the limited body of research examining the effects of explicit values clarification methods, versus no values clarification, implicit methods, or other explicit methods.11 Other studies have found inconsistent effects of values clarification, including one study in PSA screening.12
The USPSTF recently revised its PSA screening recommendation for middle-aged men, changing to a “D” recommendation (against routine screening).27 Although it is clear that PSA screening has important downsides, the possibility of a rare benefit in terms of prostate cancer mortality reduction and the preference patterns noted in our survey may warrant a shared decision making process.
More studies, conducted in a range of different conditions, using a range of different methods, are required to better determine the best approach (if any) to values clarification. Decision aids with explicit clarification techniques should be compared against decision aids with no or only implicit values clarification to best understand their effects on decision making processes and actual decisions. Because decision aids can be difficult to implement, especially for common decisions like PSA screening, decision aid developers should only include values clarification methods if they improve the decision making process in some meaningful way.
Our study, while helpful in building the evidence base in this area, has a few key limitations that must be considered. First, we used a hypothetical scenario; whether the effects we observed would differ in men actually making the screening decision is unknown. To mitigate this concern, we enrolled only men of screening age and asked them to answer as if they were actually deciding. Secondly, we cannot directly determine, on an individual level, whether a good decision making process was followed or whether a good decision was made; larger studies, with more distal outcomes, are required. Third, we did not conduct our trial within a full PSA screening decision aid; however, the information that we provided to participants contained the key elements for a decision aid (definition of the decision, pros and cons of the options; encouragement to consider one’s values).5 Future studies should compare different values clarification techniques embedded within a full decision aid. Fourth, participants in this study were drawn from an online panel and may not be completely representative of the population of US and Australian middle men in this age group. Fifth, randomization produced some differences in baseline characteristics between VCM groups. We adjusted for these differences and did not see effects on our results. Finally, we did not measure whether our participants were informed and engaged when they provided their answers.
In conclusion, different values clarification techniques affected how men valued different aspects of the decision to undergo PSA screening and also influenced unlabelled test choice. Intent to be screened with PSA was higher than the preference for PSA when assessed via unlabelled question, suggesting a strong effect of the label itself. Further studies with more distal outcome measures are needed to determine the best method of values clarification, if any, for decisions like whether to screen with PSA.
Supplementary Material
Acknowledgments
Funding
This study was funded by the University of North Carolina Cancer Research Fund. Dr. Pignone and Ms. Crutchfield are also supported by an Established Investigator Award from the National Cancer Institute K05 CA129166
Footnotes
Authors’ contributions
All authors were responsible for the conceptual design of the study, participated in revisions to the study design and approved the final study design. TC and KH obtained the data from SSI; KH and MP performed all key analyses. MP drafted the manuscript; all other authors were involved in overall revision of the manuscript. All authors have read and approved the final manuscript.
Competing Interests
The authors declare that they have no competing interests.
References
- 1.American Cancer Society. Cancer Facts & Figures 2012. 2012 http://www.cancer.org/acs/groups/content/@epidemiologysurveilance/documents/document/acspc-031941.pdf.
- 2.Schroder FH, Hugosson J, Roobol MJ, et al. Prostate-cancer mortality at 11 years of follow-up. N Engl J Med. 2012 Mar 15;366(11):981–990. doi: 10.1056/NEJMoa1113135. [DOI] [PMC free article] [PubMed] [Google Scholar]
- 3.Chou R, Croswell JM, Dana T, et al. Screening for prostate cancer: a review of the evidence for the U.S. Preventive Services Task Force. Ann Intern Med. 2011 Dec 6;155(11):762–771. doi: 10.7326/0003-4819-155-11-201112060-00375. [DOI] [PubMed] [Google Scholar]
- 4.Braddock CH, 3rd, Edwards KA, Hasenberg NM, Laidley TL, Levinson W. Informed decision making in outpatient practice: time to get back to basics. JAMA. 1999 Dec 22-29;282(24):2313–2320. doi: 10.1001/jama.282.24.2313. [DOI] [PubMed] [Google Scholar]
- 5.Elwyn G, O’Connor A, Stacey D, et al. Developing a quality criteria framework for patient decision aids: online international Delphi consensus process. BMJ. 2006 Aug 26;333(7565):417. doi: 10.1136/bmj.38926.629329.AE. [DOI] [PMC free article] [PubMed] [Google Scholar]
- 6.Stacey D, Bennett CL, Barry MJ, et al. Decision aids for people facing health treatment or screening decisions. Cochrane Database Syst Rev. 2011;(10) doi: 10.1002/14651858.CD001431.pub3. CD001431. [DOI] [PubMed] [Google Scholar]
- 7.Sheridan SL, Harris RP, Woolf SH. Shared decision making about screening and chemoprevention. a suggested approach from the U.S. Preventive Services Task Force. Am J Prev Med. 2004 Jan;26(1):56–66. doi: 10.1016/j.amepre.2003.09.011. [DOI] [PubMed] [Google Scholar]
- 8.O’Connor AM, Bennett C, Stacey D, et al. Do patient decision aids meet effectiveness criteria of the international patient decision aid standards collaboration? A systematic review and meta-analysis. Med Decis Making. 2007 Sep-Oct;27(5):554–574. doi: 10.1177/0272989X07307319. [DOI] [PubMed] [Google Scholar]
- 9.Elwyn G, O’Connor AM, Bennett C, et al. Assessing the quality of decision support technologies using the International Patient Decision Aid Standards instrument (IPDASi) PLoS One. 2009;4(3):e4705. doi: 10.1371/journal.pone.0004705. [DOI] [PMC free article] [PubMed] [Google Scholar]
- 10.Wilson TD, Schooler JW. Thinking too much: introspection can reduce the quality of preferences and decisions. J Pers Soc Psychol. 1991 Feb;60(2):181–192. doi: 10.1037//0022-3514.60.2.181. [DOI] [PubMed] [Google Scholar]
- 11.Fagerlin A, Pignone M, A P, et al. Clarifying and expressing values. In: Volk R, H L-T, editors. 2012 Update of the International Decision Aids Standards (IPDAS) Collaboration’s Background Document. 2012. [Google Scholar]
- 12.Frosch DL, Bhatnagar V, Tally S, Hamori CJ, Kaplan RM. Internet patient decision support: a randomized controlled trial comparing alternative approaches for men considering prostate cancer screening. Arch Intern Med. 2008 Feb 25;168(4):363–369. doi: 10.1001/archinternmed.2007.111. [DOI] [PubMed] [Google Scholar]
- 13.Pignone MP, Brenner AT, Hawley S, et al. Conjoint analysis versus rating and ranking for values elicitation and clarification in colorectal cancer screening. J Gen Intern Med. 2012 Jan;27(1):45–50. doi: 10.1007/s11606-011-1837-z. [DOI] [PMC free article] [PubMed] [Google Scholar]
- 14.Howard K, Barratt A, Mann GJ, Patel MI. A model of prostate-specific antigen screening outcomes for low- to high-risk men: information to support informed choices. Arch Intern Med. 2009 Sep 28;169(17):1603–1610. doi: 10.1001/archinternmed.2009.282. [DOI] [PubMed] [Google Scholar]
- 15.Howard K, Salkeld G. Does attribute framing in discrete choice experiments influence willingness to pay? Results from a discrete choice experiment in screening for colorectal cancer. Value Health. 2009 Mar-Apr;12(2):354–363. doi: 10.1111/j.1524-4733.2008.00417.x. [DOI] [PubMed] [Google Scholar]
- 16.Howard K, Salkeld GP, Mann GJ, et al. The COMPASs Study: Community Preferences for Prostate cAncer Screening. Protocol for a quantitative preference study. BMJ Open. 2012;2(1):e000587. doi: 10.1136/bmjopen-2011-000587. [DOI] [PMC free article] [PubMed] [Google Scholar]
- 17.Lancsar E, Louviere J. Conducting discrete choice experiments to inform healthcare decision making: a user’s guide. Pharmacoeconomics. 2008;26(8):661–677. doi: 10.2165/00019053-200826080-00004. [DOI] [PubMed] [Google Scholar]
- 18.Bridges JF, Kinter ET, Kidane L, Heinzen RR, McCormick C. Things are Looking up Since We Started Listening to Patients: Trends in the Application of Conjoint Analysis in Health 1982-2007. Patient. 2008 Dec 1;1(4):273–282. doi: 10.2165/01312067-200801040-00009. [DOI] [PubMed] [Google Scholar]
- 19.Marshall D, Bridges JF, Hauber B, et al. Conjoint Analysis Applications in Health - How are Studies being Designed and Reported?: An Update on Current Practice in the Published Literature between 2005 and 2008. Patient. 2010 Dec 1;3(4):249–256. doi: 10.2165/11539650-000000000-00000. [DOI] [PubMed] [Google Scholar]
- 20.Bridges JF, Hauber AB, Marshall D, et al. Conjoint analysis applications in health--a checklist: a report of the ISPOR Good Research Practices for Conjoint Analysis Task Force. Value Health. 2011 Jun;14(4):403–413. doi: 10.1016/j.jval.2010.11.013. [DOI] [PubMed] [Google Scholar]
- 21.Huber J, Zwerina K. The Importance of Utility Balance in Efficient Choice Designs. Journal of Marketing Research (JMR) 1996;33(3):307–317. [Google Scholar]
- 22.Sándor Z, Wedel M. Profile Construction in Experimental Choice Designs for Mixed Logit Models. Marketing Science. 2002 Fall;21(4):455–475. [Google Scholar]
- 23.Hensher DA, Rose JM, Greene WH. Applied choice analysis : a primer. Cambridge; New York: Cambridge University Press; 2005. [Google Scholar]
- 24.Hensher D, Greene W. The Mixed Logit model: The state of practice. Transportation. 2003;30(2):133–176. [Google Scholar]
- 25.Ryan M, Watson V, Entwistle V. Rationalising the ‘irrational’: a think aloud study of discrete choice experiment responses. Health Econ. 2009 Mar;18(3):321–336. doi: 10.1002/hec.1369. [DOI] [PubMed] [Google Scholar]
- 26.de Bekker-Grob EW, Hol L, Donkers B, et al. Labeled versus unlabeled discrete choice experiments in health economics: an application to colorectal cancer screening. Value Health. 2010 Mar-Apr;13(2):315–323. doi: 10.1111/j.1524-4733.2009.00670.x. [DOI] [PubMed] [Google Scholar]
- 27.Moyer VA. Screening for prostate cancer: U.S. Preventive Services Task Force recommendation statement. Ann Intern Med. 2012 Jul 17;157(2):120–134. doi: 10.7326/0003-4819-157-2-201207170-00459. [DOI] [PubMed] [Google Scholar]
Associated Data
This section collects any data citations, data availability statements, or supplementary materials included in this article.


