

Abstract
Colorectal cancer (CRC) is the second largest cause of cancer deaths in the United States. A key barrier that prevents better outcomes for this type of cancer as well as other solid tumors is the lack of effective therapies against the metastatic disease. Thus there is an urgent need to fill this gap in cancer therapy. We utilized a 2D-DIGE proteomics approach to identify and characterize proteins that are differentially regulated between primary colon tumor and liver metastatic deposits of the IGF1R-dependent GEO human CRC xenograft, orthotopically implanted in athymic nude mice that may serve as potential therapeutic targets against CRC metastasis. We observed increased expression of ezrin in liver metastasis in comparison to the primary colonic tumor. Increased ezrin expression was further confirmed by western blot and microarray analyses. Ezrin, a cytoskeletal protein belonging to Ezrin-Radixin-Moesin (ERM) family plays important roles in cell motility, invasion and metastasis. However, its exact function in colorectal cancer is not well characterized. Establishment of advanced GEO cell lines with enhanced liver-metastasizing ability showed a significant increase in ezrin expression in liver metastasis. Increased phosphorylation of ezrin at the T567 site (termed here as p-ezrin T567) was observed in liver metastasis. IHC studies of human CRC patient specimens showed an increased expression of p-ezrin T567 in liver metastasis compared to the primary tumors of the same patient. Ezrin modulation by siRNA, inhibitors and T567A/D point mutations significantly downregulated inhibitors of apoptosis (IAP) proteins XIAP and survivin that have been linked to increased aberrant cell survival and metastasis and increased cell death. Inhibition of the IGF1R signaling pathway by humanized recombinant IGF1R monoclonal antibody MK-0646 in athymic mouse subcutaneous xenografts resulted in inhibition of p-ezrin T567 indicating ezrin signaling is downstream of the IGF1R signaling pathway. We identified increased expression of p-ezrin T567 in CRC liver metastasis in both orthotopically implanted GEO tumors as well as human patient specimens. We report for the first time that p-ezrin T567 is downstream of the IGF1R signaling and demonstrate that ezrin regulates cell survival through survivin/XIAP modulation.
Keywords: Colorectal cancer metastasis, Cell survival signaling, 2D-DIGE Proteomics, Ezrin, IGF1R signaling, XIAP and survivin
1. Introduction
Metastasis to distant organs is mainly responsible for the cancer-related death in solid tumors including colorectal cancer (termed as CRC) [1, 2]. This is due to the lack of effective therapies against the disseminated disease. Thus, there is an urgent need to fill this gap in cancer therapy. Therefore, understanding the mechanisms associated with metastatic progression is critical for developing anti-metastatic therapies. Various “omics” based analyses have emerged as key players for the identification of potential targets for the development of new therapies against cancers [3-6]. In the postgenome era, proteomics has developed as a powerful tool for the characterization of normal and abnormal cellular functions associated with malignant transformation, for the discovery of critical disease-specific targets, and identification of novel endpoints for the study of chemotherapeutic agents and its associated toxicity [6]. The study of the proteome which is the functional translation of the genome is directly linked to specific phenotypes [7].
The proteomic background of CRC has been extensively characterized under different conditions using different proteomic approaches (including gel-based separation methods, mass spectrometry and array-based methods) to identify several proteins involved in the initiation and progression of CRC [7]. Additionally, proteomic studies have helped provide significant insight into the understanding of cellular functions associated with normal and diseased conditions [5-8]. Ying-Taoa et al. (2005) utilized a two dimensional electrophoresis (2-DE) method to compare metastatic LS174T and non-metastatic SW480 CRC cell lines to explore their differences in protein expression that might be linked to CRC metastasis. The proteins, platelet-derived endothelial cell growth factor (PDECGF), septin and cell division cycle 2 (cdc2) were observed to be highly expressed in the metastatic cell lines [9]. Shi-Yong Li et al. (2010) used a 2D-DIGE (2-dimensional difference in-gel electrophoresis) approach to investigate the differential expression of proteins in human CRC patients with liver metastasis to evaluate its clinical diagnostic potential [10]. They compared protein expression between normal mucosa, primary colonic carcinoma and liver metastasis specimens. It was reported that zinc finger protein 64 homolog (Zfp64), guanine nucleotide exchange factor 4 (GEF4), human arginase, glutathione S-transferases (GSTs) A3, and tumor necrosis factor α (TNF-α)-induced protein 9 are upregulated in human CRC liver metastasis [10]. Recently, Sugihara et al (2012) identified APC-binding protein EB1 as a candidate of novel tissue biomarker and therapeutic target for colorectal cancer using 2D-DIGE /MS (mass spectrometry) approach [7].
In this study, 2D-DIGE/MS method was used to identify potential molecular targets associated with liver metastasis originating from primary colon carcinoma generated by the orthotopic mouse metastasis model developed in our laboratory [11-19]. Highly metastatic IGF1R-dependent GEO human CRC xenograft tumors were implanted orthotopically in the colon of athymic nude mice to generate spontaneous liver metastasis [14, 20]. We compared the global protein expression of primary colon carcinoma and liver metastases of GEO cells and identified an increased expression of ezrin and its phosphorylation at T567 (termed here as p-ezrin T567) in liver metastasis compared to the primary tumor. Previous studies have shown that ezrin plays a critical role in tumorigenesis and has been implicated in metastasis of several types of cancers including CRC [21-25]. We performed in vitro characterization of ezrin in CRC cells and identified IGF1R-p-ezrin T567-XIAP axis as a potential cell survival pathway target in IGF1R-dependent subsets of CRC cells. Ezrin and p-ezrin T567 appear to have a key role in the regulation of IGF1R-dependent CRC cell survival properties that may ultimately be utilized for the identification of novel anti-metastatic therapies.
2. Material and methods
2.1. Cell lines
GEO, GEORI, CBS, HCT166 and HCT166b CRC cell lines were originally developed from primary CRC tumors and have been extensively characterized in our laboratory [26-29]. Cells were maintained at 37°C in humidified atmosphere in a chemically defined serum free medium consisting of McCoy’s 5A medium (Sigma-Aldrich) supplemented with amino acids, pyruvate, vitamins, antibiotics, and growth factors transferrin (4μg/ml; Sigma-Aldrich), insulin (20μg/ml; Sigma-Aldrich), and EGF (10ng/ml; R&D Systems). Supplemented McCoy’s medium (“SM”) is McCoy’s 5A medium supplemented with antibiotics and nutrients but lacking any growth factors.
2.2. Antibodies
The following primary antibodies were obtained from Cell Signaling Biotechnology (Danvers, MA): IGF1Rβ (catalog#3027), p-IGF1Rβ(Y1135) (catalog#3918), p-ezrin/ERM(T567) (catalog#3149). The following primary antibodies were obtained from Santa Cruz Biotechnology (Dallas, TX): Ezrin (catalog#sc-71082) and survivin (catalog#sc-17779). XIAP (catalog#ab28151) was obtained from abcam (Cambridge, MA). β-actin (catalog#A2066) and GAPDH (catalog#G8795) obtained from Sigma-Aldrich (St. Louis, MO).
2.3. Pharmacological antagonists
Recombinant humanized IGF1R monoclonal antibody MK-0646 was provided by Merck Oncology and small molecule tyrosine kinase inhibitor OSI-906 was obtained from Chemitek. The ezrin inhibitors NSC668394 and NSC305787 were kindly provided by the Drug Synthesis and Chemistry Branch, Developmental Therapeutics Program, Division of Cancer Treatments and Diagnosis, National Cancer Institute.
2.4. Orthotopic Implantation
All the experiments involving animals were approved by the University of Nebraska Medical Center Institutional Animal Care and Use Committee. The orthotopic implantation methodology has been described in detail in previous studies from Brattain laboratory [11-14, 16-19]. Briefly, GEO and CBS cells were transfected with green fluorescence protein (GFP). Exponentially growing GFP-labeled GEO and CBS cells (approximately 7 million cells/ml Serum Free media) were inoculated subcutaneously onto the dorsal surfaces of athymic nude male mice. Once xenografts were established, approximately 500 mm3 in size, they were excised and minced into 1-2 mm3 pieces. Two of these pieces were then orthotopically implanted into other athymic nude mice. Approximately 60 days post-implantation, animals were euthanized. Organs were explanted, imaged, washed in chilled 1X PBS and immediately placed in liquid nitrogen and 10% formalin respectively. 15-30 mg of primary and liver metastasis tissues obtained after orthotopic implantation of GEO cells was shipped in dry ice to Applied Biomics, Inc for proteomic analysis.
2.5. Enhancement of CRC liver-metastatic ability by serial passaging
Previous studies have shown that training of CRC cell lines to be more aggressive through serial passaging of vertical selection of metastatic cells to initiate primary tumors leads to enhancement of metastatic capability [30, 31]. In our study, an orthotopic implantation procedure was performed using GEO CRC cells and the metastatic liver tissues were harvested. The tissues were homogenized and the metastatic cells were grown in tissue culture. This was followed by the subcutaneous dorsal injection of the metastatic cells of another athymic nude mouse which was subsequently orthotopically implanted to initiate primary colon tumors. The whole procedure was repeated for 6 cycles of vertical selection of IGF1R dependent GEO liver metastases to initiate primary tumors, and thus the highly aggressive cell lines after 6th passage termed as GEO Met6 was obtained.
2.6. Two-dimensional differential in-gel electrophoresis (2D-DIGE) and Mass Spectrometry
The 2D-DIGE and matrix-assisted laser desorption ionization time of flight mass spectrometry (MALDI/TOF MS) was performed by Applied Biomics, Inc. (Hayward, CA) [32, 33].
2.7. Microarray analysis
Microarray analysis was performed on the orthotopically implanted GEO CRC primary tumor and liver metastasis using the Illumina platform.
2.8. Tissue and cell lysate preparation
Orthotopically implanted primary tumor and liver metastasis tissues were harvested and snap frozen in liquid nitrogen and stored in -80 °C. Tumors tissues were first washed in cold 5% PBS and collected in lysis buffer [50 mmol/L Tris (pH 7.4), 100 mmol/L NaCl, 1% NP40, 2 mmol/L EDTA, 0.1% SDS, 50 mmol/L NaF, 10 mmol/L Na3VO4, 1 mmol/L phenylmethylsulfonyl fluoride, 25 μg/ml β-glycerophosphate, and one protease inhibitor cocktail tablet from Roche]. The CRC cells were washed in cold 5% PBS and collected in lysis buffer. Crude tissue lysates were homogenized using a homogenizer to shear DNA and lysed for 30 minutes on ice at 4 °C. The crude cell lysates were homogenized using a 21 gauge needle to shear DNA and lysed for 30 minutes on ice at 4 °C. Both Tissue and cell lysates were then centrifuged at 13000 rpm for 20 minutes at 4 °C to clear it. Protein concentrations were determined by the bicinchoninic acid protein assay method (Pierce Biotechnology).
2.9. Transient knockdown of Ezrin
On-TARGETplus SMARTpool ezrin siRNA (L-017370-00-0005) was purchased from Dharmacon (Thermo Fisher Scientific Inc, USA) and knockdown was performed according to the manufacturer’s protocol for GEO and CBS CRC cells.
2.10. Cell Death Assays
DNA fragmentation assay was performed on GEO and CBS CRC cells with ezrin siRNA knockdown and control. Cells were seeded in 96 well plates and treated with ezrin siRNA next day at 60-70 % confluency for 48 hrs following manufacturer’s protocol. Assays were then performed using a cell death ELISA kit (Roche Applied Science) according to manufacturer protocol as described in [34] and the plate was read at 405nm. Inhibition of proliferation was assessed by the MTT {3-(4, 5-Dimethylthiazol-2-yl)-2,5-diphenyltetrazolium bromide) assay as described previously [20].
2.11. Western blot analyses
Protein (30-100μg) was fractionated by SDS-PAGE and transferred onto a nitrocellulose membrane (Amersham Biosciences) by electroblotting. The membrane was blocked with 5% nonfat dry milk in 1X TBST (50 mM Tris, pH 7.5, 150 mM NaCl, 0.05% Tween20) for 1 hour at room temperature or overnight at 4°C. The membrane was then incubated in primary antibodies for 1½ hour at room temperature or overnight at 4°C with 5% nonfat dry milk in 1X TBST or 5% bovine serum albumin (BSA) in 1X TBST according to manufacturer’s directions. The membrane was washed three times with 1X TBST for 10 minutes each and incubated with horseradish peroxidase-conjugated secondary antibody (Amersham Biosciences) for 1 hour at room temperature. This was followed by washing again in 1X TBST as before and proteins were detected by enhanced chemiluminescence system (Amersham Biosciences).
2.12. Hematoxylin and eosin and immunohistochemistry
Orthotopically implanted animals were euthanized following proper IACUC protocol. Colon primary tumors and liver metastases obtained from orthotopical implantation were harvested, imaged and immediately placed in 10% neutral buffer formalin fixative for 12 to 24 hours. This was followed by further tissue processing and embedment in paraffin as blocks. 4 μm sections were cut from this paraffin embedded blocks using a microtome for hematoxylin and eosin (H&E) staining. Serial sections were cut to complement the H&E sections and were used for immunohistochemical (IHC) characterizations. These slides were deparaffinized in histoclear, and rehydrated in descending grades of ethanol and blocked for endogenous peroxide with 30% hydrogen peroxide. Immunostaining was done for ezrin and p-ezrin T567 using an indirect detection method. The staining was accompanied by negative controls in which slides were incubated with a matching blocking peptide to the primary antibody for p-ezrin T567 and with 1X TBST for ezrin. Slides were counterstained with hematoxylin. Specimens were processed on the same day to eliminate any variability in conditions. Whole slide scanning was performed using Ventana’s Coreo Au Slide Scanner in UNMC Tissue Science Facility and staining density was measured and quantified with ImagePro plus 7.0
2.13. Paraffin embedded human tissue specimens
All the experiments involving human specimens were approved by the University of Nebraska Medical Center Institutional Review Board (IRB). Paraffin embedded human CRC specimens were retrospectively obtained from the UNMC formalin fixed tissue science core and ezrin and p-ezrin T567 IHC analysis was performed.
2.14. Colon Tissue Microarray (TMA)
Colon TMAs were purchased from the National Cancer Institute. Briefly, colon TMAs consist of 4 case sets with each set consisting of 119-120 colon tissue specimens representing the different colon cancer stages, normal colon epithelium (obtained from colon cancer or non-cancer diverticulitis surgeries), and tissues from adenomatous colon polyps. IHC analysis was performed on the colon TMAs for both ezrin and p-ezrin T567.
2.15. TUNEL and Ki67 staining
Paraffin-embedded slides were stained with the Apo-tag (Milipore) terminal nucleotidyl transferase mediated nick and labeling (TUNEL) kit for apoptosis and IgG1 rabbit polyclonal antibody for Ki67 (Dako Corporation) at 1:20 dilution for proliferation according to our established protocol [14, 16]. The apoptotic and proliferation rates were determined semi-quantitatively by counting the number of positively stained apoptotic and proliferative cells per 75-μm2 field at X20 magnification respectively. Approximately 1000 total cells were counted and the percentages of positively stained cells were calculated.
2.16. Statistical analysis
Statistical significance was determined using two-tailed Student’s t test with a p value less than 0.05 using the Graphpad Prism 5. All the experiments were independently repeated three times to determine consistency in the results.
3. Results
3.1. Increased expression of ezrin is associated with liver metastasis
Earlier work from our laboratory has demonstrated the high metastatic capability of the IGF1R-dependent GEO human CRC cells [14, 20]. Using the orthotopic implantation model that we have extensively described in previous studies [13-19, 35, 36], GEO primary colon carcinoma and liver metastasis were obtained as shown in Figure 1A. The protein lysates from the tumors were compared for their global protein expression by 2D-DIGE (performed at Applied Biomics, Inc). CRC primary tumors and liver metastasis were labeled with Cy3 (green) and Cy5 (red) dyes respectively and 2D-DIGE analysis was performed as shown in Figure 1B. Candidate protein spots were automatically selected by DeCyder software. Several protein spots showed differential expression between the primary colonic tumor and the liver metastasis (data not shown). Figures 1C and 1D show the high expression of a candidate protein in liver metastatic specimens in comparison to primary colonic carcinoma. The candidate protein was identified by mass spectrometry as ezrin, a cytoskeleton protein that belongs to the ezrin-radixin-moesin (ERM) family protein which share approximately 75% sequence homology [37, 38]. Detailed information on the MALDI-TOF/MS result identifying the candidate protein as ezrin has been shown in Supplemental Table T1. It is important to note that several proteins were detected in spot no. 2 which was identified as ezrin by mass spectrometry (Supplemental Table T1). Since protein overlapping in spots is common to gel-based proteomics analysis [7], the protein with top-ranked Mascot score was selected for further confirmation by western blotting, IHC and microarray analysis. The individual gel images and overlay of primary colon carcinoma and liver metastasis have been shown in Figure 2.
Figure 1. Proteomic analysis identifies Ezrin upregulation in CRC liver metastasis.

(A) IGF1R-dependent GEO cells were used to generate primary colon and liver metastatic tumors by orthotopic implantation techniques as described in the Material and methods section. These tumor tissues were further utilized for the proteomics analysis. (B) 2D-DIGE image showing differential protein expression between primary colon tumor and liver metastases. The primary colon and liver metastatic tumor tissue lysates were labeled with Cy3 (green) and Cy5 (red) fluorescent dyes respectively. The images of the cy3 and cy5 labeled primary and liver metastatic tumor protein samples are generated by laser scanning. The white circle depicts protein spot number 2. (C) The individual primary tumor and liver metastasis gel images and merged image of protein spot number 2 showing greater intensity in the liver metastatic tumor lysate. (D) The 3D-peak view of protein spot number 2 in primary and liver metastatic tumors analyzed by the DeCyder software. The protein spot number 2 was identified as ezrin by MALDI-TOF mass spectrometry.
Figure 2.

The individual 2D-DIGE gel images of GEO primary colon carcinoma and liver metastasis tumors and overlay merged image.
3.2. Elevated levels of ezrin phosphorylation at T567 site in liver metastasis
Ezrin is present in a dormant state in the cytoplasm [39-41] and is activated through PIP2 binding and phosphorylation at the T567 site [42, 43]. Previous studies have linked ezrin hyperphosphorylation at T567 to increased metastatic potential in HCC and osteosarcoma in vivo [44, 45]. Western blot analysis of orthotopically implanted CRC primary tumor and corresponding liver metastasis tissue lysates showed an increased ezrin expression and its phosphorylation at T567 site in liver metastasis compared to the primary tumor (Figure 3A). Fehon et al.(2010) have shown that following ezrin activation through phosphorylation at the T567 site, ezrin translocates to the plasma membrane and binds to various membrane or adaptor proteins [43]. Quantification of IHC staining of GEO orthotopically implanted tumors showed increased expression of p-ezrin T567 in liver metastasis compared to the primary colonic tumor (Figures 3B and 3C). Moreover, specific membrane staining was observed in the liver metastasis confirming ezrin translocation to the plasma membrane after activation through phosphorylation at T567. Orthotopic implantation was also performed with the IGF1R-dependent CBS CRC cell lines [14, 35, 46] to generate primary colonic tumor and liver metastasis (Figure 3D). We observed an increased expression of p-ezrin T567 in the CBS liver metastasis as well (Figure 3E).
Figure 3. Elevated levels of p-ezrin T567 in liver metastasis.

(A) Western blot analysis comparing GEO primary colon and liver metastatic tumors showing increased ezrin and p-ezrin T567 protein expression in the liver metastasis. (B) IHC analysis of the GEO primary colon and liver metastatic tumors showing increased p-ezrin T567 staining in the liver metastasis. The increased expression of p-ezrin T567 is specifically localized to the membrane as demonstrated by its ring-like appearance of the liver metastatic cells. (C) Densitometry analysis of the IHC images of GEO primary tumors and liver metastasis by Image J followed by statistical analysis showing an increased expression of p-ezrin T567 in liver metastasis specimen. (D) IGF1R-dependent CBS cells were used to generate primary colon and liver metastatic tumors by orthotopic implantation techniques as described in the Material and methods section. These tumor tissues were further utilized for the western blot analysis. (E) Western blot analysis comparing CBS primary colon and liver metastatic tumors showing increased p-ezrin T567 protein expression in the liver metastasis. (F) Highly metastatic GEO cells that lacks functional TGFβ tumor suppressor signaling shows high ezrin and p-ezrin T567 expression in vitro. In contrast, poorly metastatic GEORI cells [14] stably transfected with TGFβ Receptor Type I (TGFβRI) to restore functional TGFβ tumor suppressor signaling shows complete loss of p-ezrin T567 expression and a reduction in total ezrin expression. (*=P<0.001).
Previously, we have shown that reconstitution of TGFβ signaling blocks metastasis in subsets of IGF1R-dependent CRC with attenuated TGFβ receptors by increasing its TGFβ tumor suppressor activity [14, 26]. GEO cells with attenuated TGFβ type I receptor (TGFβRI) are highly metastatic. Restoration of TGFβRI in the GEO cells (cell line termed as GEORI) was observed to be poorly metastatic with functional TGFβ tumor suppressor signaling [14, 26]. Increased ezrin and p-ezrin T567 expression was observed in the highly metastatic GEO cells compared to the poorly metastatic GEORI cells with functional TGFβ tumor suppressor signaling (Figure 3F).
Increased expression of ezrin and p-ezrin T567 was further confirmed in another set of orthotopically implanted GEO CRC primary tumor and liver metastasis tissue lysates (Figures 4A and 4B). Similar results were obtained comparing HCT116 and HCT116b cells which are iso-clonal variants isolated from the same patients primary colon carcinoma in our laboratory [28, 47]. Both HCT116 and HCT116b show 100% primary tumor invasion but vary significantly in their metastatic capabilities [28, 47, 48]. HCT116 cells are highly metastatic compared to HCT116b [28, 47, 48]. We observed that HCT116 cells demonstrated increased ezrin and p-ezrin T567 expression compared with HCT116b cells (Figure 4C). Moreover, IHC of the orthotopically implanted HCT116 CRC tumors showed increased expression of p-ezrin T567 in liver metastasis compared to the primary tumor (Figure 4D). These results confirmed the increased expression of p-ezrin T567 in CRC liver metastasis. Interestingly, as reported earlier that ezrin activation requires PIP2 binding and phosphorylation, we observed an increased expression of PIP2 in liver metastasis compared to primary tumors by IHC and western blot studies (Figures 4E and 4F).
Figure 4.
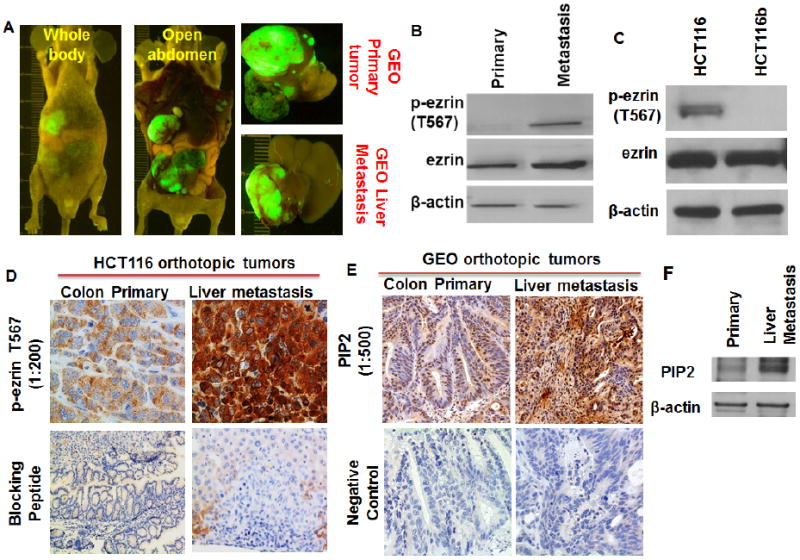
(A) Another set of IGF1R-dependent GEO cells were used to generate primary colon and liver metastatic tumors by orthotopic implantation techniques as described in the Material and methods section. These tumor tissues were further utilized for the western blot analysis. (B) Western blot analysis comparing GEO primary colon and liver metastatic tumors showing increased p-ezrin T567 protein expression in the liver metastasis. (C) Western blot analysis comparing highly metastatic HCT116 [16] and poorly metastatic iso-clonal variant HCT116b cells showing increased p-ezrin T567 in the HCT116 cells. (D) IHC analysis of the HCT116 primary colon and liver metastatic tumors showing increased p-ezrin T567 staining in the liver metastasis. (E, F) IHC and western blot analysis of the GEO primary colon and liver metastatic tumors showing increased PIP2 staining in the liver metastasis.
3.3. Bioinformatics analysis of ezrin in colorectal cancer metastatic signaling
Clarke et al. (2003) [49] profiled the gene expression signature of CRC patient tumors in response to chemotherapy [49]. 35 human CRC samples were compared with normal colon samples in the study [49]. Using Oncomine, an advanced web-based data-mining platform that collates HTS cancer-related data [50], we observed approximately 4-fold increase in the ezrin mRNA expression in the CRC tumor samples compared with the normal colon samples (Supplemental Figure S1). Data mining using Oncomine also revealed transcriptional upregulation of ezrin in advanced stages of breast, pancreatic and prostate cancer patient specimen (data not shown). We utilized the Ingenuity Pathways Analysis (IPA) tool to generate potential ezrin signaling networks that might be involved in colorectal cancer metastasis signaling (Figure 5). Several potential ezrin interacting proteins were identified using IPA including EGF[51], RhoA[52], PIK3CA[53] and SRC[22]. All these proteins have been implicated in CRC metastasis. We next performed a microarray analysis on the freshly-frozen GEO CRC primary colon carcinoma and liver metastatic tumor samples to generate transcriptional profiles using the Illumina platform. The heat map dendrogram is shown in Supplemental Figure S2. We observed approximately 4-fold increase in the ezrin mRNA expression in liver metastasis compared to the primary tumor (Supplemental Table T2).
Figure 5. Ezrin network in colorectal cancer metastasis signaling.

The intuitive web-based analytical tool Ingenuity Pathway Analysis (IPA) was used to generate plausible colorectal cancer metastasis signaling networks.
3.4. Increased p-ezrin T567 observed in human CRC patient specimens
Wang and colleagues reported that ezrin is highly expressed in the CRC compared to the normal colon and is correlated with tumor malignancy [21]. We performed and quantified IHC on colon TMAs obtained from the National Cancer Institute (NCI) and observed a significant increase in ezrin expression in Stage IV CRC when compared to the normal colon (Figures 6A and 6B). Intriguingly, no statistically significant p-ezrin T567 staining was observed between normal colon and Stage IV colon carcinoma with low overall p-ezrin T567 expression. (Figure 6C and data not shown). As mentioned earlier, activation of ezrin through phosphorylation at the T567 site leads to its translocation to the plasma membrane [52-54] and has been associated with increased metastatic potential [44, 45]. We performed IHC analysis on paired human CRC primary tumor (Stage IV) and liver metastasis patient specimens and observed a significant increase in the intensity of p-ezrin T567 staining in the liver metastasis compared to the primary tumors (Figures 6D and 6E). The increased membrane localization of p-ezrin T567 in human CRC liver specimen mimicked the IHC data obtained from the orthotopically implanted GEO tumor specimens as shown in Figure 3B.
Figure 6. IHC studies on ezrin and p-ezrin T567 in human CRC patient specimens.

(A) NCI colon tissue microarray (colon TMA) analysis of ezrin in normal colon and stage IV primary colon carcinoma obtained from CRC patient specimens. (B) Densitometry analysis of the IHC images of colon TMA comparing normal colon and stage IV primary colon carcinoma by Image J followed by statistical analysis showing an increased expression of ezrin in stage IV colon carcinoma specimen. (C) IHC staining of p-ezrin T567 in colon TMAs showing negligible staining in both normal colon and stage IV colon carcinoma specimen. (D) IHC analysis of the human CRC stage IV colon carcinoma and liver metastatic tumors obtained from the same patient showing increased p-ezrin T567 staining in the liver metastasis. Similar to the p-ezrin T567 staining in the GEO orthotopically implanted liver metastatic tumors, the increased p-ezrin T567 is specifically localized to the cellular membrane of the liver metastatic cells. (E) Densitometry analysis of the IHC images of the human CRC stage IV colon carcinoma and liver metastatic tumors obtained from the same patient by Image J followed by statistical analysis showing an increased expression of p-ezrin T567 in liver metastasis specimen. (**=P<0.01).
3.5. Ezrin expression is correlated with enhanced metastatic capability
Bresalier et al (1987) demonstrated that colon cancer cell lines with progressively increased metastatic potential could be developed in which metastases from the parental colon tumor cell line were cultured and used as a source of cells for successive cycling [30]. We utilized a similar approach to enhance the liver-metastasizing ability of GEO cells by serially passaging liver metastases of GEO cell lines. Serial in vivo passaging of metastatic liver tumor from human CRC-bearing athymic nude mice was used to generate a highly aggressive cell line after the 6th passage, which was termed the GEO Met6 cell line. Increased primary tumor burdens as well as the degree of liver metastasis were observed in the GEO Met6 cell line compared to the parental GEO cell line (Figures 7A and 7B). Moreover, GEO Met6 cells demonstrated rapid primary tumor growth and about 50% reduction in the number of days to develop distant metastasis compared to the parental GEO cell lines (Figure 7C). However, Ki67 staining of liver metastases of parental GEO and GEO Met6 showed no change in the rate of proliferation (data not shown), indicating that increase in tumor burden did not contribute to the enhancement of distant metastasis. Importantly, TUNEL staining showed a significant decrease in the cell death in GEO Met6 liver metastasis as compared to the parental GEO liver metastasis (Figures 7D and 7E). We observed an increase in the expression of cell survival markers XIAP and survivin in the liver metastases of GEO Met6 cell line compared to the parental GEO control (Supplemental Figures S3A and S3B). Both XIAP and survivin play a critical role in cell survival through caspase inactivation [55] and have been newly implicated in metastasis regulation [56]. Our data indicate that the increase in the metastatic capability of GEO Met6 cell line might be partly attributed to the gain of aberrant cell survival capabilities and a decrease in cell death signaling. Furthermore, western blot and IHC analysis of GEO Met6 primary and liver metastasis tissue lysates showed a higher expression of ezrin in the GEO Met6 metastatic liver tumor (Figure 7F and Supplemental Figure S3C).
Figure 7. Ezrin expression is correlated with enhanced liver metastasizing ability.

(A) IGF1R-dependent GEO Met6 cells were generated by serial passaging of the liver metastatic tumor tissues as discussed in the Material and methods section. Comparison of the orthotopically implanted GEO cells (mentioned here as GEO Control) and GEO Met6 cells showed remarkable differences in their tumor formation. (B) GEO Control and GEO Met6 primary colonic and liver metastatic tumor images. (C) Comparison of the approximate number of days needed to develop liver metastasis in the GEO and GEO Met6 xenograft implanted animals. (D) TUNEL assay of GEO and GEO Met6 liver metastatic tumor tissues showing a significant decrease in cell death in the GEO Met6 liver metastatic tumor tissues as observed by reduction in TUNEL staining. (E) Densitometry analysis of the TUNEL staining of GEO and GEO Met6 liver metastatic tumor tissues by Image J followed by statistical analysis showing a decrease in TUNEL staining in the GEO Met6 liver metastasis specimen. (F) Western blot analysis showing a significant increase in ezrin protein expression in the GEO Met6 liver metastasis tumors compared to the GEO Met6 primary tumors. (*=P<0.001).
3.6. Cell survival regulation by ezrin in CRC cells
It has been shown that Akt and its downstream signaling components are critical for aberrant cell survival in CRC [2, 57]. Recently, Ezrin has been linked to Akt-mediated cell survival [53, 58]. It was reported that Akt2 specifically activated ezrin at T567 phosphorylation site [58]. We observed an increased expression of Akt2 in the liver metastatic tumors compared to primary colonic tumors in the GEO orthotopic tumors (Supplemental Figure S4). Akt phosphorylates XIAP at the S87 site and reduces its degradation conferring resistance to caspase activation and apoptosis [59]. Dohi et al (2007) have demonstrated that under conditions of stress, survivin forms a complex with XIAP in the cytosol leading to XIAP stabilization and prevention of its proteasomal degradation by suppressing its E3-ubiquitin ligase activity [55]. The survivin/XIAP complex has been shown to be a critical cell survival mechanism for tumor growth in vivo and for supporting the metastatic process in vivo [55]. Transient knockdown (KD) using ezrin siRNA in GEO CRC cells led to the downregulation of both XIAP and survivin (Figure 8A). Ezrin KD also resulted in approximately 1.5 fold increase in cell death in GEO cells (Figure 8B). Similar results were obtained from ezrin siRNA KD in CBS cells (Figures 8C and 8D) demonstrating that the downregulation of ezrin signaling adversely effects the cell survival capabilities of IGF1R-dependent GEO and CBS cells. Small molecule inhibitors for ezrin (NSC668394 and NSC305787) have been recently identified as potential drug candidates. Bulut et al (2012) showed that both the drugs directly inhibited ezrin activity at T567, ezrin-actin interaction, ezrin-mediated motility and inhibited lung metastasis of ezrin-sensitive osteosarcoma cells following tail-vein injection [60]. We have observed that NSC668394 is effective in dephosphorylating ezrin at T567 amino acid and decreases XIAP levels in metastatic CRC cells (Figure 8E). Furthermore, NSC668394 was effective in causing cell death as analyzed by DNA fragmentation assay (Figure 8F). Similar results were obtained with NSC305787 treatment in GEO cells (data not shown). Furthermore, we performed DNA fragmentation assay on GEO cells transiently transfected with ezrin T567A/D point mutant constructs and observed an increase in cell death with the dominant negative ezrin T567A expression in GEO cells. In contrast, ezrin T567D constitutively active ezrin decreased cell death in GEO cells (Figure 8G).
Figure 8. Ezrin regulates aberrant cell survival in CRC cells.

(A) Ezrin siRNA knockdown in GEO cells (termed as GEO Ezrin siRNA) shows a reduction in the inhibitor of apoptosis (IAP) family proteins XIAP and survivin. (B) DNA fragmentation assay of GEO and GEO Ezrin siRNA cells showing significant increase in cell death in vitro. (C) Ezrin siRNA knockdown in CBS cells (termed as CBS Ezrin siRNA) shows a reduction in XIAP and survivin expression. (D) DNA fragmentation assay of CBS and CBS Ezrin siRNA cells showing significant increase in cell death in vitro. (E) Ezrin inhibitor NS668394 treatment dephosphorylates p-ezrin T567 and decreases XIAP expression. (F) NS668394 treatment induces 7.5-fold increase in cell death in GEO cells. (G) DNA fragmentation assay showing increased cell death with ezrin T567A mutation compared to T567D transfection on GEO cells. (*=P<0.001).
Based on the effects of ezrin siRNA KD, inhibitor and T567A/D mutant expression on IGF1R-dependent CRC cells and also its expression in the orthotopic implanted primary tumors and liver metastases of IGF-1R dependent GEO CRC cells, we hypothesized that treatment with IGF1R inhibitor could downregulate ezrin-mediated cell survival. MK-0646, a novel humanized recombinant IGF1R monoclonal antibody and OSI-906, a small molecule tyrosine kinase inhibitor were utilized to inhibit the IGF1R signaling pathway [61]. Both of these drugs are currently in clinical trials and showed significant anti-tumor activity [61-64]. As shown in Figure 9A, treatment by MK-0646 of GEO xenografts led to the dephosphorylation of p-ezrin T567. However, the total ezrin remained unchanged. Moreover, IHC staining for p-ezrinT567 showed a decrease in staining intensity in MK-0646 treated GEO xenograft tumors compared with the untreated GEO control xenograft (Figure 9B). OSI-906 treatment also resulted in deactivation of p-ezrinT567 (Figure 9C). Thus, the IGF-1R signaling pathway is upstream of ezrin and its downstream cell survival signaling. Zhou et al (2003) demonstrated that PKA can phosphorylate ezrin at S66 in gastric parietal cells which regulated remodeling of the apical membrane cytoskeleton associated with acid secretion in parietal cells. However, to date, no functional characterization is done on PKA-mediated ezrin signaling in cancer. We recently demonstrated that PKA can be differentially activated in a cAMP-dependent and –independent manner leading to differential regulation of cell fate in terms of cellular life and death [14, 46, 65]. Briefly, IGF1R activation leads to cAMP-dependent PKA activation leading to increased XIAP-mediated cell survival signaling. However, inhibition of IGF1R signaling by OSI-906 leads to cAMP-independent PKA activation leading to decrease in XIAP expression and increased cell death. For the activation of IGF1R, we used the growth factors Transferrin + Insulin (TI) that has been extensively used to activate the IGF1R signaling [20, 65]. We used OSI-906 for inhibition of IGF1R signaling.
Figure 9. Regulation of p-ezrin T567 by IGF1R signaling.

(A) Inhibition of the IGF1R signaling pathway by human recombinant monoclonal antibody MK-0646 in athymic mice IGF1R-dependent GEO xenograft lead to inhibition of p-ezrin T567. However, the total ezrin protein remained unchanged. (B) IHC analysis of GEO control and MK-0646 treated xenograft showing a decrease in staining intensity of p-ezrin T567 in the MK-0646 treated xenograft. (C) Treatment of IGF1R-kinase inhibitor OSI-906 on GEO cells in vitro leads to loss of ezrin phosphorylation at T567 site without change in total ezrin. (D) Ezrin IP studies showing decrease in p-Serine following IGF1R inhibition by OSI-906 and increase following IGF1R activation for 1hour (E) Ezrin IP following site-directed mutagenesis showing decrease in p-Serine in dominant negative ezrin S66A expressing GEO cells. In contrast, constitutive active ezrin S66D expression increases p-Serine on ezrin IP pull down. Ezrin S66A/D mutation also shows loss of XIAP and survivin with S66A and increase with S66D ezrin mutation. (F) Increased cell death observed with ezrin S66A mutation compared to S66D indicative of its role in cell survival (* P<0.001)
Due to the commercial unavailability of p-ezrin-S66 antibody, we performed IP studies using ezrin and immunoblotted for phospho-Serine in GEO cells under conditions of cAMP-dependent and –independent PKA activation. We report the new finding that IGF1R inhibition abrogated serine phosphorylation on ezrin. In contrast, IGF1R activation increased the serine phosphorylation on ezrin (Figure 9D). We constructed dominant negative S66A and constitutive active S66D ezrin mutant constructs as demonstrated in the original work by Zhao et al [66]. We observed that Ezrin S66A/D mutants differentially regulate CRC cells with regard to XIAP and survivin expression and control of cell survival (Figures 9E and 9F).
4. Discussion
Colorectal cancer is the second-most common cause of cancer-related death in United States [67]. Early stages of CRC are controlled by surgical resection followed by adjuvant chemotherapy; however, therapies directed at disseminated disease which is the main cause of death are less effective [2]. Therefore, identifying novel biomarkers for the development of anti-metastatic therapeutic strategies is a pressing need. Overexpression of IGF1R signaling components is common to several types of cancer [20, 68]. CRC is one of the most prevalent cancers in which IGF1R signaling components have been linked to cancer progression [20, 68, 69]. Dependence of malignant properties of CRC cells on IGF1R signaling has also been demonstrated and several IGF1R inhibitors are in clinical trials [14, 20]. IGF1R signaling exerts its anti-apoptotic effect through the activation of the IRS1/IRS2/PI3K/Akt pathway [70-72]. IGF1R-dependent GEO and CBS cell lines were used in this study to generate primary and liver metastatic tumors by an orthotopic mouse metastasis model system developed in our laboratory that reflects the metastatic pattern of human CRC and has been used extensively to characterize several potential molecular targets associated with CRC metastasis [11-15, 47, 48].
A 2D-DIGE/MALDI-TOF proteomic approach was used to identify the differences in global protein expression between GEO primary colonic tumors and corresponding liver metastases. Using this approach we identified that ezrin, a member of the ERM protein family [37, 38], was highly expressed in liver metastasis when compared to the primary colonic tumor. In the recent report by Sugihara et al [7], proteomic characterization of 59 paired normal colorectal epithelial and tumor tissues was performed using 2D-DIGE. While the authors characterized the APC-binding protein EB1 as a candidate biomarker and therapeutic target, Ezrin was also shown to be upregulated by 2.5 fold in the tumor tissues compared to normal tissues. Western blot analysis also confirmed an increased expression of ezrin in several paired tumor tissues compared to their corresponding normal epithelial tissues. However, ezrin was not further investigated by Sugihara and colleagues.
Ezrin belongs to the ezrin-radixin-moesin (ERM) family of proteins which share approximately 75% sequence homology [37, 38] and was first characterized as a component of intestinal brush border microvllli [73]. Ezrin acts as a linker between the plasma membrane and the actin cytoskeleton [39, 52, 53] and is present in the cytoplasm in an inactive dormant closed conformation, where the NH2-terminal domain is tightly bound to the COOH-terminal domain masking several of its protein binding sites including the F-actin binding site [39, 40, 54]. The activation of ezrin is mediated by binding of its NH2-terminal domain to the phosphatidylinositol 4,5-biphosphate (PIP2) and phosphorylation of a conserved T567 site in the COOH-terminal domain [42, 43]. Phosphorylation at T567 leads to the dissociation of the two binding domains of ezrin changing its inactive closed conformation to an open activated form thereby exposing several protein binding sites [39, 43, 54]. Once activated through phosphorylation at T567, ezrin is translocated to the plasma membrane where it binds to various membrane proteins such as CD44/43, ICAM2/3 either directly or through adaptor proteins such as NHERF1/2 with the NH2-terminal domain and to actin with the COOH- terminal domain [43] allowing ezrin to function as plasma membrane/actin filament cross-linkers [52-54]. Ezrin phosphorylation at T567 was correlated with hepatocellular carcinoma (HCC) and osteosarcoma metastases in vivo [44, 45]. Chen et al. (2011) demonstrated the involvement of p-ezrinT567 during HCC intrahepatic metastasis [45]. Ren et al. (2009) showed that ezrin phosphorylation at T567 is dynamically regulated during osteosarcoma metastatic progression [44]. Despite the earlier reports on the increased ezrin expression with CRC progression [21, 25], a direct link of activated ezrin at T567 with CRC cell survival and metastasis has not been investigated.
We report increased p-ezrin T567 in liver metastases compared to the primary colonic tumors in the IGF1R-dependent GEO and CBS orthotopically implanted CRC tumors. Moreover, IHC analysis demonstrated a differential pattern of staining with increased membrane staining of p-ezrin T567 in liver metastases compared to primary colonic tumors. Correlative studies using human CRC primary and liver metastatic specimens showed a similar membrane staining pattern of liver metastases. We made the striking observation by colon TMA studies that ezrin and not p-ezrin T567 was significantly increased in Stage IV CRC patient specimens compared to normal colon tissues. A possible reason might be attributed to the low PIP2 activity in primary colon tumors but a high activity in liver metastasis. As PIP2 binding and activation is required for ezrin activation at T567, a high expression of PIP2 specifically in the liver metastasis might serve as a critical factor in increased ezrin T567 phosphorylation specifically in the metastatic stage. The demonstration of increased p-ezrin T567 in highly metastatic GEO and HCT116 cell lines as compared to the poorly metastatic GEORI and HCT116b cell lines might be due to its metastasis-specific function, which is yet to be determined. Additionally, we made the novel observation by ezrin siRNA, inhibitor and T567A/D point mutant studies that ezrin regulates cell survival by modulating IAPs survivin and XIAP, which have been implicated in metastasis. Furthermore, we reported the novel finding that PKA phosphorylates ezrin at S66 that in turn increased XIAP and survivin expression and decreased cell death. These IAPs were also observed to be upregulated in the liver metastasis tumors arising from the enhanced liver-metastasizing GEOMet6 cells. Moreover, IGF1R antagonists (MK0646 and OSI906) downregulated ezrin activation at T567 indicating for the first time that ezrin signaling is downstream of IGF1R signaling.
5. Conclusion
We have demonstrated the increased expression of p-ezrin T567 in liver metastasis in both orthotopic implantation studies in vivo as well as in IHC studies of human CRC patient specimens. Furthermore, we showed for the first time that p-ezrin T567 is regulated by the IGF1R signaling pathway and this activation enhances cell survival in CRC cells by modulating XIAP and survivin. Thus, p-ezrin T567 may be a potential biomarker as well as a target for anti-metastatic therapy. Further in vitro and in vivo preclinical studies are required to determine the role of p-ezrin T567 in the development and/or maintenance of established metastasis in solid tumors including CRC. The findings in this study have the potential to open new avenues of research into the molecular mechanisms of CRC metastasis and the development of novel anti-metastatic therapeutic strategies for human CRC.
Supplementary Material
Highlights.
2D-DIGE-based proteomic analysis of CRC primary and liver metastasis tumors
Ezrin and p-ezrin-T567 increased in liver metastasis
Enhancement of liver metastasizing ability of CRC increased ezrin expression
Ezrin regulates cell survival signaling in CRC
IGF1R-Ezrin signaling regulates survivin and XIAP in CRC
Acknowledgments
The authors would like to thank Dr. Chand Khanna at the NCI Pediatric Oncology Branch for providing the ezrin T567A/D mutant constructs. This research study was funded by the National Cancer Institute R01 grants to MGB (CA054807, CA034432, CA038173 and CA072001). The funding body had no influence on the design of the study, data collection and interpretation or to the decision when and where to publish the data.
Abbreviations
- CRC
Colorectal Cancer
- 2D-DIGE
2-Dimensional Difference In-Gel Electrophoresis
- IGF1R
Insulin-Like Growth Factor Receptor Type I
- ERM
Ezrin-Radixin-Moesin
- XIAP
X-linked Inhibitor of Apoptosis
- TMA
Tissue Microarray
Footnotes
Competing interests
The authors declare that they have no competing interests.
Publisher's Disclaimer: This is a PDF file of an unedited manuscript that has been accepted for publication. As a service to our customers we are providing this early version of the manuscript. The manuscript will undergo copyediting, typesetting, and review of the resulting proof before it is published in its final citable form. Please note that during the production process errors may be discovered which could affect the content, and all legal disclaimers that apply to the journal pertain.
References
- 1.Nguyen DX, Bos PD, Massague J. Nat Rev Cancer. 2009;9(4):274–284. doi: 10.1038/nrc2622. [DOI] [PubMed] [Google Scholar]
- 2.Markowitz SD, Bertagnolli MM. N Engl J Med. 2009;361(25):2449–2460. doi: 10.1056/NEJMra0804588. [DOI] [PMC free article] [PubMed] [Google Scholar]
- 3.Vasan RS. Circulation. 2006;113(19):2335–2362. doi: 10.1161/CIRCULATIONAHA.104.482570. [DOI] [PubMed] [Google Scholar]
- 4.Imielinski M, Cha S, Rejtar T, Richardson EA, Karger BL, Sgroi DC. Mol Cell Proteomics. 2012;11(6) doi: 10.1074/mcp.M111.014910. M111 014910. [DOI] [PMC free article] [PubMed] [Google Scholar]
- 5.Chung CH, Levy S, Chaurand P, Carbone DP. Crit Rev Oncol Hematol. 2007;61(1):1–25. doi: 10.1016/j.critrevonc.2006.06.005. [DOI] [PubMed] [Google Scholar]
- 6.Verma M, Wright GL, Jr, Hanash SM, Gopal-Srivastava R, Srivastava S. Ann N Y Acad Sci. 2001;945:103–115. doi: 10.1111/j.1749-6632.2001.tb03870.x. [DOI] [PubMed] [Google Scholar]
- 7.Sugihara Y, Taniguchi H, Kushima R, Tsuda H, Kubota D, Ichikawa H, Sakamoto K, Nakamura Y, Tomonaga T, Fujita S, Kondo T. J Proteomics. 2012;75(17):5342–5355. doi: 10.1016/j.jprot.2012.06.013. [DOI] [PubMed] [Google Scholar]
- 8.Tyers M, Mann M. Nature. 2003;422(6928):193–197. doi: 10.1038/nature01510. [DOI] [PubMed] [Google Scholar]
- 9.Zhang Ying-Taoa, Geng Yi-Pinga, Si Lu-Shenga, Yi-Lia W. European Journal of Gastroenterology & Hepatology. 2005;17(7):725–732. doi: 10.1097/00042737-200507000-00006. [DOI] [PubMed] [Google Scholar]
- 10.Li SY, An P, Cai HY, Bai X, Zhang YN, Yu B, Zuo FY, Chen G. Hepatobiliary Pancreat Dis Int. 2010;9(2):149–153. [PubMed] [Google Scholar]
- 11.Guo XN, Rajput A, Rose R, Hauser J, Beko A, Kuropatwinski K, LeVea C, Hoffman RM, Brattain MG, Wang J. Cancer Res. 2007;67(12):5851–5858. doi: 10.1158/0008-5472.CAN-07-0049. [DOI] [PubMed] [Google Scholar]
- 12.Ongchin M, Sharratt E, Dominguez I, Simms N, Wang J, Cheney R, LeVea C, Brattain M, Rajput A. J Surg Res. 2009;156(2):250–256. doi: 10.1016/j.jss.2009.02.002. [DOI] [PubMed] [Google Scholar]
- 13.Rajput A, Koterba AP, Kreisberg JI, Foster JM, Willson JK, Brattain MG. Cancer Res. 2007;67(2):665–673. doi: 10.1158/0008-5472.CAN-06-2773. [DOI] [PubMed] [Google Scholar]
- 14.Chowdhury S, Howell GM, Rajput A, Teggart CA, Brattain LE, Weber HR, Chowdhury A, Brattain MG. PLoS One. 2011;6(5):e19335. doi: 10.1371/journal.pone.0019335. [DOI] [PMC free article] [PubMed] [Google Scholar]
- 15.Wang J, Rajput A, Kan JL, Rose R, Liu XQ, Kuropatwinski K, Hauser J, Beko A, Dominquez I, Sharratt EA, Brattain L, Levea C, Sun FL, Keane DM, Gibson NW, Brattain MG. J Biol Chem. 2009;284(16):10912–10922. doi: 10.1074/jbc.M809551200. [DOI] [PMC free article] [PubMed] [Google Scholar]
- 16.Chowdhury S, Ongchin M, Sharratt E, Dominguez I, Wang J, Brattain MG, Rajput A. PLoS One. 2013;8(4):e60299. doi: 10.1371/journal.pone.0060299. [DOI] [PMC free article] [PubMed] [Google Scholar]
- 17.Chowdhury S, Ongchin M, Wan G, Sharratt E, Brattain MG, Rajput A. J Surg Res. 2013 doi: 10.1016/j.jss.2013.03.035. [DOI] [PMC free article] [PubMed] [Google Scholar]
- 18.Chowdhury S, I D, Sharratt E, Spernyak J, Brattain MG, Rajput A. Clinical and Experimental Pharmacology. 2013;S4:005. [Google Scholar]
- 19.Rajput A, A E, Leiphrakpam P, Brattain MG, Chowdhury S. ISRN Hepatology. 2013;2013 doi: 10.1155/2013/206875. Article ID 206875. [DOI] [PMC free article] [PubMed] [Google Scholar]
- 20.Hu YP, Patil SB, Panasiewicz M, Li W, Hauser J, Humphrey LE, Brattain MG. Cancer Res. 2008;68(19):8004–8013. doi: 10.1158/0008-5472.CAN-08-0280. [DOI] [PMC free article] [PubMed] [Google Scholar]
- 21.Wang HJ, Zhu JS, Zhang Q, Sun Q, Guo H. World J Gastroenterol. 2009;15(16):2016–2019. doi: 10.3748/wjg.15.2016. [DOI] [PMC free article] [PubMed] [Google Scholar]
- 22.Li Q, Wu M, Wang H, Xu G, Zhu T, Zhang Y, Liu P, Song A, Gang C, Han Z, Zhou J, Meng L, Lu Y, Wang S, Ma D. Cancer Lett. 2008;261(1):55–63. doi: 10.1016/j.canlet.2007.11.018. [DOI] [PubMed] [Google Scholar]
- 23.Khanna C, Wan X, Bose S, Cassaday R, Olomu O, Mendoza A, Yeung C, Gorlick R, Hewitt SM, Helman LJ. Nat Med. 2004;10(2):182–186. doi: 10.1038/nm982. [DOI] [PubMed] [Google Scholar]
- 24.Weng WH, Ahlen J, Astrom K, Lui WO, Larsson C. Clin Cancer Res. 2005;11(17):6198–6204. doi: 10.1158/1078-0432.CCR-05-0548. [DOI] [PubMed] [Google Scholar]
- 25.Elzagheid A, Korkeila E, Bendardaf R, Buhmeida A, Heikkila S, Vaheri A, Syrjanen K, Pyrhonen S, Carpen O. Hum Pathol. 2008;39(12):1737–1743. doi: 10.1016/j.humpath.2008.04.020. [DOI] [PubMed] [Google Scholar]
- 26.Wang J, Han W, Zborowska E, Liang J, Wang X, Willson JK, Sun L, Brattain MG. J Biol Chem. 1996;271(29):17366–17371. doi: 10.1074/jbc.271.29.17366. [DOI] [PubMed] [Google Scholar]
- 27.Brattain MG, Levine AE, Chakrabarty S, Yeoman LC, Willson JK, Long B. Cancer Metastasis Rev. 1984;3(3):177–191. doi: 10.1007/BF00048384. [DOI] [PubMed] [Google Scholar]
- 28.Brattain MG, Marks ME, McCombs J, Finely W, Brattain DE. Br J Cancer. 1983;47(3):373–381. doi: 10.1038/bjc.1983.56. [DOI] [PMC free article] [PubMed] [Google Scholar]
- 29.Ye SC, Foster JM, Li W, Liang J, Zborowska E, Venkateswarlu S, Gong J, Brattain MG, Willson JK. Cancer Res. 1999;59(18):4725–4731. [PubMed] [Google Scholar]
- 30.Bresalier RS, Hujanen ES, Raper SE, Roll FJ, Itzkowitz SH, Martin GR, Kim YS. Cancer Res. 1987;47(5):1398–1406. [PubMed] [Google Scholar]
- 31.Williams NN, Gyorfi T, Iliopoulos D, Herlyn D, Greenstein D, Linnenbach AJ, Daly JM, Jensen P, Rodeck U, Herlyn M. Int J Cancer. 1992;50(2):274–280. doi: 10.1002/ijc.2910500218. [DOI] [PubMed] [Google Scholar]
- 32.Martin JN, Bair TB, Bode N, Dauer WT, Gonzalez-Alegre P. Neuroscience. 2009;164(2):563–572. doi: 10.1016/j.neuroscience.2009.07.068. [DOI] [PMC free article] [PubMed] [Google Scholar]
- 33.Bi F, Huang C, Tong J, Qiu G, Huang B, Wu Q, Li F, Xu Z, Bowser R, Xia XG, Zhou H. Proc Natl Acad Sci U S A. 110(10):4069–4074. doi: 10.1073/pnas.1218497110. [DOI] [PMC free article] [PubMed] [Google Scholar]
- 34.Wang J, Yang L, Yang J, Kuropatwinski K, Wang W, Liu XQ, Hauser J, Brattain MG. Cancer Res. 2008;68(9):3152–3160. doi: 10.1158/0008-5472.CAN-07-5348. [DOI] [PubMed] [Google Scholar]
- 35.Simms N, Rajput A, Sharratt EA, Ongchin M, Teggart CA, Wang J, Brattain MG. BMC Cancer. 2012;12(1):221. doi: 10.1186/1471-2407-12-221. [DOI] [PMC free article] [PubMed] [Google Scholar]
- 36.Wang J, Kuropatwinski K, Hauser J, Rossi MR, Zhou Y, Conway A, Kan JL, Gibson NW, Willson JK, Cowell JK, Brattain MG. Mol Cancer Ther. 2007;6(3):1143–1150. doi: 10.1158/1535-7163.MCT-06-0555. [DOI] [PubMed] [Google Scholar]
- 37.Sato N, Funayama N, Nagafuchi A, Yonemura S, Tsukita S. J Cell Sci. 1992;103(Pt 1):131–143. doi: 10.1242/jcs.103.1.131. [DOI] [PubMed] [Google Scholar]
- 38.Gould KL, Bretscher A, Esch FS, Hunter T. EMBO J. 1989;8(13):4133–4142. doi: 10.1002/j.1460-2075.1989.tb08598.x. [DOI] [PMC free article] [PubMed] [Google Scholar]
- 39.Gautreau A, Louvard D, Arpin M. J Cell Biol. 2000;150(1):193–203. doi: 10.1083/jcb.150.1.193. [DOI] [PMC free article] [PubMed] [Google Scholar]
- 40.Gary R, Bretscher A. Mol Biol Cell. 1995;6(8):1061–1075. doi: 10.1091/mbc.6.8.1061. [DOI] [PMC free article] [PubMed] [Google Scholar]
- 41.Heiska L, Alfthan K, Gronholm M, Vilja P, Vaheri A, Carpen O. J Biol Chem. 1998;273(34):21893–21900. doi: 10.1074/jbc.273.34.21893. [DOI] [PubMed] [Google Scholar]
- 42.Fievet BT, Gautreau A, Roy C, Del Maestro L, Mangeat P, Louvard D, Arpin M. J Cell Biol. 2004;164(5):653–659. doi: 10.1083/jcb.200307032. [DOI] [PMC free article] [PubMed] [Google Scholar]
- 43.Fehon RG, McClatchey AI, Bretscher A. Nat Rev Mol Cell Biol. 2010;11(4):276–287. doi: 10.1038/nrm2866. [DOI] [PMC free article] [PubMed] [Google Scholar]
- 44.Ren L, Hong SH, Cassavaugh J, Osborne T, Chou AJ, Kim SY, Gorlick R, Hewitt SM, Khanna C. Oncogene. 2009;28(6):792–802. doi: 10.1038/onc.2008.437. [DOI] [PMC free article] [PubMed] [Google Scholar]
- 45.Chen Y, Wang D, Guo Z, Zhao J, Wu B, Deng H, Zhou T, Xiang H, Gao F, Yu X, Liao J, Ward T, Xia P, Emenari C, Ding X, Thompson W, Ma K, Zhu J, Aikhionbare F, Dou K, Cheng SY, Yao X. Cancer Res. 2011;71(5):1721–1729. doi: 10.1158/0008-5472.CAN-09-4683. [DOI] [PMC free article] [PubMed] [Google Scholar]
- 46.Chowdhury S, Howell GM, Teggart CA, Chowdhury A, Person JJ, Bowers DM, Brattain MG. J Biol Chem. 2011;286(35):30937–30948. doi: 10.1074/jbc.M110.212035. [DOI] [PMC free article] [PubMed] [Google Scholar]
- 47.Rajput A, Dominguez San Martin I, Rose R, Beko A, Levea C, Sharratt E, Mazurchuk R, Hoffman RM, Brattain MG, Wang J. J Surg Res. 2008;147(2):276–281. doi: 10.1016/j.jss.2007.04.021. [DOI] [PubMed] [Google Scholar]
- 48.Chowdhury S, Ongchin M, Sharratt E, Dominguez I, Wang J, Brattain MG, R A. PLoS One. 2013;8(4):e60299. doi: 10.1371/journal.pone.0060299. [DOI] [PMC free article] [PubMed] [Google Scholar]
- 49.Clarke PA, George ML, Easdale S, Cunningham D, Swift RI, Hill ME, Tait DM, Workman P. Cancer Res. 2003;63(20):6855–6863. [PubMed] [Google Scholar]
- 50.Rhodes DR, Yu J, Shanker K, Deshpande N, Varambally R, Ghosh D, Barrette T, Pandey A, Chinnaiyan AM. Neoplasia. 2004;6(1):1–6. doi: 10.1016/s1476-5586(04)80047-2. [DOI] [PMC free article] [PubMed] [Google Scholar]
- 51.Orr Gandy KA, Adada M, Canals D, Carroll B, Roddy P, Hannun YA, Obeid LM. FASEB J. doi: 10.1096/fj.13-228460. [DOI] [PMC free article] [PubMed] [Google Scholar]
- 52.Matsui T, Maeda M, Doi Y, Yonemura S, Amano M, Kaibuchi K, Tsukita S. J Cell Biol. 1998;140(3):647–657. doi: 10.1083/jcb.140.3.647. [DOI] [PMC free article] [PubMed] [Google Scholar]
- 53.Gautreau A, Poullet P, Louvard D, Arpin M. Proc Natl Acad Sci U S A. 1999;96(13):7300–7305. doi: 10.1073/pnas.96.13.7300. [DOI] [PMC free article] [PubMed] [Google Scholar]
- 54.Bretscher A, Edwards K, Fehon RG. Nat Rev Mol Cell Biol. 2002;3(8):586–599. doi: 10.1038/nrm882. [DOI] [PubMed] [Google Scholar]
- 55.Dohi T, Xia F, Altieri DC. Mol Cell. 2007;27(1):17–28. doi: 10.1016/j.molcel.2007.06.004. [DOI] [PMC free article] [PubMed] [Google Scholar]
- 56.Mehrotra S, Languino LR, Raskett CM, Mercurio AM, Dohi T, Altieri DC. Cancer Cell. 2010;17(1):53–64. doi: 10.1016/j.ccr.2009.11.021. [DOI] [PMC free article] [PubMed] [Google Scholar]
- 57.Agarwal E, Brattain MG, Chowdhury S. Cell Signal. 2013;25(8):1711–1719. doi: 10.1016/j.cellsig.2013.03.025. [DOI] [PMC free article] [PubMed] [Google Scholar]
- 58.Shiue H, Musch MW, Wang Y, Chang EB, Turner JR. J Biol Chem. 2005;280(2):1688–1695. doi: 10.1074/jbc.M409471200. [DOI] [PMC free article] [PubMed] [Google Scholar]
- 59.Dan HC, Sun M, Kaneko S, Feldman RI, Nicosia SV, Wang HG, Tsang BK, Cheng JQ. J Biol Chem. 2004;279(7):5405–5412. doi: 10.1074/jbc.M312044200. [DOI] [PubMed] [Google Scholar]
- 60.Bulut G, Hong SH, Chen K, Beauchamp EM, Rahim S, Kosturko GW, Glasgow E, Dakshanamurthy S, Lee HS, Daar I, Toretsky JA, Khanna C, Uren A. Oncogene. 2012;31(3):269–281. doi: 10.1038/onc.2011.245. [DOI] [PMC free article] [PubMed] [Google Scholar]
- 61.Leiphrakpam PD, Agarwal E, Mathiesen M, Haferbier KL, Brattain MG, Chowdhury S. Oncol Rep. 2013;31(1):87–94. doi: 10.3892/or.2013.2819. [DOI] [PMC free article] [PubMed] [Google Scholar]
- 62.Heidegger I, Pircher A, Klocker H, Massoner P. Cancer Biol Ther. 11(8):701–707. doi: 10.4161/cbt.11.8.14689. [DOI] [PubMed] [Google Scholar]
- 63.Atzori F, Traina TA, Ionta MT, Massidda B. Target Oncol. 2009;4(4):255–266. doi: 10.1007/s11523-009-0123-z. [DOI] [PubMed] [Google Scholar]
- 64.Buck E, Gokhale PC, Koujak S, Brown E, Eyzaguirre A, Tao N, Rosenfeld-Franklin M, Lerner L, Chiu MI, Wild R, Epstein D, Pachter JA, Miglarese MR. Mol Cancer Ther. 9(10):2652–2664. doi: 10.1158/1535-7163.MCT-10-0318. [DOI] [PubMed] [Google Scholar]
- 65.Hedrick E, Agarwal E, Leiphrakpam P, Haferbier K, Brattain M, Chowdhury S. Journal of Molecular Signaling. 2013;8(1):10. doi: 10.1186/1750-2187-8-10. [DOI] [PMC free article] [PubMed] [Google Scholar]
- 66.Zhou R, Cao X, Watson C, Miao Y, Guo Z, Forte JG, Yao X. J Biol Chem. 2003;278(37):35651–35659. doi: 10.1074/jbc.M303416200. [DOI] [PubMed] [Google Scholar]
- 67.Jemal A, Bray F, Center MM, Ferlay J, Ward E, Forman D. CA Cancer J Clin. 2011;61(2):69–90. doi: 10.3322/caac.20107. [DOI] [PubMed] [Google Scholar]
- 68.Reinmuth N, Liu W, Fan F, Jung YD, Ahmad SA, Stoeltzing O, Bucana CD, Radinsky R, Ellis LM. Clin Cancer Res. 2002;8(10):3259–3269. [PubMed] [Google Scholar]
- 69.Weber MM, Fottner C, Liu SB, Jung MC, Engelhardt D, Baretton GB. Cancer. 2002;95(10):2086–2095. doi: 10.1002/cncr.10945. [DOI] [PubMed] [Google Scholar]
- 70.Peruzzi F, Prisco M, Dews M, Salomoni P, Grassilli E, Romano G, Calabretta B, Baserga R. Mol Cell Biol. 1999;19(10):7203–7215. doi: 10.1128/mcb.19.10.7203. [DOI] [PMC free article] [PubMed] [Google Scholar]
- 71.Myers MG, Jr, Grammer TC, Wang LM, Sun XJ, Pierce JH, Blenis J, White MF. J Biol Chem. 1994;269(46):28783–28789. [PubMed] [Google Scholar]
- 72.Ouban A, Muraca P, Yeatman T, Coppola D. Hum Pathol. 2003;34(8):803–808. doi: 10.1016/s0046-8177(03)00291-0. [DOI] [PubMed] [Google Scholar]
- 73.Bretscher A. J Cell Biol. 1983;97(2):425–432. doi: 10.1083/jcb.97.2.425. [DOI] [PMC free article] [PubMed] [Google Scholar]
Associated Data
This section collects any data citations, data availability statements, or supplementary materials included in this article.