Abstract
Through echolocation, a bat can perceive not only the position of an object in the dark; it can also recognize its 3D structure. A tree, however, is a very complex object; it has thousands of reflective surfaces that result in a chaotic acoustic image of the tree. Technically, the acoustic image of an object is its impulse response (IR), i.e., the sum of the reflections recorded when the object is ensonified with an acoustic impulse. The extraction of the acoustic IR from the ultrasonic echo and the detailed IR analysis underlies the bats' extraordinary object-recognition capabilities. Here, a phantom-object playback experiment is developed to demonstrate that the bat Phyllostomus discolor can evaluate a statistical property of chaotic IRs, the IR roughness. The IRs of the phantom objects consisted of up to 4,000 stochastically distributed reflections. It is shown that P. discolor spontaneously classifies echoes generated with these IRs according to IR roughness. This capability enables the bats to evaluate complex natural textures, such as foliage types, in a meaningful manner. The present behavioral results and their simulations in a computer model of the bats' ascending auditory system indicate the involvement of modulation-sensitive neurons in echo analysis.
The neural interpretation of sensory input into an object-based sensory scenery is a major focus in neuroscience. The echolocation of bats and dolphins is an ideal model system, because echolocating mammals have perfect control over their sensory data acquisition due to the active nature of echolocation. A useful analysis of the acoustic scenes, as they are represented in sequences of echoes, requires the identification of the acoustically complex objects surrounding the animals in their natural habitat. Many studies have provided insights into the extraordinary capabilities of echolocating animals in object recognition and classification (1–12).
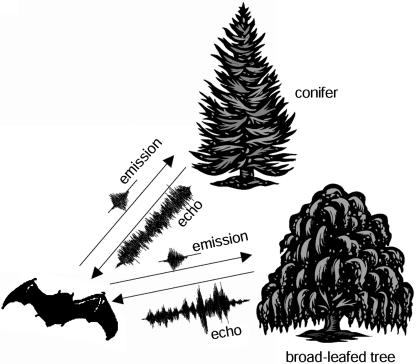
In their natural nocturnal habitat, bats are forced to orient in and navigate through a highly structured environment. How can echolocation serve these tasks? The echoes produced by potential landmarks for orientation, such as trees or bushes, are highly chaotic: the ultrasonic emission of a bat is reflected from a multitude of surfaces, the leaves, which are chaotically distributed in space and angle to the sound source and receiver. Thus, the echoes reflected from such an object will have a chaotic waveform and no systematic spectral interference pattern (Fig. 1). Moreover, the echoes are highly unstable over time, because they are susceptible to both changes of the bat's observation angle and, e.g., wind-induced movement of the object. Thus, a bat will rarely receive the same echo of an individual object twice.
Fig. 1.
Illustration of sonar emissions of a bat and the echoes it may receive from different foliage types. Note that a conifer produces a smoother echo than a broad-leafed tree.
Until now, object recognition in echolocation has been studied only with deterministic echoes from small objects with very few reflections. The echoes from such objects can be evaluated according to their characteristic waveforms and/or frequency patterns (2, 9, 13). However, these concepts appear insufficient to describe the analysis of the chaotic echoes a bat has to cope with in its natural habitat.
An echo as it is perceived by a bat consists of its ultrasonic emission convolved with the acoustic impulse response (IR) of the ensonified object. The IR is the sum of the reflections when the object is ensonified with an acoustic impulse of theoretically infinite shortness and infinite amplitude. Thus, the IR is a physical object property, whereas the echo as it is perceived by a bat also depends on the structure of the emitted sound.
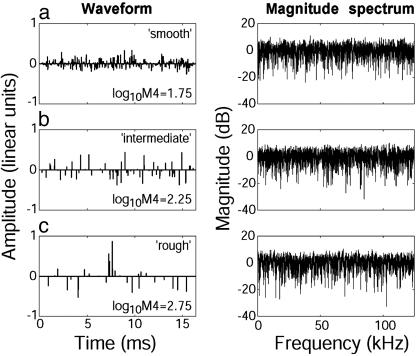
What are the typical characteristics of the IRs of large natural objects? A conifer, for example, has needle-shaped densely distributed leaves, i.e., many surfaces, each of them producing only a faint reflection. Thus the IR will consist of many chaotically distributed reflections, each with a relatively low amplitude. A synthetic IR with these characteristics is shown in Fig. 2a. In contrast, a broad-leafed tree has fewer surfaces, each of them producing a stronger reflection. Thus the IR will consist of fewer chaotically distributed reflections, each with a relatively larger amplitude (Fig. 2c). Thus, although both IRs are chaotic, they will differ in the statistical description of their envelopes: a conifer has a smoother IR than a broad-leafed tree (Fig. 1). Recent theoretical work has confirmed the power of statistical echo analysis for the classification of large natural objects (14).
Fig. 2.
Three examples of complex IRs with increasing roughness (from a to c) as used in the experiments. IR roughness is quantified as the log10M4 (see Methods). The IRs are plotted as waveform (Left) and magnitude spectrum (Right). Every nonzero amplitude value in the waveform represents a single reflection from a surface of a complex object. Note the frequency-independent magnitude spectrum of all three IRs despite the large waveform differences. Each IR had a duration of 16.4 ms and equal rms amplitude.
This study investigates whether bats are able to evaluate statistical properties of complex IRs in a behavioral experiment. The fruit-eating bat, Phyllostomus discolor, was trained to evaluate echoes digitally generated from their ultrasonic emissions and IRs with up to 4,000 reflections.
Methods
Animals. The experimental animal, the lesser spear-nosed bat, P. discolor, forages for fruit, nectar, pollen, and insects in a neotropical forest habitat. Hence, this species has to navigate through highly structured surroundings. P. discolor emits brief (<3-ms) broadband multiharmonic echolocation calls covering the frequency range between 45 and 100 kHz (15). Four female individuals took part in the experiments.
Stimuli. We created complex IRs with different degrees of roughness; each IR consisted of a 4,096-sample portion of sparse noise (16). Sparse noise is a Gaussian noise with random-width temporal gaps (nulls) between the amplitude values. The different degrees of roughness were achieved by varying the average width of the temporal gaps. All of the resulting IRs had chaotic waveforms and frequency-independent magnitude spectra (Fig. 2). We quantified the IR roughness by calculating the base-10 logarithm of the fourth moment (log10M4) of the IRs (17). The fourth moment is calculated as
 |
where x(t) is the time-domain representation, and T is the duration of the IR.
For the initial training of the animals, two specific training IRs were used, a smooth one (log10M4 = 1.75, Fig. 2a) and a rough one (log10M4 = 2.75, Fig. 2c). For the stimulation in the test trials, we used 50 test IRs in five groups defined by their average log10M4. The five groups of IRs had a roughness of 1.75 ± 0.005, 2.0 ± 0.005, 2.25 ± 0.006, 2.5 ± 0.016, and 2.75 ± 0.026. Error values represent standard deviations. Thus, each group contained 10 individual IRs with a similar roughness. Fig. 2 shows three examples of the IRs used. All IRs had the same rms amplitude. At the given sampling rate (250 kHz), the IRs had a duration of 16.4 ms, corresponding to an object depth of ≈2.8 m.
Experimental Setup. The bats were trained in a two-alternative forced-choice playback setup, consisting of a horizontal Y-shaped maze (45 × 30 cm; wire mesh) in an echo-attenuated chamber. A starting perch was located at the bottom leg of the Y, and a reward feeder was mounted at the end of each upper leg. The inner width of each leg was 10 cm. To indicate its decision, the bat had to crawl from the starting perch to the reward feeder in either the left or the right upper leg of the maze. For the playback of the echoes, an ultrasonic speaker (Matsushita EAS10 TH800D, Osaka) was mounted centrally between the upper legs of the Y maze, directed toward the starting perch. Further, a 1/4-inch ultrasonic microphone (Brüel & Kjaer Instruments 4135, Naerum, Denmark) was located on top of the speaker to pick up the sonar emissions of the bat. The microphone speaker unit was located at 25-cm distance from the perch. During the experiment, the amplified and band-pass filtered (20–100 kHz, 24 dB/oct, Krohn Hite 3550, Brockton, MA) echolocation calls were digitized by a data-acquisition board (Microstar DAP 5200a, Bellevue, WA) at a sampling rate of 250 kHz. Each recorded call was convolved with a specific IR on the DAP board by multiplication of the complex spectra of the recorded emission, zero-padded to 4,096 samples, and the IR. This mathematical operation corresponds to the physical formation of the echo from a real object. Thus, any change of the bat's ultrasonic emission resulted in an immediate change of the perceived echo. The resulting echo was converted from digital to analogue and played back to the bat after a total delay of 18 ms relative to emission. This delay corresponds to a target distance of ≈3 m.
Procedure. First, four individuals were trained in a two-alternative forced-choice paradigm to discriminate two specific IRs. A smooth IR (Fig. 2a) was associated with a food reward at the left feeder. A rough IR (Fig. 2c) was associated with a reward at the right feeder.
Data acquisition started when the bats had achieved a performance of at least 85% correct choices in this discrimination task. Then, test trials were randomly interspersed with a probability of 25%. In these test trials, one of the 50 unknown IRs was presented, and the bats were rewarded independently of their decision. Behavioral results are based on at least 40 test trials per animal and IR group.
Simulations. The classification of the IRs was simulated based on one of two representations of the perceived echoes: the auditory spectrograms or the output of a modulation filterbank. These representations were obtained from a detailed computer model of the auditory peripheral processing in P. discolor. This model was fed with echoes, i.e., with the experimental IRs convolved with a typical P. discolor echolocation call. We have simulated the manipulation of acoustic stimuli applied both by the animals' outer and middle ear (18) and by cochlear processing based on distortion-product otoacoustic emission suppression tuning curves (19). Inner-hair cell processing was simulated by half-wave rectification, exponential compression (exponent = 0.4), and filtering with a second-order low-pass filter at 1 kHz (20) to simulate the loss of phase locking. These manipulations resulted in an auditory-spectrogram representation of the perceived echoes. In the first simulation, these auditory spectrograms, arranged along the time- and auditory-frequency axes, were considered as the model output.
For the second simulation, the auditory spectrograms were fed into a modulation filterbank model (21, 22) with 10 modulation filters with center frequencies logarithmically spaced between 30 and 500 kHz. The model output for the second simulation was the alternating current-coupled rms of the modulation-filterbank output (23).
The model decisions were based on the similarity of the model output computed with a test IR relative to the model outputs computed with the two training IRs. The similarity was quantified as the rms distance (Euclidean distance) between the different model outputs.
For each test IR, classification performance in percent was calculated according to the following equation
 |
where EDsmooth is the Euclidean distance between the model outputs computed with a test IR and the smooth training IR, and EDrough is the Euclidean distance between the model outputs computed with a test IR and the rough training IR.
Results
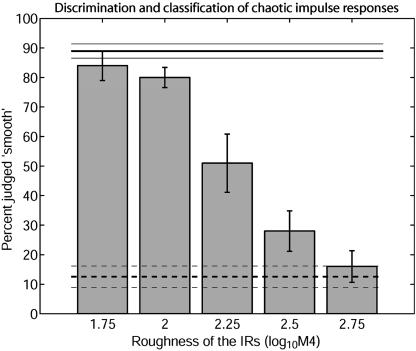
Behavioral Performance. In a two-alternative forced-choice paradigm, the four individuals were successfully trained to discriminate a single smooth IR (Fig. 2a) from a single rough one (Fig. 2c). The horizontal lines in Fig. 3 show the bats' discrimination performance recorded in the subsequent test phase.
Fig. 3.
Discrimination and classification of chaotic IRs by P. discolor. Performance is quantified as percent of trials judged as smooth. The solid and dashed strong horizontal lines show the discrimination of the smooth and rough IR in the training trials, respectively. The thin horizontal lines represent standard errors. The bars show the spontaneous classification of unknown chaotic IRs as a function of IR roughness. The bats' spontaneous classification is monotonically related to the IR roughness. Error bars represent interindividual standard errors.
In this test phase, we investigated to which extent the bats can generalize roughness to test IRs that the bats had not experienced before. The spontaneous responses to these test IRs are shown in Fig. 3 as a function of IR roughness. The five bars represent the bats' spontaneous classification of unknown test IRs from the five groups with an IR roughness as specified on the abscissa.
The bars show that spontaneous classification is monotonically related to IR roughness: unknown IRs with low roughness were spontaneously judged “smooth” in a high percentage of test trials; unknown IRs with high roughness were only rarely judged “smooth.” IRs with intermediate roughness resulted in a similar amount of smooth or rough judgements.
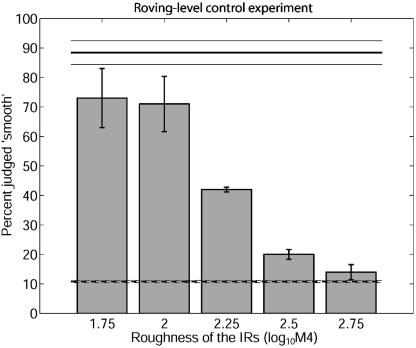
Human psychophysical studies have shown that stimuli with the same sound pressure level and long-term spectrum can produce different degrees of masking (24, 25) and loudness (26) depending on their degree of envelope fluctuation. To investigate whether the bats may have based their decisions on differences in perceived echo loudness, we repeated the classification experiment with a roving-level paradigm: the echoes of the training IRs were attenuated by 6 dB compared to the level in the original paradigm; the echoes of the test IRs were presented at levels roving by ±6 dB around that of the training IRs. The results of this control experiment, performed with two of the four bats are shown in Fig. 4. The IRs were classified in the same manner as in the original experiment. This control experiment shows that the classification performance of the bats was not based on differences in perceived echo loudness.
Fig. 4.
Classification of chaotic IRs by two P. discolor in a roving-level paradigm. Classification performance is plotted in the same format as in Fig. 3. The echoes in the training trials (horizontal lines) were attenuated by 6 dB relative to the main experiment. The echoes in the test trials were played back at randomized levels (±6 dB) roving around that of the training echoes. Note that the bats spontaneously classified the IRs in a similar way as shown in Fig. 3.
How may the bats' auditory systems evaluate echo roughness? As stated above, the bat does not perceive the IR as such but the IR imprinted on its own sonar emission, an echo. A spectral analysis of the echo envelope shows that the envelope spectrum is monotonically related to the echo roughness. In the mammalian auditory system, properties of the envelope spectrum can be encoded by modulation-sensitive neurons. Hence, it is conceivable that modulation-sensitive neurons described in the bats' auditory brainstem (27–29) can encode the roughness of perceived echoes.
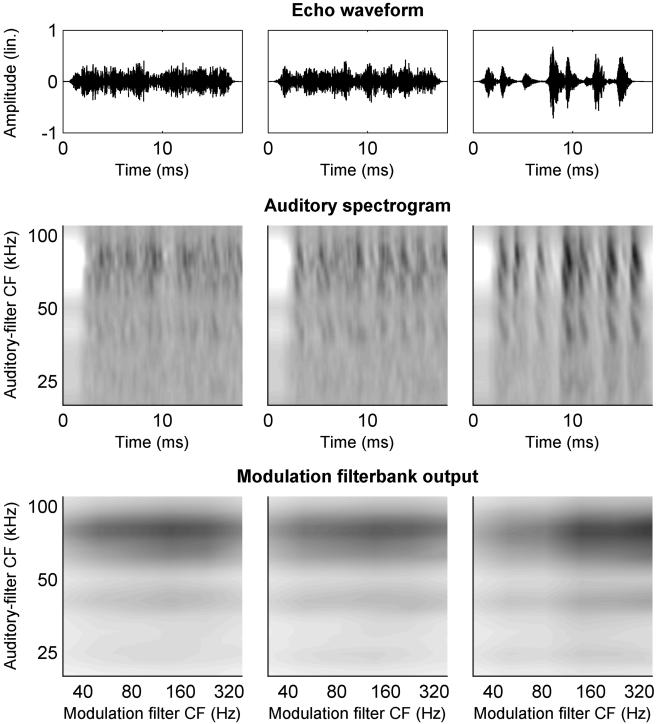
Simulation Results. As outlined in Methods, simulations of the behavioral performance were based on either auditory-spectrogram representations of the perceived echoes or on the outputs of a hypothetical modulation filterbank as a functional implementation of neural envelope analysis. Exemplary representations of the echo waveforms, the generated auditory spectrograms, and the modulation filterbank outputs are shown in Fig. 5.
Fig. 5.
Simulated echoes generated with IRs as used in the behavioral experiments and their auditory representations as simulated in a computer model of the peripheral auditory system of P. discolor.(Left and Right) Representations for the two IRs used in training; (Center) representation for a single test IR from the IR group with a log10M4 of 2.0. (Top) Echo waveforms; (Top Center) simulated auditory spectrograms; (Bottom) simulated modulation filterbank outputs. The gray scale (Middle and Bottom) encodes the simulated neural activation in arbitrary units.
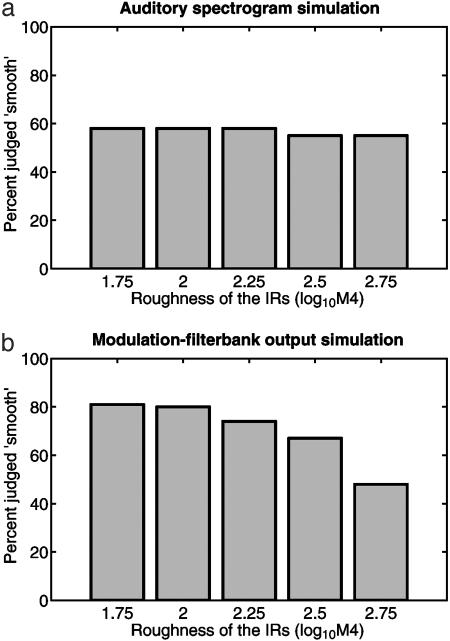
Simulation results are shown in Fig. 6. The simulation based on similarities in the auditory spectrograms (Fig. 6a) shows only a weak correlation to the bats' performance in the experiment.
Fig. 6.
Simulation results of the behavioral performance based on two different auditory representations of the generated echoes. The simulation based on auditory spectrograms (a) provides a poor fit to the experimental data (Fig. 3) because, in the auditory spectrogram, the temporal structure of the echo waveform is encoded in a deterministic fashion. A subsequent analysis of the auditory spectrograms in a modulation filterbank (b) provides a better representation of echo roughness and consequently results in an improved fit to the experimental data.
The simulation based on similarities in the modulation filterbank outputs (Fig. 6b) generates a better fit to the behavioral data. This is true despite the fact that the modulation filterbank outputs appear not to vary very much with IR roughness (Fig. 5 Bottom).
Discussion
The present results show that echolocating bats spontaneously evaluate and generalize the roughness of chaotic IRs. Such chaotic IRs arise from large natural objects like trees and bushes, and they are thus abundant in the animals' natural habitat.
Which neural processing strategies may underlie the analysis of IR roughness? The bats do not perceive the IR of an object but the object's IR convolved with their sonar emission, i.e., an echo. Earlier studies have indicated that bats may be able to reconstruct the IR from the detailed comparison of their sonar emission and the echo (2, 9). However, it is not clear whether P. discolor can do so with such complicated IRs consisting of thousands of reflections. Thus, at present we simulate the auditory analysis of chaotic echoes based on the echoes themselves, not on the IRs.
The simulation results show that an auditory spectrogram representation of the perceived echoes, as it would exist in the bats' auditory nerve, does not provide a reliable estimate of IR roughness. The deterministic encoding of the echo temporal structure in the auditory spectrograms precludes a successful evaluation of statistical echo properties.
When the information from the auditory nerve is subjected to a modulation-filterbank analysis, the modulation-filterbank output provides an improved fit to the experimental data. The success of the modulation-filterbank simulation results from the stability of the filterbank output across different realizations of stochastic IRs with similar roughness.
The modulation filterbank analysis revealed that modulation magnitude in the modulation frequency range ≈80–200 Hz can be used to evaluate the roughness of the experimental echoes. Modulation-sensitive units covering this range have been characterized physiologically in bats (28, 29). Thus, the simulations support the hypothesis that modulation-sensitive neurons, e.g., in the auditory midbrain may play an important role in the processing of stochastic echoes.
However, even with a modulation-filterbank analysis, the fits to the experimental data are not fully satisfactory. Better fits to the experimental data can be obtained if a simulation was based on the evaluation of the IR itself, not on the echo. This, however, requires the preceding reconstruction of the IR from the echo. Future studies will reveal to which extent P. discolor can reconstruct the IR of complex objects having thousands of reflective surfaces.
In previous research, chaotic echoes from natural textures have mostly been regarded as disturbing “clutter.” In light of the current data, these chaotic echoes should be regarded as a contribution to a meaningful acoustic image of the bat's surroundings.
It is conceivable that for flying bats, the perception of an acoustic stream on the basis of changes of echo roughness facilitates navigation guided by echolocation. The spontaneous classification of unknown chaotic IRs along an ecologically meaningful parameter indicates the significance of a statistical evaluation of echo properties for the natural behavior of bats.
Acknowledgments
We thank Gerhard Neuweiler, Benedikt Grothe, John Casseday, and Gerd Schuller for helpful comments on earlier versions of this paper. Many thanks also to Maike Schuchmann for support in the training of the bats. This work was supported by the Deutsche Forschungsgemein-schaft, Wi1518/6 (to L.W.).
This paper was submitted directly (Track II) to the PNAS office.
Abbreviations: IR, impulse response; log10M4, base 10 logarithm of the waveform fourth moment.
References
- 1.Harley, H. E., Putman, E. A. & Roitblat, H. L. (2003) Nature 424, 667–669. [DOI] [PubMed] [Google Scholar]
- 2.Weissenbacher, P. & Wiegrebe, L. (2003) Behav. Neurosci. 117, 833–839. [DOI] [PubMed] [Google Scholar]
- 3.Harley, H. E., Roitblat, H. L. & Nachtigall, P. E. (1996) J. Exp. Psychol. Anim. Behav. Process. 22, 164–174. [DOI] [PubMed] [Google Scholar]
- 4.Helweg, D. A., Roitblat, H. L., Nachtigall, P. E. & Hautus, M. J. (1996) J. Exp. Psychol. Anim Behav. Process. 22, 19–31. [PubMed] [Google Scholar]
- 5.Herman, L. M., Pack, A. A. & Hoffmann-Kuhnt, M. (1998) J. Comp. Psychol. 112, 292–305. [DOI] [PubMed] [Google Scholar]
- 6.von Helversen, D. & von Helversen, O. (2003) J. Comp. Physiol. A 189, 327–336. [DOI] [PubMed] [Google Scholar]
- 7.Dror, I. E., Zagaeski, M. & Moss, C. F. (1995) Neural Networks 8, 149–160. [Google Scholar]
- 8.Moss, C. F. & Simmons, J. A. (1993) J. Acoust. Soc. Am. 93, 1553–1562. [DOI] [PubMed] [Google Scholar]
- 9.Simmons, J. A., Moss, C. F. & Ferragamo, M. (1990) J. Comp. Physiol. A 166, 449–470. [DOI] [PubMed] [Google Scholar]
- 10.Simmons, J. A., Saillant, P. A., Wotton, J. M., Haresign, T., Ferragamo, M. J. & Moss, C. F. (1995) Neural Networks 8, 1239–1261. [Google Scholar]
- 11.Saillant, P. A., Simmons, J. A., Dear, S. P. & McMullen, T. A. (1993) J. Acoust. Soc. Am. 94, 2691–2712. [DOI] [PubMed] [Google Scholar]
- 12.Simmons, J. A. (1979) Science 204, 1336–1338. [DOI] [PubMed] [Google Scholar]
- 13.Schmidt, S. (1988) Nature 331, 617–619. [DOI] [PubMed] [Google Scholar]
- 14.Müller, R. & Kuc, R. (2000) J. Acoust. Soc. Am. 108, 836–845. [DOI] [PubMed] [Google Scholar]
- 15.Rother, G. & Schmidt, U. (1982) Z. Säugetierk. 47, 324–334. [Google Scholar]
- 16.Hübner M. & Wiegrebe L. (2003) J. Comp. Physiol. A 189, 337–346. [DOI] [PubMed] [Google Scholar]
- 17.Hartmann, W. M. & Pumplin, J. (1988) J. Acoust. Soc. Am. 83, 2277–2289. [DOI] [PubMed] [Google Scholar]
- 18.Esser, K. H. & Daucher, A. (1996) J. Comp. Physiol. A 178, 779–785. [DOI] [PubMed] [Google Scholar]
- 19.Wittekindt, A. (2003) Ph.D. thesis (University of Frankfurt, Frankfurt, Germany).
- 20.Palmer, A. R. & Russell, I. J. (1986) Hear. Res. 24, 1–15. [DOI] [PubMed] [Google Scholar]
- 21.Dau, T., Kollmeier, B. & Kohlrausch, A. (1997) J. Acoust. Soc. Am. 102, 2892–2905. [DOI] [PubMed] [Google Scholar]
- 22.Dau, T., Kollmeier, B. & Kohlrausch, A. (1997) J. Acoust. Soc. Am. 102, 2906–2919. [DOI] [PubMed] [Google Scholar]
- 23.Ewert, S. D. & Dau, T. (2000) J. Acoust. Soc. Am. 108, 1181–1196. [DOI] [PubMed] [Google Scholar]
- 24.Kohlrausch, A. & Sander, A. (1995) J. Acoust. Soc. Am. 97, 1817–1829. [DOI] [PubMed] [Google Scholar]
- 25.Carlyon, R. P. & Datta, A. J. (1997) J. Acoust. Soc. Am. 101, 3648–3657. [DOI] [PubMed] [Google Scholar]
- 26.Gockel, H., Moore, B. C. J., Patterson, R. D. & Meddis, R. (2003) J. Acoust. Soc. Am. 114, 978–990. [DOI] [PubMed] [Google Scholar]
- 27.Huffman, R. F., Argeles, P. C. & Covey, E. (1998) Hear. Res. 126, 161–180. [DOI] [PubMed] [Google Scholar]
- 28.Huffman, R. F., Argeles, P. C. & Covey, E. (1998) Hear. Res. 126, 181–200. [DOI] [PubMed] [Google Scholar]
- 29.Grothe, B., Covey, E. & Casseday, J. H. (2001) J. Neurophysiol. 86, 2219–2230. [DOI] [PubMed] [Google Scholar]


