Abstract
Somatic cell nuclear transfer is used to generate genetic models for research and new, genetically modified livestock varieties. Goat fetal fibroblast cells (gFFCs) are the predominant nuclear donors in Cashmere goat transgenic cloning, but have disadvantages. We evaluated the potential of goat adipose-derived mesenchymal stem cells (gADSCs) and goat skeletal muscle-derived satellite cells (gMDSCs) for somatic cell nuclear transfer, evaluating their proliferation, pluripotency, transfection efficiency and capacity to support full term development of embryos after additive gene transfer or homologous recombination. gADSCs and gMDSCs were isolated by enzyme digestion and differentiated into neurocytes, myotube cells and insulin-producing cells. Neuron-specific enolase, fast muscle myosin and insulin expression were determined by immunohistochemistry. Following somatic cell nuclear transfer with donor cells derived from gADSCs, gMDSCs and gFFCs, transfection and cloning efficiencies were compared. Red fluorescent protein levels were determined by quantitative PCR and western blotting. 5-Methylcytosine, H4K5, H4K12 and H3K18 were determined immunohistochemically. gADSCs and gMDSCs were maintained in culture for up to 65 passages, whereas gFFCs could be passaged barely more than 15 times. gADSCs and gMDSCs had higher fluorescent colony forming efficiency and greater convergence (20%) and cleavage (10%) rates than gFFCs, and exhibited differing H4K5 histone modification patterns after somatic cell nuclear transfer and in vitro cultivation. After transfection with a pDsRed2-1 expression plasmid, the integrated exogenous genes did not influence the pluripotency of gADSCs–pDsRed2-1 or gMDSCs–pDsRed2-1. DsRed2 mRNA expression by cloned embryos derived from gADSCs–pDsRed2-1 or gMDSCs–pDsRed2-1 was more than twice that of gFFCs–pDsRed2-1 embryos (P<0.01). Pregnancy rates of gADSCs–pDsRed2-1 and gMDSCs–pDsRed2-1 recipients were higher than those of gFFCs–pDsRed2-1 recipients (P<0.01). With their high proliferative capacity and transfection efficiency, gADSCs and gMDSCs are a valuable cell source for breeding new, genetically modified varieties of livestock by somatic cell nuclear transfer.
Introduction
In recent years genetically engineered pigs have been produced for xenotransplantation [1] and cattle have been successfully produced by somatic cell nuclear transfer (SCNT) [2]. The breeding and application of new genetically modified varieties of Arbas cashmere goats with high economic value is strategically significant for modern animal husbandry.
The establishment of mouse embryonic stem cells (ESCs) has promoted the development of ESC-based gene targeting technology. Accurate and efficient gene knockout and knock in are now possible in mouse models. Because the isolation and culture of ESCs from large animals is relatively more difficult, there has been no successful long term culture of goat ESCs; thus, goat ESCs cannot be used in transgenic animal cloning research. In addition, SCNT using pools of stable transfected cell clones is an efficient means of producing transgenic goats with appropriate expression patterns [3], [4] and has facilitated the generation of goat models with inducible transgene expression [5]. Among the various parameters influencing the outcome of SCNT, including oocyte quality, embryo culture and recipient animal preparation, the type and quality of the nuclear donor cells are of vital importance [6].
Many primary cell lines established after passaging a primary culture have been used for SCNT in pigs, differing with respect to cell type, source organ, and the age and gender of the donor animal. Among these lines, mesenchymal stem cells have been precisely characterized [7], [8]. These cells have been tested for their efficiency in SCNT experiments in pigs, but further characterization of, for example, the specific cell types and their morphology, proliferation and lifespan is mostly lacking. The efficiency of genetic modification of cells also depends on the effective introduction of DNA vectors into the cells.
Adipose-derived mesenchymal stem cells (ADSCs) and skeletal muscle-derived satellite cells (MDSCs) are both derived from the mesoderm of adult pluripotent stem cells, though their pluripotency is less than that of ESCs, they have a high degree of proliferation, self-renewal and differentiation potential. Under different induction conditions, ADSCs and MDSCs can differentiate into bone, cartilage, muscle, tendon or fat mesodermal cells, and can also differentiate into nerve cells and hepatic oval cells [9], [10], [11], [12], [13]. Here, we characterize for the first time goat MDSCs (gMDSCs) isolated and cultured in vitro in terms of their proliferation capacity, morphologic appearance and uptake of exogenous DNA after transfection. The method for the in vitro separation and culture of Arbas cashmere goat ADSCs (gADSCs) has been previously published [14].
The present study aimed to establish a nuclear transfer technology system for Arbas cashmere goats and to investigate the use of gADSCs and gMDSCs as cell sources for SCNT compared with goat fetal fibroblast cells (gFFCs), including their proliferation capacity, pluripotency, transfection efficiency and capacity to support full term development of SCNT embryos after additive gene transfer or homologous recombination. The study’s aim of using ADSCs and MDSCs for SCNT mediated transgenesis in Arbas cashmere goats was achieved.
Materials and Methods
Ethics Statement
All studies adhered to procedures consistent with the International Guiding Principles for Biomedical Research Involving Animals issued by the Council for the International Organizations of Medical Sciences and were approved by the Institutional Animal Care and Use Committee of Inner Mongolia University. The owner of the YiWei White Cashmere Goat Farm also gave permission for the study.
Materials
Arbas white cashmere goat fetuses (40 days) were obtained from the Experimental Animal Center of Inner Mongolia University. Females were maintained under pathogen-free conditions.
Isolation and Identification of gMDSCs
gMDSCs were isolated using the method we have described previously [15]. Briefly, skeletal muscle from the leg was cut into 1–2 mm3 fragments, digested with 0.1% type I collagenase (C0130; Sigma–Aldrich, St. Louis, MO) in phosphate buffered saline (PBS) (14190-250; Invitrogen Corp., Carlsbad, CA ) for 1 h at 37°C in a water bath with shaking, and centrifuged at 150 g for 5 min. The supernatant was discarded and the pellet was resuspended in 0.25% trypsin (25200-056; Invitrogen Corp., Carlsbad, CA) and incubated for 20 min at 37°C. Fetal bovine serum (FBS) (12664-025; Invitrogen Corp., Carlsbad, CA) was added to the pellet, the mixture was centrifuged, and the pellet was resuspended in growth medium (Dulbecco’s modified Eagle’s medium [DMEM]/F12 [11320-082; Invitrogen Corp., Carlsbad, CA] containing 20% FBS, 10% horse serum [HS] [26050-088; Invitrogen Corp., Carlsbad, CA] and 1% penicillin/streptomycin [15140-122; Invitrogen Corp., Carlsbad, CA]). After repeated pipetting, the cells were passed through a 200 mesh sieve and centrifuged (150 g for 5 min).
The cells were plated in six-well plates coated with 0.1% gelatin (53028; Sigma–Aldrich, St. Louis, MO) at a density of 1 × 10⁶/well. gMDSCs were purified using the differential adhesion method and cultured in growth medium.
gMDSCs (1 × 10⁴ cells/well) were seeded in 24-well plates. The cells were fixed with 4% paraformaldehyde (16005; Sigma–Aldrich, St. Louis, MO) at 80% confluence for 30 min, permeabilized with PBS containing 0.1% (vol/vol.) Triton X-100 (T8787; Sigma–Aldrich, St. Louis, MO) and incubated with 3% bovine serum albumin (BSA) (A2058; Sigma–Aldrich, St. Louis, MO) in PBS for 2 h. The cells were then incubated with primary detection antibodies; desmin (ab32362; Abcam, Cambridge, UK), sarcomeric alpha-actinin (ab9465; Abcam, Cambridge, UK), MyoD1 (ab64159; Abcam, Cambridge, UK), Myf5 (ab125301; Abcam, Cambridge, UK) and PAX7 (ab34360; Abcam, Cambridge, UK) were diluted with 2% BSA to 1/200 at room temperature for 1 h. After washing in PBS, the cells were incubated with a mixture of fluorescein isothiocyanate (FITC)-conjugated goat anti-rabbit secondary antibodies (ab97050; Abcam, Cambridge, UK) and DAPI (D9542; Sigma–Aldrich, St. Louis, MO). The primary antibody was replaced with PBS for a negative control. Cell staining was viewed under a confocal microscope (A1; Nikon, Tokyo, Japan).
gMDSCs Freeze–thaw and Growth Curve
gMDSCs at different passage numbers were mixed with a freezing protective agent (10% DMEM/F12+10% dimethyl sulfoxide [DMSO] [D2650; Sigma–Aldrich, St. Louis, MO] +80% HS) at 0.5 × 10⁶ cells/mL at –80°C for 24 h, and stocked in liquid nitrogen; before use, they were thawed quickly at 37°C. Cells at passage 50 were used to obtain growth curves. The cells were adjusted to 1 × 10⁴ cells/well and seeded in 24-well plates. Beginning the next day, cells were harvested from three wells for cell counting, continuing daily for 8 days to generate a growth curve.
Apoptosis of gADSCs and gMDSCs in vitro
Fiftieth passage gADSCs and gMDSCs were washed twice with cold PBS and then cells at a concentration of 1 × 10⁶/mL were resuspended with 1× Binding Buffer, which was a constituent of the FITC Annexin V Apoptosis Detection Kit (556547; Becton Dickinson Biosciences, San Jose, CA), by centrifugation. One hundred microliters of cell suspension was taken into a centrifuge tube and 5 μL FITC-Annexin V and 5 μL propidium iodide (PI) were added with gentle vortexing, followed by incubation at room temperature for 15 min. Finally, another 400 ul 1× Binding Buffer was added to each tube. Apoptosis was detected by flow cytometry within 1 h.
Neurogenic Differentiation and Identification
For neurogenic induction, 70% confluent gADSCs and gMDSCs were cultured in DMEM/F12 medium supplemented with 10 ng/mL epidermal growth factor (G5021; Promega, Madison, WI) plus 10 ng/mL basic fibroblast growth factor (bFGF) (G5071, Promega, Madison, WI) for 24 h. Subsequently, the medium was changed to DMEM/F12 supplemented with 1 mM β-mercaptoethanol (21985-023, Gibco, Gaithersburg, MD) and 10% FBS for 6 h for induction. The cells were then washed three times with PBS to remove β-mercaptoethanol and cultured in DMEM/F12 supplemented with 2% DMSO, 200 μM butylated hydroxyanisole (20021; Sigma–Aldrich, St. Louis, MO) and 20 ng/mL bFGF. When neuron-like cells were observed, the cells were stained with neuron-specific enolase (NSE) antibody (ab53025; Abcam, Cambridge, UK) and examined by immunofluorescence [11].
Myogenic Induction and Identification
Fifth passage gADSCs and gMDSCs were seeded into six-well plates (1 × 10⁵ cells/mL) and cultured to 80% confluence; the medium was then replaced with myoblast induction medium. For gADSCs, the myoblast induction medium was DMEM/F12 supplemented with 10% FBS and 18 mg/mL hydrocortisone (H0135; Sigma–Aldrich, St. Louis, MO); for gMDSCs, the myoblast induction medium was DMEM/F12 supplemented with 10% HS. When thick, short or narrow, long club-shaped cells were observed, the cells were stained with 5 mg/L Hoechst 33342 (14533; Sigma–Aldrich, St. Louis, MO) to detect cell fusion. The cells were also fixed and stained using an antibody to detect myosin (ab108923; Abcam, Cambridge, UK), a marker of muscle differentiation, as previously described [16].
Insulin-producing Cell Induction and Identification
gADSCs and gMDSCs were induced in vitro by incubation in DMEM Low Glucose (12320-032; Invitrogen Corp., Carlsbad, CA) containing 5% DMSO for 3 days, followed by culture in DMEM High-Glucose (10569-010; Invitrogen Corp., Carlsbad, CA) containing 10% FBS for 1 week. Cells cultured in DMEM/Low Glucose medium containing 10% FBS alone served as the control. After 10 days of culture, dithizone (D704; Sigma–Aldrich, St. Louis, MO) was used to confirm the induction of insulin-producing cells.
G418 Sensitivity of gADSCs, gMDSCs and gFFCs
Second passage gADSCs, gMDSCs and gFFCs were incubated in 24-well plates (1 × 10⁵ cells/well). At 80% confluence, G418 (A1720; Sigma–Aldrich, St. Louis, MO) was added to triplicate wells at final concentrations of 100, 200, 300, 400, 500, 600, 700, 800, 900 or 1000 μg/mL. The medium was changed every 2 days for 14 days and the time at which all cells were dead was recorded. The optimal concentration for selection was defined as the lowest concentration at which all cells died within 5–6 days.
Transfection and Selection
To investigate the effect of exogenous genes on gMDSC- and gMDSC-derived cloned embryo development, we used pDsRed2-1 (632405, Clontech, Santa Clara, CA) as an exogenous vector. gADSCs, gMDSCs and gFFCs were cultured in 24-well plates (1 × 10⁵ cells/well) for 24 h before transfection with pDsRed2-1 using Lipofectamine LTX and Plus Reagent (15338-100, Invitrogen Corp., Carlsbad, CA) according to the manufacturer’s protocol. The transient transfection efficiency was evaluated by flow cytometry. Similarly, gADSCs, gMDSCs and gFFCs were cultured in 100 mm plates for G418 and fluorescence screening, resulting in gADSCs–pDsRed2-1, gMDSCs–pDsRed2-1 and gFFCs–pDsRed2-1. After 10 days, colony forming efficiency was calculated. Neurogenic, myogenic and insulin-producing cell differentiation was induced in gADSCs–pDsRed2-1, gMDSCs–pDsRed2-1 and gFFCs–pDsRed2-1, respectively, as described above.
Use of gADSCs–pDsRed2-1, gMDSCs–pDsRed2-1 and gFFCs–pDsRed2-1 as Nuclear Donors for SCNT
Ovaries were collected into 0.9% NaCl solution and dissected using a surgical scalpel to release cumulus–oocyte complexes (COCs). Well-formed COCs were identified by light microscopy on the basis of integrated cumulus cells, tight wrapping and having at least three layers of cumulus cells. Selected COCs were incubated in maturation medium (TCM199 [11150-059; Invitrogen Corp., Carlsbad, CA] +10% estrous goat serum [homemade] [17] +10 mM Hepes [H4034; Sigma–Aldrich, St. Louis, MO] +0.1 μg/mL 17β-estradiol [C13213100; Wako, Osaka, Japan] +10 μg/mL follicle stimulating hormone [F2293; Sigma–Aldrich, St. Louis, MO] +8 g/mL luteinizing hormone [L6420; Sigma–Aldrich, St. Louis, MO] +0.22 mg/mL sodium pyruvate [P4562; Sigma–Aldrich, St. Louis, MO]) and equilibrated at 38.5°C in an atmosphere of 5% CO2 in air for 18 h, after which the maturation rate (number of oocytes containing the first polar body/total oocytes) was calculated. The matured COCs were treated with 0.1% hyaluronidase (H3506; Sigma–Aldrich, St. Louis, MO) to remove cumulus cells. Cumulus-free oocytes were then enucleated by aspirating the first polar body and adjacent cytoplasm with a glass pipette in medium containing M199, 25 mM Hepes and 10% FBS. gADSCs–pDsRed2-1, gMDSCs–pDsRed2-1 and gFFCs–pDsRed2-1 were introduced into the enucleated oocytes under the zona pellucida and placed between 0.5 mm diameter platinum electrodes 1 mm apart in activation medium. Fusion/activation was induced with two direct current pulses (180 V/mm, 20 μs) using an Electro-Cell Manipulator 200 (BTX; San Diego, CA). The fusion rate was calculated.
Reconstructed Embryo Activation and in vitro Culture
Reconstructed embryos was activated by 5 μM A23187 (C7522, Sigma–Aldrich, St. Louis, MO) for 5 min and then further activated with 2 mM 6-DMAP (D2629, Sigma–Aldrich) at 38.5°C under 5% CO2 in air for 3.5 h. The activated embryos were washed with development solution (TCM-199 supplemented with 5% FBS and 5 μg/mL gentamycin [G1264; Sigma–Aldrich, St. Louis, MO]). Cleavage and eight cell rates were determined at 48 h and the blastocyst rate was calculated at day 7–9. For detection of DsRed2 expression, embryos were examined using a fluorescence microscope. Red fluorescent protein expression was observed and compared between the three types of original cell.
Real-time PCR
Expression of the DsRed2 gene in gADSCs–pDsRed2-1, gMDSCs–pDsRed2-1 and gFFCs–pDsRed2-1 embryos was investigated at the morula stage. Total mRNA was isolated from embryos and real-time PCR was performed on a MX4000 system (Stratagene, La Jolla, CA) using Brilliant SYBR Green QPCR Master Mix (Stratagene) and the primers listed in Table 1. The GAPDH gene was used as a housekeeping reference gene to normalize expression between the samples. Data from triplicate experiments were expressed relative to GAPDH, which was used to normalize for any differences in reverse transcriptase efficiency. Fold change in gene expression relative to the control was determined by the standard 2–ΔΔCt method.
Table 1. Real-time PCR primers.
| Gene | Primer sequences |
| GAPDH | 5′-TTGTGATGGGCGTGAACC-3′ |
| 5′-CCCTCCACGATGCCAAA-3′ | |
| DsRed2 | 5′-CCACTACCTGGTGGAGTTCAAG-3′ |
| 5′-CTCGTTGTGGGAGGTGATGT-3′ |
Western Blot Analysis
Aliquots of morula stage embryo lysates containing 45 μg of protein were separated by 12% sodium dodecyl sulfate polyacrylamide gel electrophoresis and transferred to nitrocellulose filters. The filters were blocked with TBST buffer (10 mM Tris-HCl [07066; Sigma–Aldrich, St. Louis, MO], pH 8.0, 0.15 M NaCl, 0.05% Tween 20 [P9416; Sigma–Aldrich, St. Louis, MO]) containing 5% skimmed milk (232100; BD Biosciences, San Jose, CA) and incubated with polyclonal antibodies specific for α-tubulin (ab125267; Abcam, Cambridge, UK) and DsRed2 (ab62341; Abcam, Cambridge, UK) overnight at 4°C. This was followed by the addition of horseradish peroxidase-conjugated anti-mouse IgG (ab6728; Abcam, Cambridge, UK) and enhanced chemiluminescence visualization of the bands. Bands were scanned using a GS-800 Calibrated Densitometer (Bio-Rad, Hercules, CA) and the intensities from each blot were quantified using ImageJ software (National Institutes of Health, Bethesda, MD).
Epigenetic Modification of Embryos Derived from gADSCs–pDsRed2-1, gMDSCs–pDsRed2-1 and gFFCs–pDsRed2-1
gADSCs–pDsRed2-1, gMDSCs–pDsRed2-1 and gFFCs–pDsRed2-1 transgenic embryos at the two and four cell stage were studied using 5-methylcytosine (ab124936; Abcam Cambridge, UK), H4K5 (ab51997; Abcam, Cambridge, UK), H4K12 (ab104127; Abcam Cambridge, UK) and H3K18 (ab1191; Abcam Cambridge, UK) with an immunohistochemical method.
Embryo Transplantation
Preparation of female Arbas cashmere goat recipients
The female Arbas cashmere goat recipients used in this study all met the following conditions. (1) They were adults and capable of recovering quickly after surgery. (2) They had already given birth, to ensure that the transgenic lambs were nurtured. (3) They were in natural estrus. (4) They were free from diseases of the reproductive system and underwent pest prevention treatment before transplantation.
Transgenic embryo transplantation and detection
Thirty-five recipients received transplanted transgenic embryos derived from gADSCs–pDsRed2-1, gMDSCs–pDsRed2-1 and gFFCs–pDsRed2-1. The goats were fasted for 20 h before surgery and were anesthetized before the procedure. Four to six embryos at the four to eight cell stage were transplanted into each recipients ipsilateral fallopian tubes. After surgery, the recipients were injected with an analeptic. The pregnancy rate was calculated after 150 days. Expression of DsRed2 in the skin of transgenic goats was detected by real-time PCR and western blot analysis as described above.
Statistical Analysis
Every experiment was repeated at least three times. The data were presented as the mean and the standard error of the mean, and analyzed using SPSS Version 19.0 (IBM, Armonk, NY). Data were analyzed by multivariate two-way analysis of variance with post hoc tests to control for multiple comparisons. P<0.05 was considered statistically significant.
Results
Morphologic Characteristics, Identification and Growth of gMDSCs
Cell suspensions from skeletal muscle tissues were found to contain a large number of small, rounded satellite cells (96%) and few large, mature, rod-shaped myotube cells (4%) on flow cytometry. The vast majority of cells first transformed into polygonally shaped cells and then into spindle-shaped mononuclear cells within 48 h, with abundant cytoplasm and a high cellular refractive index (Figure 1).
Figure 1. Morphologic changes, identification and growth of gMDSCs.

Cell suspensions from skeletal muscle tissues were found to contain large numbers of small and rounded satellite cells. The vast majority of cells first transformed into spindle-shaped mononuclear cells after the second passage. Positive desmin, α-sarcomeric actinin, MyoD1, Myf5, and PAX7 immunostaining was visualized as green, whereas DAPI-positive nuclei were stained blue. gMDSCs and gMDSCs–pDsRed2-1 entered an exponential growth phase between days 2 and 3, and reached a growth plateau between days 6 and 7. gADSCs and gADSCs–pDsRed2-1 gave results similar to those for gMDSCs and gMDSCs–pDsRed2-1. gMDSCs, goat muscle-derived satellite cells; gADSCs, goat adipose-derived mesenchymal stem cells.
Positive Desmin, Sarcomeric Alpha Actinin, MyoD1, Myf5 and PAX7 immunostaining was visualized as green, whereas DAPI-positive nuclei were stained blue (Figure 1). Morphologic characteristic analysis combined with surface marker molecules confirmed that the cultured cells were gMDSCs and were suitable for further research.
gMDSCs entered an exponential growth phase between days 2 and 3, and reached a growth plateau between days 6 and 7. gMDSCs–pDsRed2-1 entered an exponential growth phase at 2 d and reached a growth plateau at 6 d. Compared with gMDSCs–pDsRed2-1, the growth rate of MDSCs was significantly higher, starting at 4 d (P<0.05) (Figure 1). The findings for gADSCs and gADSCs–pDsRed2-1 were similar to those for gMDSCs and gMDSCs–pDsRed2-1.
Apoptosis of gADSCs, gADSCs–pDsRed2-1, gMDSCs and gMDSCs–pDsRed2-1
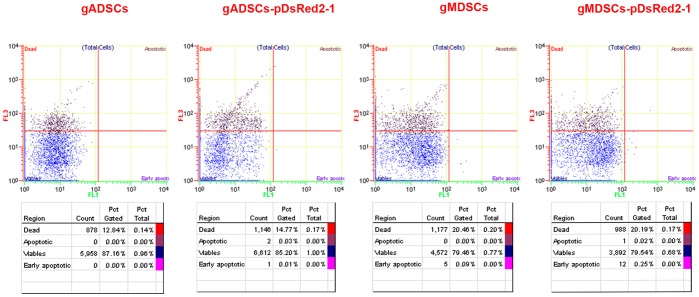
The percentages of apoptotic and early apoptotic cells were 0.00% and 0.00%, and 0.00% and 0.09%, respectively, in 50th generation gADSCs and gMDSCs as demonstrated by FITC-Annexin V/PI assay. The percentages of apoptotic and early apoptotic cells were 0.03% and 0.01%, and 0.02% and 0.25%, respectively, in 10th generation gADSCs–pDsRed2-1 and gMDSCs–pDsRed2-1. The percentage of dead cells was 15–20% for each of the four types of cell (Figure 2).
Figure 2. Apoptosis of gADSCs, gADSCs–pDsRed2-1, gMDSCs and gMDSCs–pDsRed2-1.
The percentages of apoptotic and early apoptotic cells were 0.00% and 0.00%, and 0.00% and 0.09%, respectively, in 50th generation gADSCs and gMDSCs. The percentages of apoptotic and early apoptotic cells were 0.03% and 0.01%, and 0.02% and 0.25%, respectively, in 10th generation gADSCs–pDsRed2-1 and gMDSCs–pDsRed2-1. gADSCs, goat adipose-derived mesenchymal stem cells; gMDSCs, goat muscle-derived satellite cells.
Induced Neuronal Differentiation and NSE Expression of gADSCs, gADSCs–pDsRed2-1, gMDSCs and gMDSCs–pDsRed2-1
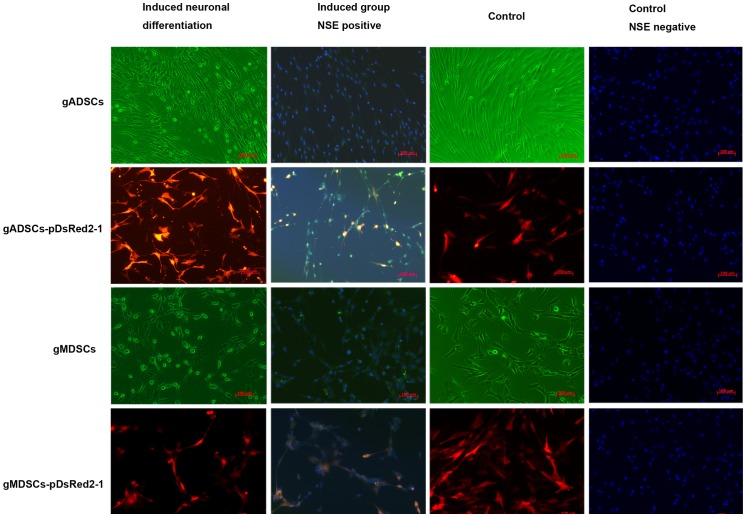
gADSCs and gMDSCs were altered morphologically by incubation in induction medium containing β-mercaptoethanol. After 30 min the cytoplasm began to shrink; after 2 h, the cell bodies became conical, triangular or round in shape with multiple protrusions resembling axons, the ends of which were primary and secondary bifurcated dendrites. Immunohistochemistry showed that the cells were NSE positive after 3 h. Uninduced gADSCs and control gMDSCs were morphologically unaltered and did not express NSE after 4 h. gADSCs–pDsRed2-1 and gMDSCs–pDsRed2-1 exhibited a similar induction pattern, suggesting that the integrated exogenous genes did not influence the induction of neuronal differentiation of gADSCs–pDsRed2-1 or gMDSCs–pDsRed2-1 (Figure 3).
Figure 3. Neuronal differentiation of gADSCs, gADSCs–pDsRed2-1, gMDSCs and gMDSCs–pDsRed2-1.
gADSCs, gADSCs–pDsRed2-1, gMDSCs and gMDSCs–pDsRed2-1 were altered morphologically by incubation in induction medium containing β-mercaptoethanol. The cytoplasm began to shrink, and after 2 h the cell bodies became conical, triangular or round in shape with multiple protrusions resembling axons, the ends of which were primary and secondary bifurcated dendrites. Immunohistochemistry showed that the cells were NSE (green) positive after 3 h. Uninduced control cells were morphologically unaltered and did not express NSE. gADSCs, goat adipose-derived mesenchymal stem cells; gMDSCs, goat muscle-derived satellite cells; NSE, neuron-specific enolase.
Myogenic Induction of gADSCs, gADSCs–pDsRed2-1, gMDSCs and gMDSCs–pDsRed2-1
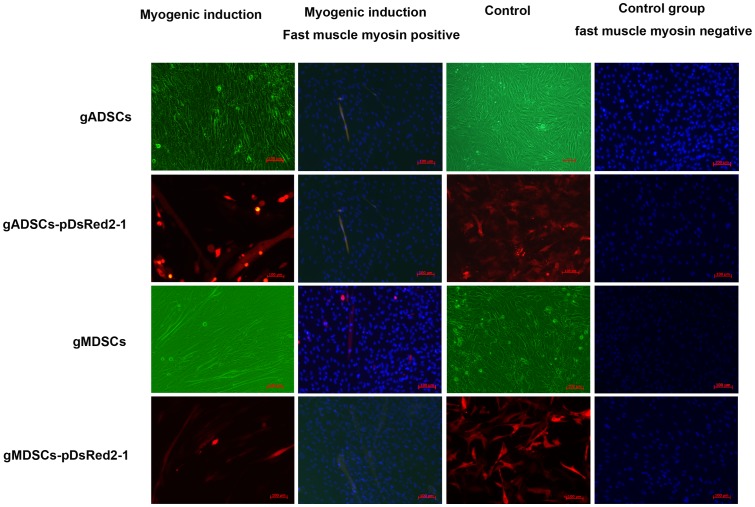
Forty-eight hours after the addition of myogenic induction medium, gMDSCs and gMDSCs–pDsRed2-1 had begun to fuse, and gradually became arranged in parallel with each other oriented in a single direction to form short, thick, multicore myotube cells. As time passed, the cell density increased, the integration between the cells became more extensive, and the number and length of the myotube cells increased markedly. gADSCs and gADSCs–pDsRed2-1 began to integrate 5 d after myogenic induction, leading to obvious myotube cell formation (Figure 4). DAPI staining revealed the presence of multiple nuclei in the same myotube, and immunohistochemical staining demonstrated that the cells were fast muscle myosin positive; control (uninduced) cells were fast muscle myosin negative (Figure 4). These results indicate that gADSCs, gADSCs–pDsRed2-1, gMDSCs and gMDSCs–pDsRed2-1 can be induced to differentiate into myogenic cells.
Figure 4. Myogenic induction of gADSCs, gADSCs–pDsRed2-1, gMDSCs and gMDSCs–pDsRed2-1.
gMDSCs and gMDSCs–pDsRed2-1 began to fuse after 2 d and myotube cells increased markedly. gADSCs and gADSCs–pDsRed2-1 began to integrate 5 d after myogenic induction, leading to short myotube cell formation. DAPI staining revealed the presence of multiple nuclei in the same myotube, and immunohistochemical staining demonstrated that the cells were fast muscle myosin (green) positive; control (uninduced) cell were fast muscle myosin negative. gADSCs, goat adipose-derived mesenchymal stem cells; gMDSCs, goat muscle-derived satellite cells.
Differentiation and Confirmation of Insulin-producing Cells
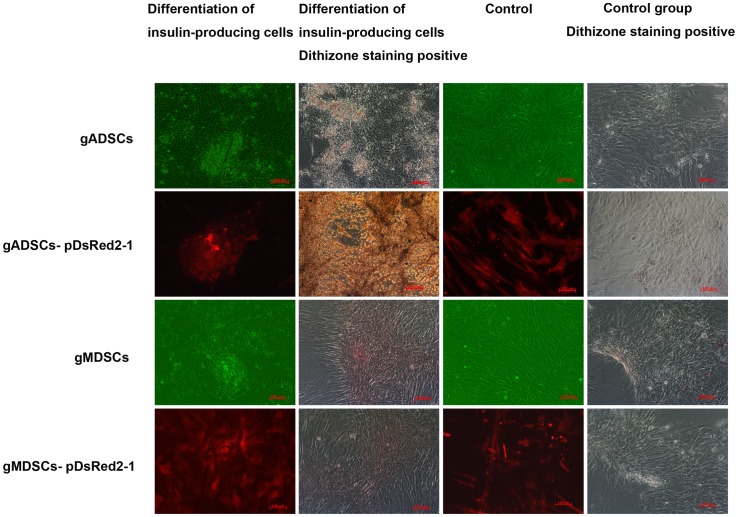
Three days after induction of gADSCs, gADSCs–pDsRed2-1, gMDSCs and gMDSCs–pDsRed2-1 in DMEM/Low Glucose, the nucleus: cytoplasm ratio was altered and the nuclei became significantly larger (Figure 5). At day 5, the induced cells exhibited intensive cell growth. In the control group, there were irregular cell clusters and the cells were divergent and fusiform. Cell masses were scarlet in the induced group after dithizone staining, but remained unstained in the control group. Insulin was detected in fusiform cells in the induced group, but the control group lacked insulin (Figure 5).
Figure 5. Differentiation and confirmation of insulin-producing cells.
gADSCs, gADSCs–pDsRed2-1, gMDSCs and gMDSCs–pDsRed2-1 exhibited intensive cell growth. There were irregular cell clusters in the control group, and the cells were divergent and fusiform. Cell masses were scarlet in the induced group after dithizone staining but remained unstained in the control group. Insulin was detected in fusiform cells in the induced group, but the control group lacked insulin. gADSCs, goat adipose-derived mesenchymal stem cells; gMDSCs, goat muscle-derived satellite cells.
G418 Sensitivity of gADSCs, gMDSCs and gFFCs
The sensitivity of gADSCs, gMDSCs and gFFCs to G418 increased gradually with concentration in the range 100 μg/mL to 1000 μg/mL. For gADSCs, 400 μg/mL G418, the concentration at which no viable cells were detected by day 7, was selected as the optimal screening concentration for transgenic cell clones; 200 μg/mL, the concentration at which no viable cells were detected by day 10, was selected as the maintenance concentration. For gMDSCs, 300 μg/mL was selected as the optimal screening concentration; 150 μg/mL was the maintenance concentration. Based on identical criteria, the optimal screening and maintenance G418 concentrations for gFFCs were identified as 700 μg/mL and 350 μg/mL, respectively (Figure 6).
Figure 6. G418 sensitivity of gADSCs, gMDSCs and gFFCs.
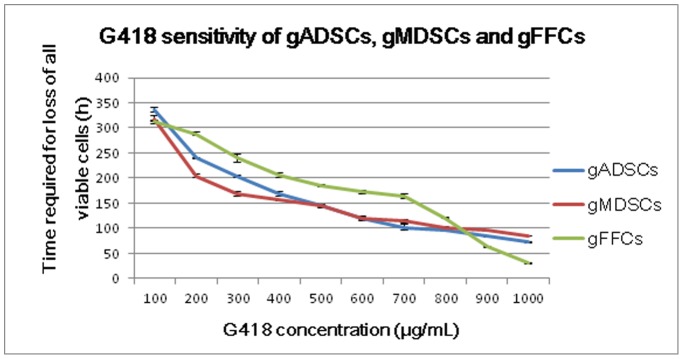
For gADSCs, 400 μg/mL G418 was detected by day 7 and was selected as the optimal screening concentration for transgenic cell clones. For gMDSCs, 300 μg/mL G418 was selected as the optimal screening concentration. For gFFCs 700 μg/mL G418 was selected. gADSCs, goat adipose-derived mesenchymal stem cells; gMDSCs, goat muscle-derived satellite cells; gFFCs, goat fetal fibroblast cells.
In vitro G418 Screening of gADSCs–pDsRed2-1, gMDSCs–pDsRed2-1 and gFFCs–pDsRed2-1 in Monoclonal Culture
No significant differences were detected among the transient transfection efficiencies of gADSCs, gMDSCs and gFFCs (12%, 13.7% and 12.8%, respectively) (P>0.05) 48 h after transfection. The rates of neomycin resistant monoclonal colony formation and red fluorescence in gADSCs–pDsRed2-1, gMDSCs–pDsRed2-1 and gFFCs–pDsRed2-1 were 78.26%, 85.67% and 50.00%, respectively, after G418 screening (P<0.01) (Table 2).
Table 2. Comparison of fluorescent clone formation after pDsRed2-1 plasmid transfection of different cell lines.
| Cell lines | 1 | 2 | 3 | Total | Standard deviations |
| gADSCsa-pDsRed2-1 | 18/23 | 20/25 | 16/21 | 54/69 | 2% |
| gMDSCsb-pDsRed2-1 | 162/181 | 192/231 | 190/223 | 544/635 | 3% |
| gFFCsc-pDsRed2-1 | 15/28 | 17/38 | 17/32 | 49/98 | 5% |
Data are the means of the number of fluorescent cell populations observed in three Petri dishes. Formation rate = number of fluorescent cell populations in one Petri dish/total number of clones.
Goat adipose-derived mesenchymal stem cells.
Goat muscle-derived satellite cells.
Goat fetal fibroblast cells.
Nuclear Transfer and Transgenic Embryonic Development of gADSCs–pDsRed2-1, gMDSCs–pDsRed2-1 and gFFCs–pDsRed2-1
One thousand, seven hundred and fifty-five COCs were cultured in vitro following nuclear transfer; among these, 1322 oocytes matured in vitro (75.33% contained the first polar body). For gADSCs–pDsRed2-1, of 551 oocyte–donor cell complexes (91.7%) surviving after micromanipulation, 467 (84.75%) were electrofused successfully. Of these, 410 transgenic embryos (87.79%) had cleaved after 48 h, 132 transgenic embryos (28.27%) reached the eight cell phase and 49 (10.49%) developed into transgenic blastocysts after 7–9 d (Table 3). For gMDSCs–pDsRed2-1, of 466 oocyte–donor cell complexes (91.7%) surviving after micromanipulation, 427 (92.83%) were electrofused successfully. Of these, 365 transgenic embryos (85.48%) had cleaved after 48 h, 114 transgenic embryos (26.70%) reached the eight cell phase and 18 (11.18%) developed into transgenic blastocysts after 7–9 d (Table 3). For gFFCs–pDsRed2-1, 208 oocyte–donor cell complexes survived after micromanipulation and 151 (72.60%) were successfully electrofused. Of these, 116 transgenic embryos (76.82%) had cleaved after 48 h, 38 transgenic embryos (25.17%) reached the eight cell phase and 15 (9.93%) developed into blastocysts after 7–9 d (Table 3).
Table 3. Maturation and development of cloned embryos derived from gADSCsa–pDsRed2-1, gMDSCsb–pDsRed2-1 and gFFCsc–pDsRed2-1 in vitro.
| Group | Number of cumulus–oocyte complexes | Number of mature embryos | Number of surviving embryos | Number of embryos exhibiting convergence | Number of embryos exhibiting cleavage | Number of eight-cell embryos | Number of blastocysts | |
| gADSCs–pDsRed2-1 | (Maturity rate) | (Survival rate) | (Convergence rate) | (Cleavage rate) | (Eight-cell rate) | (Blastocyst rate) | ||
| A | 237 | 185 | 167 | 145 | 131 | 43 | 15 | |
| (78.06%) | (90.27%) | (86.82%) | (90.34%) | (29.66%) | (10.34%) | |||
| B | 281 | 205 | 188 | 152 | 130 | 41 | 15 | |
| (72.95%) | (91.70%) | (80.85%) | (85.52%) | (26.97%) | (9.86%) | |||
| C | 263 | 210 | 196 | 170 | 149 | 48 | 19 | |
| (79.85%) | (93.33%) | (86.73%) | (87.65%) | (28.24%) | (11.18%) | |||
| Total | 781 | 600 | 551 | 467 | 410 | 132 | 49 | |
| (76.82%) | (91.83) | (84.75) | (87.79%) | (28.27%) | (10.49%) | |||
| Sdd | 3.58 | 1.53 | 3.42 | 2.42 | 1.35 | 0.67 | ||
| gMDSCs–pDsRed2-1 | A | 231 | 172 | 162 | 155 | 133 | 38 | 18 |
| (74.46%) | (94.18%) | (90.12%) | (85.81%) | (24.51%) | (11.61%) | |||
| B | 281 | 203 | 188 | 171 | 149 | 49 | 16 | |
| (72.24%) | (92.61%) | (90.96%) | (87.13%) | (28.66%) | (9.37%) | |||
| C | 161 | 122 | 110 | 101 | 83 | 27 | 9 | |
| (75.78%) | (90.16%) | (91.82%) | (82.18%) | (26.73%) | (8.91%) | |||
| Total | 673 | 497 | 460 | 427 | 365 | 114 | 43 | |
| (73.85%) | (92.56%) | (92.83%) | (85.48%) | (26.70%) | (10.07%) | |||
| Sdd | 1.79 | 2.03 | 0.85 | 2.56 | 2.08 | 1.44 | ||
| gFFCs–pDsRed2-1 | A | 94 | 68 | 61 | 45 | 41 | 13 | 6 |
| (72.34%) | (89.71%) | (73.77%) | (91.11%) | (28.88%) | (13.33%) | |||
| B | 87 | 71 | 68 | 60 | 54 | 19 | 7 | |
| (81.61%) | (95.77%) | (88.24%) | (90.00%) | (31.67%) | (11.67%) | |||
| C | 120 | 88 | 79 | 56 | 49 | 17 | 5 | |
| (73.33%) | (89.77%) | (70.89%) | (87.50%) | (30.36%) | (8.93%) | |||
| Total | 301 | 227 | 208 | 161 | 144 | 49 | 18 | |
| (75.42%) | (91.63%) | (77.40%) | (89.44%) | (30.43%) | (11.18%) | |||
| Sdd | 5.09 | 3.48 | 9.30 | 1.85 | 1.40 | 2.22 |
Goat adipose-derived mesenchymal stem cells.
Goat muscle-derived satellite cells.
Goat fetal fibroblast cells.
Standard deviation.
The transgenic cloned embryos derived from gADSCs–pDsRed2-1 or gMDSCs–pDsRed2-1 exhibited approximately 20% and 10% higher convergence and cleavage rates than gFFCs–pDsRed2-1 respectively. No significant differences in the eight cell and blastocyst rates were detected.
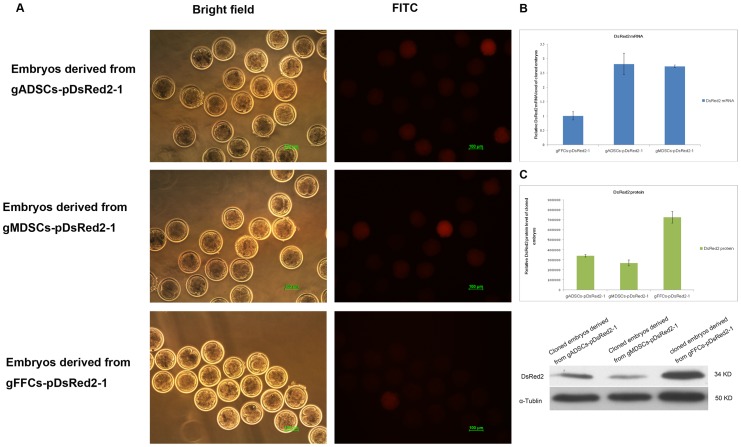
gADSCs–pDsRed2-1, gMDSCs–pDsRed2-1 and gFFCs–pDsRed2-1 embryos in different phases were selected randomly for fluorescence examination. All transgenic embryos expressed red fluorescent protein but the levels varied between embryos at the same phase, with higher levels detected in embryos derived from gMDSCs–pDsRed2-1 (Figure 7A) compared with those derived from gADSCs–pDsRed2-1 or gFFCs–pDsRed2-1 (48.88% vs 35.26% and 31.15%, respectively) (P<0.01) (Figure 7A).
Figure 7. DsRed2 expression in cloned transgenic embryos derived from gADSCs–pDsRed2-1, gMDSCs–pDsRed2-1 and gFFCs–pDsRed2-1.
A Transgenic embryos derived from gADSCs–pDsRed2-1, gMDSCs–pDsRed2-1 and gFFCs–pDsRed2-1. B DsRed2 mRNA expression of cloned embryos derived from gADSCs or gMDSCs was about 2.71 times greater than that of embryos derived from gFFCs–pDsRed2-1 (P<0.01), but the DsRed2-1 mRNA expression of cloned embryos derived from gADSCs was similar to that of embryos derived from gMDSCs (P>0.05). C DsRed2 protein expression of cloned embryos derived from gFFCs–pDsRed2-1 was 2.13 times greater than that of embryos derived from gADSCs–pDsRed2-1 and 2.71 greater than that of embryos derived from gMDSCs–pDsRed2-1 (P<0.01). gADSCs, goat adipose-derived mesenchymal stem cells; gMDSCs, goat muscle-derived satellite cells; gFFCs, goat fetal fibroblast cells.
Real-time quantitative PCR analysis showed that the DsRed2 mRNA expression of cloned embryos derived from gADSCs or gMDSCs was about 2.71 times greater than that of embryos derived from gFFCs–pDsRed2-1 (P<0.01), but DsRed2-1 mRNA expression of cloned embryos derived from gADSCs was similar to that of embryos derived from gMDSCs (P>0.05) (Figure 7B).
By contrast, western blot analysis showed that the DsRed2 protein expression of cloned embryos derived from gFFCs–pDsRed2-1 was 2.13 times greater than that of embryos derived from gADSCs–pDsRed2-1 and 2.71 greater than that of embryos derived from gMDSCs–pDsRed2-1 (P<0.01) (Figure 7C). DsRed2 protein was detected as a single band in embryos derived from both types of cell.
Expression of 5-methylcytosine, H4K5, H4K12 and H3K18 in Transgenic Embryos
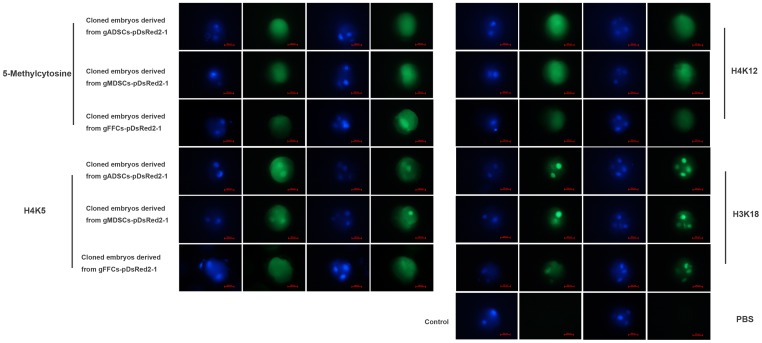
At different time points, the pattern of 5-methylcytosine, H4K5, H4K12 and H3K18 expression in SCNT embryos was examined by immunostaining (Figure 8). Levels of methylation assessed by 5-methylcytosine staining remained unchanged in cloned embryos derived from gADSCs–pDsRed2-1, gMDSCs–pDsRed2-1 or gFFCs–pDsRed2-1. H4K5 was more highly expressed in the nucleus in embryos derived from gADSCs–pDsRed2-1 or gMDSCs–pDsRed2-1 than in those derived from gFFCs–pDsRed2-1. H4K12 expression in the nucleus and cytoplasm in did not differ between the three types of embryo. H3K18 was highly expressed in the nucleus during both the two and the four cell stage.
Figure 8. 5-Methylcytosine, H4K5, H4K12 and H3K18 expression in embryos obtained by somatic cell nuclear transfer.
Methylation levels assessed by 5-methylcytosine staining remained unchanged in cloned embryos derived from gADSCs–pDsRed2-1, gMDSCs–pDsRed2-1 and gFFCs–pDsRed2-1. H4K5 expression in the nucleus was higher in cloned embryos derived from gADSCs–pDsRed2-1 or gMDSCs–pDsRed2-1 than in those derived from gFFCs–pDsRed2-1. H4K12 expression in the nucleus and cytoplasm did not differ among the three types of embryo. H3K18 was highly expressed in the nucleus during both the two and the four cell stage. gADSCs, goat adipose-derived mesenchymal stem cells; gMDSCs, goat muscle-derived satellite cells; gFFCs, goat fetal fibroblast cells.
Transgenic Embryo Transplantation and Detection of Transgenic Goats
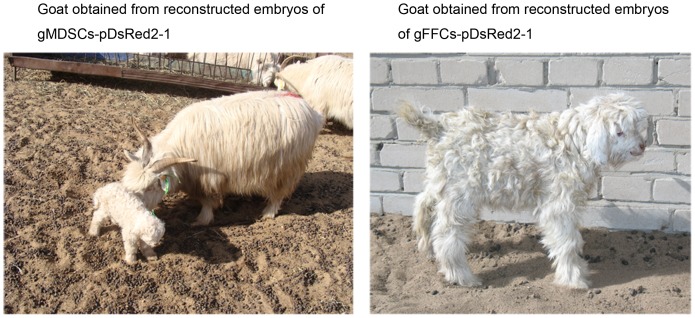
In the gADSCs–pDsRed2-1, gMDSCs–pDsRed2-1 and gFFCs–pDsRed2-1 groups, two, three and one recipient, respectively, became pregnant. Zero, two and one cloned goat, respectively, were obtained (Figure 9).
Figure 9. Transgenic goats obtained from reconstructed embryos derived from gMDSCs–pDsRed2-1 (left) and gFFCs–pDsRed2-1 (right).
gMDSCs, goat muscle-derived satellite cells; gFFCs, goat fetal fibroblast cells.
Discussion
At present, fibroblasts are predominantly used as the nuclear donor cells in cashmere goat transgenic cloning [6], [18], [19], but these cells have the significant disadvantages of limited number of passages and low survival rate after transfection, and have become a bottleneck in the breeding of new transgenic varieties.
Comprehensive analysis of well-defined cell lines is beneficial for the selection of appropriate cell types for use in advanced transgenic strategies to improve the production efficiency of large animal models using primary cells [18], [20], [21], [22]. The gADSCs and gMDSCs generated in this study proliferated rapidly in vitro and exhibited common properties of stem cells (i.e. self-renewal and multipotential differentiation) [3], [23], [24], [25], [26]. Furthermore, no marked signs of aging or abnormal apoptosis were detected in gADSCs or gMDSCs after the 65th passage in vitro, whereas abnormal karyotypes and marked signs of aging were apparent in gFFCs after the 15th passage in vitro. Cell growth curves showed that gADSCs, gADSCs–pDsRed2-1, gMDSCs and gMDSCs–pDsRed2-1 all experienced a latent period, a logarithmic growth phase and a plateau during growth in in vitro culture, indicating that the integrated exogenous genes did not influence proliferation efficiency. After numerous passages, reduced cell morphologic diversity might contribute to fibroblast-like cell proliferation and different cell cycles under culture conditions.
The efficiency of SCNT for the production of cloned animals in large batches is critically dependent on the source of the donor nucleus. In the present study, exogenous genes were transfected into gADSCs and gMDSCs using the liposome method. The transient transfection efficiencies of these two cell types were similar at 48 h after transfection, whereas the clone formation efficiency of gADSCs–pDsRed2-1 and gMDSCs–pDsRed2-1 was approximately 30% higher (P<0.01) than that of gFFCs–pDsRed2-1 on G418 screening after 10 d; thus, the accuracy of transgenic cell screening was greatly improved [27]. Furthermore, we observed low cytotoxicity and only marginal alterations of gADSC and gMDSC morphology after transfection, with no effects on cell properties such as response to chemicals and pattern of gene expression. The sensitivity of mammalian cells to G418 concentration is related to the species and to cell type and growth state. Compared with gFFCs, gMDSCs are more sensitive to G418, thereby reducing the quantity of G418 required for selection. Furthermore, the exogenous genes did not affect the growth rate or pluripotency of the transfected cells.
Low cloning efficiency has hampered the production of cloned animals. Several reports have indicated that the type of donor cell can affect the birth rate. In mice, an appropriate interaction between cell type and genotype can improve cloning efficiency [28]. Coordination of donor cell type and cell cycle stage can maximize the overall cloning efficiency [29]. In buffalos, cumulus cells are a more efficient nuclear donor for SCNT than fibroblasts [30]. In rabbits, embryos reconstructed with fresh cumulus cells have a more efficient developmental potential than those reconstructed with fetal fibroblasts both in vivo and in vitro [31]. However, comparisons show that adult cells of any type are inferior to fetal fibroblasts in terms of reconstructed embryo development.
Our results reconfirmed the fact that the type of donor somatic cell is critical for determining developmental competence. Moreover, these results further confirm that gADSCs and gMDSCs are more efficient as donor cells in SCNT for the cloning of Arbas cashmere goats. The convergence and cleavage rates of transgenic embryos derived from gADSCs or gMDSCs were higher than those of transgenic embryos derived from gFFCs after in vitro culture, whereas the eight cell and blastocyst rates were similar. Studies conducted in transgenic pigs by Faast et al. [32] in 2006 demonstrated that the use of pig bone marrow stem cells as SCNT donor cells did not improve the cleavage rate of cloned embryos compared with fibroblasts derived from the same pig, whereas the blastocyst rate was twofold greater than that of cloned embryos derived from fibroblasts. These data are not in accordance with those of our study and it can be speculated that this difference may be attributed to species differences and different epigenetic patterns affecting production.
Elevating histone acetylation levels improves the rate of development to blastocyst and to term and even the efficiency of ESC derivation from SCNT blastocysts [33], [34]. Because Lys-5 is the last lysine to be acetylated, acetylated H4K5 reflects hyperacetylated histone H4, and this is correlated with a transcriptionally permissive state of chromatin [35] that may be a necessary step for embryonic genome activation occurring at the two cell stage. High levels of H4K5 histone acetylation in embryos derived from gADSCs or gMDSCs may be another factor in their high cloning efficiency. Rogers et al. [36] verified that homologous recombination depends on donor cells. This underlines the importance of the characterization of donor cell cultures provided for genetic modification and SCNT.
This study is the first to report successful cloning using gADSCs and gMDSCs from Arbas cashmere goats. These goats can be used as a large animal model in transgenic research.
Conclusions
gADSCs and gMDSCs were found to exhibit better proliferation rates, growth capacity, transfection efficiency and convergence and cleavage after SCNT compared with gFFCs. gADSCs and gMDSCs are highly suitable for additive gene transfer and the subsequent production of genetically modified goats by SCNT.
Acknowledgments
Special thanks go to Kuan Lu and Shaoqing Liu (YiWei White Cashmere Goat Farm, Inner Mongolia Autonomous Region of China) for their help with the sample preparation and collection.
Funding Statement
The National Genetically Modified Organisms Breeding Major Projects (Grant No. 2013ZX08008-002). The funders had no role in study design, data collection and analysis, decision to publish, or preparation of the manuscript.
References
- 1. Aigner B, Klymiuk N, Wolf E (2010) Transgenic pigs for xenotransplantation: selection of promoter sequences for reliable transgene expression. Curr Opin Organ Transplant 15: 201–206. [DOI] [PubMed] [Google Scholar]
- 2. Powell AM, Talbot NC, Wells KD, Kerr DE, Pursel VG, et al. (2004) Cell donor influences success of producing cattle by somatic cell nuclear transfer. Biol Reprod 71: 210–216. [DOI] [PubMed] [Google Scholar]
- 3. Aigner B, Renner S, Kessler B, Klymiuk N, Kurome M, et al. (2010) Transgenic pigs as models for translational biomedical research. J Mol Med (Berl) 88: 653–664. [DOI] [PubMed] [Google Scholar]
- 4. Klymiuk N, van Buerck L, Bahr A, Offers M, Kessler B, et al. (2012) Xenografted islet cell clusters from INSLEA29Y transgenic pigs rescue diabetes and prevent immune rejection in humanized mice. Diabetes 61: 1527–1532. [DOI] [PMC free article] [PubMed] [Google Scholar]
- 5. Klymiuk N, Bocker W, Schonitzer V, Bahr A, Radic T, et al. (2012) First inducible transgene expression in porcine large animal models. FASEB J 26: 1086–1099. [DOI] [PubMed] [Google Scholar]
- 6. Campbell KH, Alberio R, Choi I, Fisher P, Kelly RD, et al. (2005) Cloning: eight years after Dolly. Reprod Domest Anim 40: 256–268. [DOI] [PubMed] [Google Scholar]
- 7. Kumar BM, Jin HF, Kim JG, Ock SA, Hong Y, et al. (2007) Differential gene expression patterns in porcine nuclear transfer embryos reconstructed with fetal fibroblasts and mesenchymal stem cells. Dev Dyn 236: 435–446. [DOI] [PubMed] [Google Scholar]
- 8. Jin HF, Kumar BM, Kim JG, Song HJ, Jeong YJ, et al. (2007) Enhanced development of porcine embryos cloned from bone marrow mesenchymal stem cells. Int J Dev Biol 51: 85–90. [DOI] [PubMed] [Google Scholar]
- 9. Gibson MC, Schultz E (1983) Age-related differences in absolute numbers of skeletal muscle satellite cells. Muscle Nerve 6: 574–580. [DOI] [PubMed] [Google Scholar]
- 10. Guilak F, Lott KE, Awad HA, Cao Q, Hicok KC, et al. (2006) Clonal analysis of the differentiation potential of human adipose-derived adult stem cells. J Cell Physiol 206: 229–237. [DOI] [PubMed] [Google Scholar]
- 11. Hermann A, Liebau S, Gastl R, Fickert S, Habisch HJ, et al. (2006) Comparative analysis of neuroectodermal differentiation capacity of human bone marrow stromal cells using various conversion protocols. J Neurosci Res 83: 1502–1514. [DOI] [PubMed] [Google Scholar]
- 12. Huard J, Cao B, Qu-Petersen Z (2003) Muscle-derived stem cells: potential for muscle regeneration. Birth Defects Res C Embryo Today 69: 230–237. [DOI] [PubMed] [Google Scholar]
- 13. Salem SA, Hwie AN, Saim A, Chee Kong CH, Sagap I, et al. (2013) Human adipose tissue derived stem cells as a source of smooth muscle cells in the regeneration of muscular layer of urinary bladder wall. Malays J Med Sci 20: 80–87. [PMC free article] [PubMed] [Google Scholar]
- 14. Ren Y, Wu H, Zhou X, Wen J, Jin M, et al. (2012) Isolation, expansion, and differentiation of goat adipose-derived stem cells. Res Vet Sci 93: 404–411. [DOI] [PubMed] [Google Scholar]
- 15. Wu H, Ren Y, Li S, Wang W, Yuan J, et al. (2012) In vitro culture and induced differentiation of sheep skeletal muscle satellite cells. Cell Biol Int 36: 579–587. [DOI] [PubMed] [Google Scholar]
- 16. Chang YF, Liu TY, Liu ST, Tseng CN (2012) Arecoline inhibits myogenic differentiation of C2C12 myoblasts by reducing STAT3 phosphorylation. Food Chem Toxicol 50: 3433–3439. [DOI] [PubMed] [Google Scholar]
- 17. Guo X, Yang D, Ao X, Wu X, Li G, et al. (2009) Production of transgenic cashmere goat embryos expressing red fluorescent protein and containing IGF1 hair-follicle-cell specific expression cassette by somatic cell nuclear transfer. Sci China C Life Sci 52: 390–397. [DOI] [PubMed] [Google Scholar]
- 18. Polejaeva IA, Chen SH, Vaught TD, Page RL, Mullins J, et al. (2000) Cloned pigs produced by nuclear transfer from adult somatic cells. Nature 407: 86–90. [DOI] [PubMed] [Google Scholar]
- 19. Wolf E, Schernthaner W, Zakhartchenko V, Prelle K, Stojkovic M, et al. (2000) Transgenic technology in farm animals–progress and perspectives. Exp Physiol 85: 615–625. [PubMed] [Google Scholar]
- 20. Petersen B, Lucas-Hahn A, Oropeza M, Hornen N, Lemme E, et al. (2008) Development and validation of a highly efficient protocol of porcine somatic cloning using preovulatory embryo transfer in peripubertal gilts. Cloning Stem Cells 10: 355–362. [DOI] [PubMed] [Google Scholar]
- 21. Onishi A, Iwamoto M, Akita T, Mikawa S, Takeda K, et al. (2000) Pig cloning by microinjection of fetal fibroblast nuclei. Science 289: 1188–1190. [DOI] [PubMed] [Google Scholar]
- 22. Li Z, Shi J, Liu D, Zhou R, Zeng H, et al. (2013) Effects of donor fibroblast cell type and transferred cloned embryo number on the efficiency of pig cloning. Cell Reprogram 15: 35–42. [DOI] [PMC free article] [PubMed] [Google Scholar]
- 23. Deng W, Obrocka M, Fischer I, Prockop DJ (2001) In vitro differentiation of human marrow stromal cells into early progenitors of neural cells by conditions that increase intracellular cyclic AMP. Biochem Biophys Res Commun 282: 148–152. [DOI] [PubMed] [Google Scholar]
- 24. Safford KM, Safford SD, Gimble JM, Shetty AK, Rice HE (2004) Characterization of neuronal/glial differentiation of murine adipose-derived adult stromal cells. Exp Neurol 187: 319–328. [DOI] [PubMed] [Google Scholar]
- 25. Lu J, Moochhala S, Moore XL, Ng KC, Tan MH, et al. (2006) Adult bone marrow cells differentiate into neural phenotypes and improve functional recovery in rats following traumatic brain injury. Neurosci Lett 398: 12–17. [DOI] [PubMed] [Google Scholar]
- 26. Black IB, Woodbury D (2001) Adult rat and human bone marrow stromal stem cells differentiate into neurons. Blood Cells Mol Dis 27: 632–636. [DOI] [PubMed] [Google Scholar]
- 27. Lakshmipathy U, Pelacho B, Sudo K, Linehan JL, Coucouvanis E, et al. (2004) Efficient transfection of embryonic and adult stem cells. Stem Cells 22: 531–543. [DOI] [PubMed] [Google Scholar]
- 28. Inoue K, Ogonuki N, Mochida K, Yamamoto Y, Takano K, et al. (2003) Effects of donor cell type and genotype on the efficiency of mouse somatic cell cloning. Biol Reprod 69: 1394–1400. [DOI] [PubMed] [Google Scholar]
- 29. Wells DN, Laible G, Tucker FC, Miller AL, Oliver JE, et al. (2003) Coordination between donor cell type and cell cycle stage improves nuclear cloning efficiency in cattle. Theriogenology 59: 45–59. [DOI] [PubMed] [Google Scholar]
- 30. Pandey A, Gupta SC, Gupta N (2010) Comparative potential of cultured skin fibroblast, cumulus, and granulosa cell to produce somatic cell nuclear transfer (SCNT) preimplantation embryos in buffaloes (Bubalus bubalis) in relation to gene expressions. Cell Reprogram 12: 357–368. [DOI] [PubMed] [Google Scholar]
- 31. Tian J, Song J, Li H, Yang D, Li X, et al. (2012) Effect of donor cell type on nuclear remodelling in rabbit somatic cell nuclear transfer embryos. Reprod Domest Anim 47: 544–552. [DOI] [PubMed] [Google Scholar]
- 32. Faast R, Harrison SJ, Beebe LF, McIlfatrick SM, Ashman RJ, et al. (2006) Use of adult mesenchymal stem cells isolated from bone marrow and blood for somatic cell nuclear transfer in pigs. Cloning Stem Cells 8: 166–173. [DOI] [PubMed] [Google Scholar]
- 33. Dai X, Hao J, Hou XJ, Hai T, Fan Y, et al. (2010) Somatic nucleus reprogramming is significantly improved by m-carboxycinnamic acid bishydroxamide, a histone deacetylase inhibitor. J Biol Chem 285: 31002–31010. [DOI] [PMC free article] [PubMed] [Google Scholar]
- 34. Wang F, Kou Z, Zhang Y, Gao S (2007) Dynamic reprogramming of histone acetylation and methylation in the first cell cycle of cloned mouse embryos. Biol Reprod 77: 1007–1016. [DOI] [PubMed] [Google Scholar]
- 35. Urnov FD, Wolffe AP (2001) Chromatin remodeling and transcriptional activation: the cast (in order of appearance). Oncogene 20: 2991–3006. [DOI] [PubMed] [Google Scholar]
- 36. Rogers CS, Hao Y, Rokhlina T, Samuel M, Stoltz DA, et al. (2008) Production of CFTR-null and CFTR-DeltaF508 heterozygous pigs by adeno-associated virus-mediated gene targeting and somatic cell nuclear transfer. J Clin Invest 118: 1571–1577. [DOI] [PMC free article] [PubMed] [Google Scholar]


