

Abstract
The Contralateral Delayed Activity (CDA) is slow negative potential found during a variety of tasks, providing an important measure of the representation of information in visual working memory. However, it is studied using stimulus arrays in which the to-be-remembered objects are shown in the periphery of the left or the right visual field. Our goal was to determine whether fixational eye movements in the direction of the memoranda might underlie the CDA. We found that subjects’ gaze was shifted toward the visual field of the memoranda during the retention interval, with its magnitude increasing with the set size. However, the CDA was clearly observed even when the subjects’ gaze shifts were absent. In addition, the magnitude of the subjects’ gaze shifts was unrelated to their visual working memory capacity measured with behavioral data, unlike the CDA. Finally, the onset latency of the set size dependent eye movements followed the onset of the set size dependent CDA. Thus, our findings clearly show that the CDA does not represent a simple inability to maintain fixation during visual working memory maintenance, but that this neural index of representation in working memory appears to induce eye movements toward the locations of the objects being remembered.
Keywords: visual working memory, eye movements, ERP, CDA
Introduction
The CDA is a slow wave of subjects’ event-related potentials (ERPs) that is found contralateral to the location in space that to-be-remembered objects are presented. This contralateral negativity increases in amplitude as the set size of the to-be- remembered array increases and stops increasing at each individual’s visual working memory capacity estimated behaviorally (Vogel and Machizawa, 2004). This sensitivity to visual working memory load and predictive relationship to an individual’s working memory capacity have made the CDA a vital tool with which to study the temporary storage of information in memory (Carlisle, Arita, Pardo, & Woodman, 2011; Kundu, Sutterer, Emrich, & Postle, 2013; Luria, Sessa, Gotler, Jolicoeur, & Dell’Acqua, 2010; Vogel & Machizawa, 2004; Vogel, McCollough, & Machizawa, 2005). However, it is important to determine whether this measure truly indexes memory-related activity and is not due to the simpler alternative explanation that it is a manifestation of eye movements. This alternative becomes particularly concerning because recent evidence indicates that even very small eye movements (e.g. microsaccades), that are difficult to exclude from the analyses of the EEG and ERP data, modulate electrophysiological responses measured over the back of the head (Dimigen, Valsecchi, Sommer, & Kliegl, 2009; Yuval-Greenberg, Tomer, Keren, Nelken, & Deouell, 2008).
If systematic gaze shifts occur with the memory load, then it could explain the characteristics of the CDA. Unilateral visual memory tasks are used to measure the CDA. Figure 1 illustrates a unilateral visual memory task in which four objects are presented in the left and the right visual fields, but subjects are required to remember only the four object presented on the left, as indicated by the cue. Following the memory array is a retention interval in which nothing appears on the screen, and the subjects’ exhibit a contralateral negativity over the right posterior cortex that is sustained during the memory retention interval. However, the spatial cues used in this memory paradigm are known to to elicit microsaccades to the relevant direction in previous studies of the deployment of covert attention (Engbert & Kliegl, 2003; Hafed & Clark, 2002; Yokoyama, Noguchi, & Kita, 2012). Moreover, previous work has shown that people make eye movements toward the locations of objects that they previously viewed, but are now holding in visual working memory (Williams, Pouget, Boucher, & Woodman, 2013), consistent with theories proposing that spatial attention is tightly coupled to visual working memory maintenance (Awh & Jonides, 2001). Therefore, if gaze is systematically shifted to the visual field of memoranda, then the corneoretinal potential could be producing the more negative potential of the CDA at the contralateral occipitoparietal electrodes because the corneoretinal potential generates a dipole that is positive at the cornea and negative at the posterior retina (Plöchl, Ossandon, & Konig, 2012).
Figure 1.

Example stimulus sequence of the unilateral visual memory task. The boundary color of each square box of the stimulus (which is not shown during the experiment) matches the color of the timeline shown with the time course plots of the paper.
Here we tested the hypothesis that systematic shifts in gaze occur during the memory retention intervals and underlie the CDA in the paradigm used to measure it. We tested this hypothesis by concurrently recording subjects’ ERPs and their eye movements using a high-resolution eye tracker. If this hypothesis is correct, then we should observe that gaze shifts are load dependent like the CDA. In addition, when systematic gaze shifts are absent (on average) from a set of trials, the CDA should be absent. Finally, the latency of these gaze shifts should occur simultaneously with the onset of the CDA. In contrast, if the CDA does measure the active maintenance of information in visual working memory independent of eye movement behavior, then we should see that the subjects’ eye movements are dissociable from the CDA using these amplitude and latency relationships.
Materials and Methods
Participants
Twenty-four adults with normal color vision, acuity, and no neurological history provided informed consent in advance of procedures approved by Vanderbilt University’s Institutional Review Board. Subjects were compensated $10 per hour for their participation. Five subjects’ data were excluded from the analysis. The exclusion criteria included problems in recording eye movements (one), excessive blinking (one), trouble in discriminating reddish colors (one), and averaged gaze shifts during the retention intervals greater than 0.5° of visual angle (two).
Apparatus
Observers were seated and their head was positioned 114 cm from a computer screen on a chinrest. Manual responses were made on a gamepad (Logitech Precision, Switzerland) during the memory task. All stimuli were presented on a gray background (x = 0.41, y = 0.51, 47.5 cd/m2) using the Psychophysics Toolbox-3 (Brainard, 1997; Pelli, 1997) in conjunction with Matlab (Mathworks, MA, USA).
Stimuli and Procedure
On all trials the to-be-remembered objects were colored squares. The size of each colored square was 0.9° × 0.9° of visual angle. Each square was randomly assigned one of six possible colors (red, x = 0.548, y = 0.334, yellow, x= 0.420,y=0.503, green, x = 0.278, y = 0.614, blue, x= 0.114, y= 0.065, cyan, x=0.200, y=0.291 and magenta, x= 0.291,y= 0.146).
The stimulus sequence from an example trial is shown in Figure 1. Subjects completed two visual memory tasks in different blocks of trials. One was a whole-field change-detection task used to estimate visual working memory capacity (described below). The other was the typical unilateral change-detection task used to study the CDA (Vogel & Machizawa, 2004; Vogel, et al., 2005).
In the unilateral change-detection task, each trial began with a red warning cross presented for 500 msec (to signal a new trial was about to begin) followed by a black fixation cross for 500 msec (both 0.6° × 0.6°). Then a cue was presented above fixation (1.2°) for 200 msec pointing to either the left (<) or the right (>). Next, we presented the memory array for 100 msec. Each array consisted of one, two, four or six colored squares presented on both sides of the fixation (e.g., see a set size 4 array in Figure 1A). The colored squares were presented within an imaginary box (6° × 12°) with the center displaced 4.7° to the left and right of fixation with a minimum inter-item distance of at least 2.4°. A 900 msec retention interval followed the memory array in which only the fixation was presented. Finally, the test array was presented until subjects responded. The test array was identical to the memory array (i.e., a same trial) or the color of a single item in the cued visual field was replaced with any one of the other colors (i.e., a different trial). Subjects had to press different buttons using their left or right index finger to report whether the test array was the same or different. The response mapping was counterbalanced across subjects for this same versus different judgment. Subjects completed 28 blocks of 32 trials, for a total of 896 trials. Subjects’ eye position was checked and recalibrated at the end of any trial, when necessary, with a mandatory recalibration at the beginning of each 32-trial block.
To estimate subjects’ working memory capacity, subjects performed a whole-field change-detection task in which the same stimulus sequence was used except for the following. Instead of the cue indicating either the left or the right visual field, a minus sign (-) was presented indicating that subjects had to remember the entire memory array. These memory arrays had either one, two, three or four items presented on both sides of the fixation cross resulting in set sizes of two, four, six or eight objects. These set sizes were randomly interleaved. Subjects completed 8 blocks and each block consisted of 48 trials, for a total of 384 trials. The whole-field change-detection task was performed either before of after the unilateral change-detection task with order counterbalanced across subjects.
Electrophysiological Recording and Analyses
We recorded the EEG with tin electrodes embedded in an elastic cap (Electro-Cap International, Eaton, OH, USA). The caps contained a subset of the International 10/20 System sites (Fz, Cz, Pz, F3, F4, C3, C4, P3, P4, PO3, PO4, T3, T4, T5, T6, O1 and O2) in addition to two non-standard sites (OL, placed halfway between O1 and T5; OR, placed halfway between O2 and T6). The electrodes were referenced online to the right mastoid, and re-referenced offline to the average of the right and left mastoids (Nunez, 2006). We recorded the horizontal electrooculogram (EOG) from two electrodes placed approximately 1 cm from the external canthus of each eye and an electrode placed approximately 3 cm above and below the left eye to measure the vertical EOG. Signals were amplified using an SA Instrumentation amplifier with a gain of 20,000 and a bandpass of 0.01-100 Hz. The amplified signals were digitized by a PC-compatible computer at a rate of 250 Hz and averaged offline. Individual trials contaminated with blinks, muscle noise, or amplifier saturation were rejected prior to averaging.
The ERP waveforms were timelocked to the onset of the memory array and baseline corrected to the interval -200 msec to 0 msec before the onset of the memory array. The CDA responses were obtained by subtracting the contralateral responses from the ipsilateral responses from the occipitoparietal electrodes (PO3/4, OL/R, T5/6) for each set size. Waveforms were low-pass filtered (a two-way least-squares finite-impulse- response filter with 0 Hz and 35 Hz for low and high end of the frequency band) for presentation in the figures only. The analyses were performed on the unfiltered mean voltages. For statistical analyses, the CDA amplitudes were obtained by averaging the traces of the temporal window between 500 ms and 1000 ms following the memory array onset.
Eye Movement Recording and Analysis
The subjects’ eye movements were recorded with an Eyelink 1000 (SR Research, Ontario, Canada) video-based eye tracker. For all subjects, the position of the left eye was recorded with a 1000 Hz sampling rate. To measure subjects’ changes in their gaze position during the retention interval, the eye-tracker data were normalized such that they were timelocked to the onset of the memory array and baseline corrected to the interval between -200 msec and 0 msec before the onset of the memory array. Like the CDA, gaze shifts were then measured by averaging the eye traces from the 500 msec to 1000 msec with respect to the memory array onset.
Microsaccades Analysis
To detect microsaccades, we applied the algorithm developed by Engbert and Kliegl (2003) with following variations. Briefly, the velocity vector was created using a moving average over five data samples to suppress noise. For each trial, a threshold was set at the value that was 6 times the standard deviation by applying a median estimator for the time series of the horizontal and vertical eye positions, respectively. Because we only recorded the left eye for all subjects, we could not apply the last step that Engbert and Kliegl (2003) used in which they combined the time series of both eyes’ positions to reduce erroneous detection of microsaccades. Instead, we eliminated erroneous detection if the peak velocity and saccade amplitude identified in the first step lasted less than 12 ms. In addition, we disregarded those movements occurring within a 50 ms refractory period following a gaze shift. We set this 50 ms refractory period based on the recent neurophysiological study in which spike activities associated with microsaccades in the superior colliculus build up over 50 ms (Hafed & Clark, 2002). This set of procedures eliminates various sources of noise including post-saccadic ringing that is usually observed with video-based eye trackers (Kimmel, Mammo, & Newsome, 2012). Then, a main sequence was obtained from each subject by plotting saccade amplitudes and their peak velocity occurring within the temporal window from 0 ms to 1000 ms following the memory array onset (Zuber, Stark, & Cook, 1965).
Results
Set size dependent eye movements were robust
Figure 2A shows the time course of the CDA recorded across the four different set sizes. Consistent with previous studies, the CDA amplitude increased with set size and saturated at the subjects’ mean visual working memory capacity limit of 2.59 objects calculated from their button-press behavior (Vogel & Machizawa, 2004; Vogel, et al., 2005). A one-way ANOVA on CDA mean amplitude confirmed a significant main effect of set size [F(1,18) = 33.14, p < 0.001].
Figure 2.

Set size dependent, time course data. A) The time course of the CDA responses plotted for the four set size conditions (blue = 1, cyan = 2, yellow = 4 and red = 6). B) The time course of the eye movements plotted the same way as the CDA. C) The time course of the HEOG plotted like the CDA. D) The time course of the pupil size plotted like the CDA.
Eye position also shows sustained, systematic shifts with set size, like the CDA. Figure 2B shows the time courses of the gaze shifts for the four set sizes. We collapsed the left and the right cue conditions so that the positive shift indicates the direction of the task relevant stimuli in the memory array.1 Gaze shifts in the direction of the task-relevant stimuli in the memory array increased with set size and began to saturate at the largest set size, similar to the pattern of CDA amplitudes. Although this shift in eye position might occur across a series of fixational eye movements including microsaccades (Steinman, Haddad, Skavenski, & Wyman, 1973), we focus on the averaged gaze shifts to compare them to the CDA modulation, unless we explicitly define the gaze shifts otherwise below. To quantify this shift in eye movements, we averaged these traces of horizontal eye movements using a measurement window between 500 ms and 1000 ms following the memory array onset, just like the CDA. A one-way ANOVA was performed after collapsing data across the left and the right cues, yielding a significant effect of set size [F(1,18) = 21.73, p < 0.001]. We note that these findings were not simply due to subjects not following the instructions to strictly maintain fixation, because just 2.92% of the trials were excluded due to gaze shifts or any single saccade greater than 2°.
One might be concerned that changes in pupil size could also produce signals that appear as gaze shifts when using a video-based eye tracker. We ruled out this possibility with the following three observations. First, assuming similar changes in the pupil size for the left and the right cue conditions, such changes of the eyes cannot explain the opposite patterns of gaze shifts during these two different stimulus conditions. Second, the time course of the HEOGs, which is insensitive to the changes in the pupil size, were similar to the traces of gaze shifts obtained from the video-based eye tracker (Figure 2C). Lastly, the averaged pupil size measured from the same trials resulted in qualitatively different dynamics from the time course of the gaze shifts (Figure 2D).
We next address the possibility that the systematic shifts in gaze were driven by a small number of trials with large amplitudes or by a few subjects who moved their eyes more than others. Figure 3A shows the averaged gaze shifts across all trials from the 5th to the 95th percentile with 10 percentile wide bins. Across all bins, gaze shifts elicited by the higher set size were greater than those elicited by the lower set size. Figure 3B shows the gaze shifts of all subjects. Large variability existed across subjects, but the gaze shifts systematically increased with set size across almost all observers. These results indicate that neither a small subset of trials nor a small subset of subjects with more shifts of fixation were the cause of the set size dependent eye movements.
Figure 3.

Gaze shifts across trials and subjects. A) The averaged gaze shift for each set size plotted for every 10 percentile (blue = 1, cyan = 2, yellow = 4 and red = 6). B) Gaze shift amplitude of the 19 subjects for each set size.
Stimulus configuration does not elicit the set size dependent eye movements
We have shown that the set size dependent eye movements were robust in the unilateral memory task. However, manipulating the set size of the memory arrays not only increased the working memory load but also increased the stimulus density and area occupied by stimuli. In addition, previous studies showed that saccadic eye movements are sensitive to the stimulus configuration (Fehd & Seiffert, 2010; Vishwanath & Kowler, 2003). This means that the changes in the memory arrays that we used to increase the visual working memory load may have elicited different eye movement behavior simply due to the presentation of more stimuli. According to this alternative explanation, the systematic eye movements may have been due to low-level perceptual processing and not related to the visual working memory demands of the task as set size increased. Contrary to the perceptual explanation of the set size dependent eye movements we observed, we found the stimulus configuration hypothesis cannot account for our findings for the following four reasons.
First, we measured differences in the configurations across set sizes by measuring the center of gravity (i.e., the mean center of each item in the array) across set sizes. However, the center of gravity of the to-be-remembered stimuli cannot explain the set size dependent eye movements because the center of gravities across all four set sizes were not different (dotted line with square data points in Figure 4A). This observation was confirmed with a one-way ANOVA on the measured center of gravity across set sizes (1-6), yielding no effect of set size [F(1,18)= < 1, p > 0.5]. This was expected because the positions of the stimuli were randomly assigned within an imaginary square.
Figure 4.

Gaze shifts plotted as a function of stimulus configuration. A) Center of gravity plotted as a function of the set size where the solid box indicates the proximal trial type (solid line with circle markers) and the dotted box indicates the eccentric trial type (dotted line with circle markers). The dotted line with square markers indicates the median of the center of gravity at the given set size. B) Gaze shifts from the proximal and the eccentric trial types. C) Center of gravity of the distractor-farther (solid line with circle markers) and the distractor-closer (dotted line with circle markers) trials plotted as a function the set size. D) Gaze shifts from the distractor-father and the distractor-closer trials. E) Center of gravity of the farthest item plotted as a function the set size for the proximal (solid line with circle markers) and the eccentric (dotted line with circle markers) trials. F) Gaze shifts from the proximal and the eccentric trials.
Second, we separated the trials into two groups based on the median center of gravity: one group close to the fixation (proximal trials shown as the solid box) and the other group far from the fixation (eccentric trials shown in the dotted box). Figure 4A shows the center of gravity as a function of the set size for these two groups of trials across set sizes. The difference in the center of gravity between the eccentric and the proximal trials decreased with the set size because the variability in the stimulus configuration was large for the small set sizes but variability was smaller for the larger set sizes. Despite the difference in the stimulus configuration between the eccentric (dotted) and the proximal (solid) trials, subjects’ gaze shifts were similar (Figure 4B). We entered the median split data into a two-way ANOVA with factors of stimulus configuration (proximal vs. eccentric) and set size (1-6). This yielded a significant effect of set size [F(1,18) = 21.85, p < 0.001], but neither the main effect of stimulus configuration [F(1,18) < 1, p > 0.5] nor the interaction with set size was significant [F(1,18) < 1, p > 0.5].
Third, the stimulus configuration of the opposite visual field was included in order to examine whether the eye movements were influenced by the low-level stimulus properties of the distractors in the opposite hemifield. The distractors-closer trials (dotted box) were selected if the center of gravity of the cued visual field was located outside of the median distance from fixation while the center of gravity of distractors presented in the opposite visual field was located inside of its median. The distractors-farther trials were selected using the opposite criterion (solid box). Figure 4C shows the center of gravity computed from these two trial types, showing that the overall center of gravity of the distractor-closer trials (dotted) lies in the cued visual field whereas the center of gravity of the distractors-farther trials (solid) lies in the opposite visual field. However, eye movements were similar between the two trial types (see Figure 4D). This was confirmed by entering the eye movement data into an ANOVA with the factors of trial type (distractors-closer versus distractors-farther) and set size (1-6). This ANOVA yielded a significant main effect of set size [F(1,18) = 20.91, p < 0.001], but neither a main effect of trial type [F(1,18) < 1, p=0.49] nor an interaction of these factors [F(1,18) < 1, p > 0.5].
Fourth, because the gaze shifts continued to increase with set size and the distance of the farthest item from the fixation also increased with set size, we examined the influence of an item presented at the far end of the cued visual field. However, when a similar median split analysis was performed based on the median of the farthest items (Figure 4E), no difference in the eye movements was observed (see Figure 4F). This was confirmed by an ANOVA with the factors of trial type (proximal farthest item versus eccentric farthest item) and set size (1-6). This yielded a significant main effect of set size [F(1,18) = 21.84, p < 0.001], but neither a main effect of trial type [F(1,18) < 1, p > 0.5], nor an interaction of these factors [F(1,18) < 1, p > 0.5]. In summary, the findings of all four follow-up analyses demonstrate that stimulus configuration cannot explain the set size dependent eye movements that we observed during the memory retention intervals. Having established that gaze shifts exhibit set size dependent effects like the CDA, we can now turn to our tests of the hypothesis that these eye movements underlie this ERP effect.
Microsaccades during the retention interval of visual working memory
We found that a majority of subjects exhibited robust, systematic gaze shifts in the unilateral visual memory task. Considering that subjects were following instructions to strictly maintain fixation and that the systematic shifts in gaze were less than 0.5° on average, our measured gaze shifts were likely due to fixational eye movements, including microsaccades.
We isolated microsaccades in our eye movement data to determine the relationship of this oculomotor behavior to our manipulation of visual working memory load. Figure 5A shows a main sequence in which peak velocity was plotted as a function of saccadic amplitude of each saccade detected between 0 ms and 1000 ms post-memory array onset where saccades greater than 2° were excluded. Although the literature varies regarding the criterion for classifying microsaccades from macrosaccades (from 0.2° to 2°; see a review by Rolfs, 2009), saccades smaller than 2° are thought to occur involuntarily under instructions to strictly maintain fixation (Martinez-Conde et al., 2006). Figure 5B shows the saccade frequency histogram for each set size as a function of time (every 20 ms time bin) locked with the memory array onset. Consistent with the previous literature, a characteristic inhibition of saccades occurred in response to the onset of visual stimuli (i.e., beginning -200 ms and 0 ms relative to memory array onset, induced by the cue and memory array onsets) and then rebounded during the retention interval (see review by Rolfs, 2009). The overall frequency of microsaccades was similar across the four set sizes. When a running one-way ANOVA with the factor of set size was conducted using 10 bins (200 ms window size) with a 20-msec step size, the microsaccadic frequency between 100 ms to 140 ms and between 300 ms to 340 ms were significant at a level of p < 0.05.
Figure 5.

Microsaccades results. A) Main sequence by plotting peak velocity as a function of saccadic amplitude from all subjects. B) Saccadic frequency plotted as a function of time for each set size (blue = 1, cyan = 2, yellow = 4 and red = 6). C) Normalized saccadic frequency for 12 saccadic directions within the measurement window between 20 ms and 220 ms. D) Averaged saccadic amplitudes plotted like C). E) Normalized saccadic frequency for 12 saccadic directions within the measurement window between 220 ms and 420 ms. F) Averaged saccadic amplitudes plotted like F).
To see what factor drove this set size dependent modulation, we plotted the frequency and the direction of microsaccades. We used a bin size of 30° in angular width for sorting the direction of microsaccades. The frequency was normalized with the total number of microsaccades of each set size. We collapsed the left and the right cue conditions such that 0° corresponded to the cued direction. First, we analyzed the saccadic frequency within the measurement window (20 - 220 ms) where saccadic inhibition was most pronounced. We found that microsaccades appeared to occur more frequently in the cued direction, but this directional bias was similar across all four set sizes (Figure 5C). As a result, no factor was significant when a two-way ANOVA with the factors of set size (1-6) and direction (0°-330° for 30° step size) was performed [F(1,18)=2.68, p=0.12 for set size; F(1,18)<1, p>0.5 for direction; F(1,18)<1, p>0.5 for set size X direction]. We also analyzed the saccadic amplitude. If no microsaccade was elicited in a particular direction from a subject, we assigned 0 for its amplitude (Figure 5D). Similar to the saccadic frequency, amplitudes appeared to be greater for the cued direction but they did not increase with the set size. A two-way ANOVA with the factors of set size and direction yielded marginal significance for the direction [F(1,18)=3.51, p=0.077] but no other significant effects [F(1,18)=1.505, p=0.235 for set size; F(1,18)=1.294, p=0.27 for set size X direction]. This pattern of results is consistent with recent studies investigating characteristics of microsaccades during the inhibition period (Hafed & Ignashchenkova, 2013; Pastukhov & Braun, 2010) where those rare saccades were not strongly biased in one direction due to the spatial configuration of the balanced bilateral stimuli. Although only trending toward significance, the saccades that were induced toward the cued direction are likely due to the cue presented 200 ms prior to the memory array.
Second, we analyzed microsaccadic frequency within the next measurement window, where saccadic frequency rebounded (220 - 420 ms). We expected that this window would be informative because the time courses of gaze shifts for the four set sizes diverged around 300 ms and then saturate around 500 ms as shown in Figure 2B. We found that greater proportion of microsaccades was elicited toward the cued hemifield and increased with set size (Figure 5E). A two-way ANOVA with the factors of set size and direction was conducted. Overall saccadic frequency was similar across the four set sizes [F(1,18)<1, p>0.5]. However, microsaccades were elicited more to the cued direction [F(1,18)=10.68, p=0.0042] and increased with the set size for that cued direction [F(1,18)=10.58, p=0.0044 for set size X direction]. In addition, saccadic amplitudes were also strongly biased to the cued direction and appeared to increase with the set size (Figure 5F) [F(1,18) = 10.58, p=0.0044 for direction; F(1,18)=3.868, p=0.0648 for set size; F(1,18)=1.683, p=0.211 for set size X direction]. This pattern of results suggests that the direction and amplitude of microsaccades play a critical role in inducing the set size dependent gaze shifts that we observe on average.
In the following analyses, we tested the hypothesis that these systematic gaze shifts underlie the CDA in the unilateral visual memory task. Note, however, that we focus on the gaze shifts in general, instead of microsaccades in particular, because the corneoretinal potential hypothesis predicts that the CDA should be observed on all trials with measurable shifts of gaze, but not on trials without micro- or macro-saccadic gaze shifts.
The relationship between the CDA and gaze shifts
To determine whether the set size dependent eye movements described above generated or at least contributed to the CDA, we performed a median split of the ERP data based on the size of the gaze shifts measured trial by trial. We divided the trials based on the median angular deflection of each subject’s gaze shift at each set size. Figure 6A shows the averaged gaze shifts for the large-shift trials (solid line) and the small-shift trials (dotted line). Because the trials were divided based on the median gaze shifts at a given set size, the averaged gaze shifts of the large-shift trials were, by definition, greater than the gaze shifts in the small-shift trials. The averaged gaze shift of the small-shift trials was close to or even smaller than 0, indicating that subjects in these trials rarely moved their eyes during the retention interval or even shifted their gaze away from the relevant hemifield on average.
Figure 6.
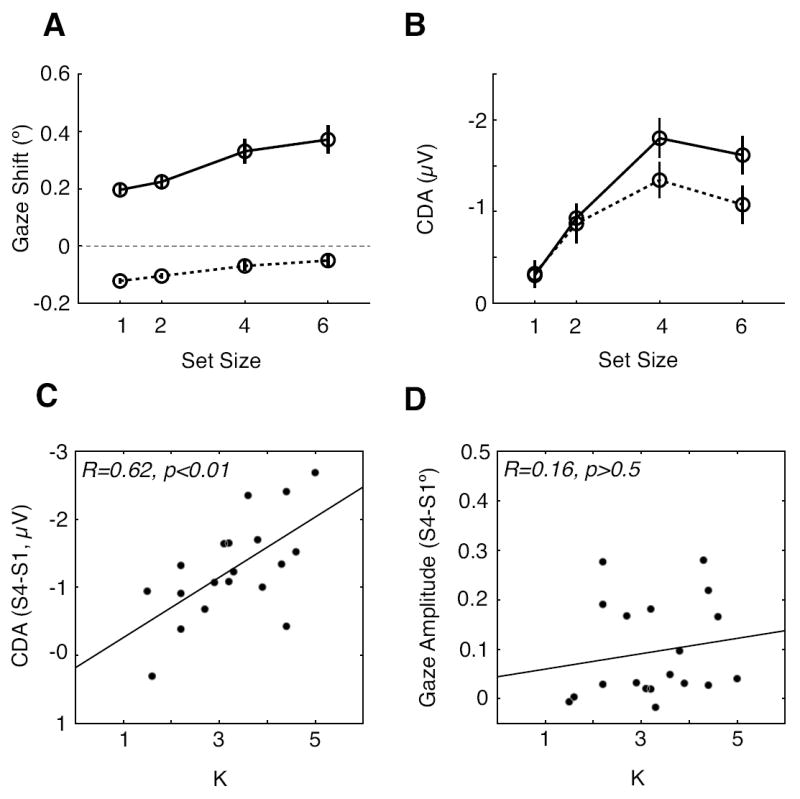
Performance and CDA amplitude as a function of gaze shift size, and correlations between capacity and CDA amplitude and gaze shift magnitude. A) Gaze shift amplitude for the large-shift trials (solid line) and the small-shift trials (dotted line) with respect to the median gaze shift as a function of set size. B) The CDAs obtained from the large-shift trials (solid) and the small-shift trials (dotted) as a function of set size. C) Correlation between individuals’ visual working memory capacity estimates (K) and the CDA amplitude differences obtained between the set size 4 and 1. D) Correlation between the individuals’ capacity estimates and the gaze shift differences obtained between the set size 4 and 1.
Figure 6B shows the CDAs obtained from the large- and small-shift trials across the four set sizes. The CDA amplitudes were higher for the large-shift trials than for the small-shift trials. A two-way ANOVA with the factors of shift size (small versus large shift) and set size (1-6) on CDA mean amplitude showed significant effects of set size [F(1,18) = 32.41, p < 0.001] and shift size [F(1,18) = 8.45, p = 0.001], and the two factors interacted significantly [F(1,18) = 4.419, p = 0.049]. Given that the effect of the corneoretinal potential caused by eye movements is to induce a more negative potential at the occipitoparietal electrodes, it would have been surprising if the eye movements did not influence the CDA at all. However, the critical question is whether the CDA was robustly observed even on those trials when overall gaze shifts were essentially absent (see the small-shift trials in Figure 6A). Importantly, we acknowledge that the absence of gaze shift on average does not mean that the absence of eye movements at all, but it means that eye movements in the opposite direction occur over multiple trials with similar magnitudes and, thus, result in no net shifts in the corneoretinal potential. Accordingly, if we use those trials for generating the CDA averages, we can safely conclude that the influence of the corneoretinal potential on the CDA was near zero. When a separate, one-way ANOVA was run on only the small-shift trials, it yielded a significant main effect of set size [F(1,18) = 8.494, p < 0.0093]. This characteristic pattern of CDA activity means that representations in visual working memory are sufficient to generate the sustained, contralateral negativity that defines the CDA, even in the absence of systematic gaze shifts.
Next, we examined whether the magnitude of gaze shifts correlates with the individual capacity estimates derived from change-detection performance in the whole-field task. Previous studies have shown that an individual’s visual working memory capacity limit (known by the variable K) is strongly correlated with the amplitude changes of the CDA across set size, providing evidence that CDA reflects the storage of items in the visual working memory (Vogel & Machizawa, 2004; Vogel, et al., 2005). Consistent with this previous work, we found a strong correlation between the CDA amplitude difference across set sizes (set size 4 - set size 1 amplitude) and the individual subject’s capacity estimated independently using the whole-field task (Figure 6C, r = 0.620, p = 0.0046). We chose to use the set size 4 ERP data because the CDA amplitudes were highest at 4 and, thus, provided the greater variability than at set size 6 where some subjects showed decreases relative to set size 4. However, unlike the CDA, the magnitude of the difference in gaze shifts (set size 4 – set size 1) did not correlate with the individual subject’s capacity (Figure 6D, R = 0.162, p > 0.5). If the CDA was elicited by the eye movements, rather than being an independent measure of the representations in visual working memory, the subjects’ capacity estimates should have been significantly correlated with the magnitude of the gaze shifts. These two results provide evidence that is inconsistent the hypothesis that gaze shifts underlie the CDA.
Eye movements do not affect change-detection performance
Theories propose that visual attention and visual working memory are tightly linked such that visual attention is used to rehearse representations in working memory when they are out of view (Awh & Jonides, 2001; Cowan, 2001). Other theories propose that eye movements are tightly coupled with visual attention (Rizzolatti, Riggio, Dascola, & Umilta, 1987). In addition, several studies have shown that microsaccades index deployment of covert shift in spatial attention (Engbert & Kliegl, 2003; Hafed & Clark, 2002). We thought that people might shift gaze to the locations of items in memory to help rehearse them, as they do with covert shifts of attention. In the context of our task, gaze shifts toward the cued visual field in the unilateral visual memory task might facilitate a subject’s change-detection performance. To determine whether gaze shifts during the retention interval aided subjects’ change detection we conditionalized the trials based on the magnitude of gaze shifts as in Figure 6A and examined the accuracy of change detection. However, we found that a subject’s performance was not related to the gaze shift magnitude.
Despite the difference in eye movements, the subjects’ change-detection performance was similar between the large- (solid line) and small-shift trials (dotted line) (Figure 7A). A two-way ANOVA with the factors of shift size (large versus small shift) and set size on mean change detection showed a significant main effect set size [F(1,18) = 444.6, p < 0.001], but the main effect of gaze shift and the interaction of gaze shift X set size were not significant [gaze shift, F(1,18) < 1, p = 0.44; set size X gaze-shift F(1,18) = 3.59, p = 0.074]. These findings indicate that differences in eye movement behavior do not account for the variability of change-detection performance across trials. In addition, eye movements were not different between the correct (black) and the incorrect trials (red) as shown in Figure 7B. This observation was supported by an ANOVA with the factors of accuracy (correct versus incorrect) and set size on the eye movement data. This yielded a significant main effect of set size [F(1,18) = 19.17, p < 0.001], but the main effect of accuracy was not significant [F(1,18) < 1, p > 0.5]. The interaction of set size X accuracy approached significance [F(1,18) = 3.74, p = 0.069] due to weaker set size effects on incorrect trials. These findings provide conclusive evidence that eye movements of small magnitude, as occur in our study using the prototypical paradigm used to study the CDA, do not affect performance. Consistent with this observation, a recent study also has shown that working memory representation remain intact despite microsaccades occurring during the retention interval (Gaunt & Bridgeman, 2012). All these results indicate that the CDA provides a fairly pure index of the representations in visual working memory, being minimally influenced by miniature gaze shifts that are usually included in the analysis of the ERP component.
Figure 7.
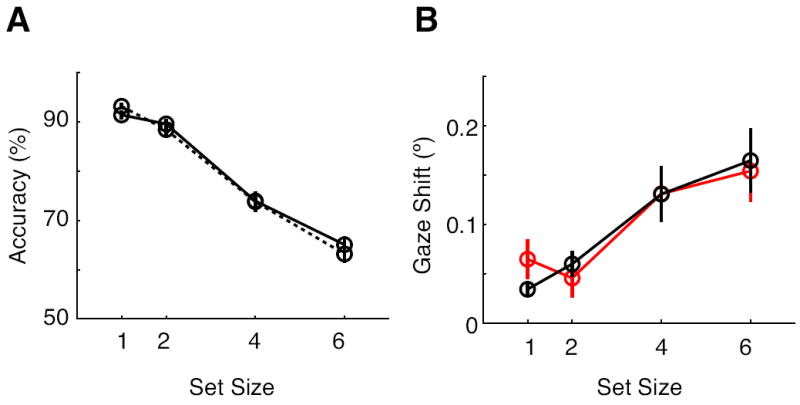
Effects of gaze shifts on change-detection performance. A) The change-detection performance for the large-shift trials (solid) and the small-shift trials (dotted) plotted as a function of the set size. B) Averaged gaze shifts from the correct (black) and incorrect (red) trials as a function of the set size.
Latency of the CDA and the gaze shifts during the retention intervals
If the corneaoretinal potential induced by gaze shifts underlies the CDA, then the onset of the CDA should be comparable to the onset of the gaze shifts. To test this prediction, we estimated the onset time of the set-size effect in the CDA data and in the eye movement data. Visual inspection of the Figure 2A and 2B suggests that the set size dependent CDA modulation preceded the eye movements. To confirm this statistically, we performed a sliding window analysis on both the CDA and eye movement data to determine when the set size effect became significant. The onset as determined using a sliding-window ANOVA with the factor of set size. We used the data from the set sizes of 1, 2, and 4 objects because the averaged CDA across subjects usually saturated near the mean capacity limit (~3 objects) and sometimes decreased with larger set sizes (e.g. Anderson, Vogel, & Awh, 2011). We defined the onset of each measure as the point at which the p-value dropped below 0.05 for more than 50 successive milliseconds. Figure 8 shows the F-statistics associated with sliding window analyses run on the CDA (blue) and the eye-movements (red) across the retention interval. The horizontal lines indicate the statistical significance with a p-value less than 0.05 (dotted) and 0.01 (solid). The estimated onset was 252 ms for the CDA and 326 ms for the eye movements, a 50 msecs difference consistent with our observed means (compare Figures 2A and 2B). These results provide yet another piece of evidence falsifying the hypothesis that gaze shifts underlie the CDA.
Figure 8.
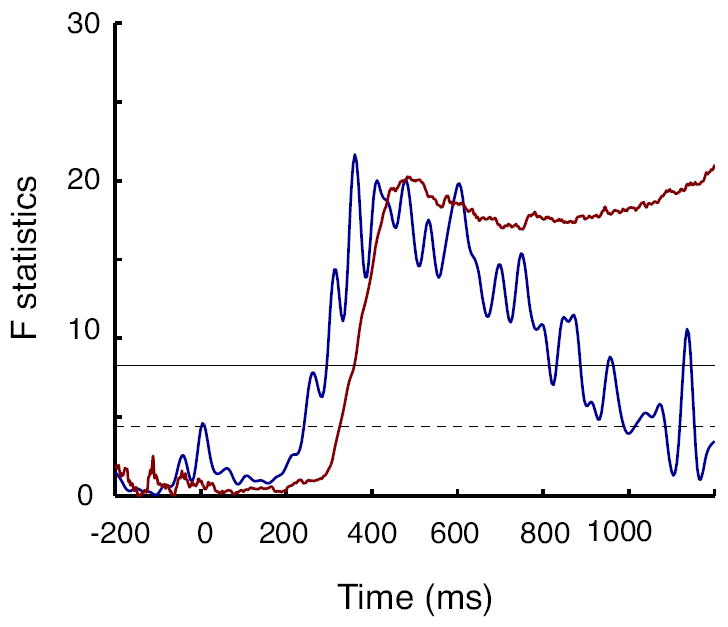
The latency of the CDA and eye movement set-size effects. F-statistics plotted over time for the CDA (blue) and the eye movements (black). F-statistics obtained by one-way ANOVA applied to measurements at every sampling over time for the three set sizes (1, 2 and 4). The horizontal lines indicate p-value levels of 0.05 (dotted line) and 0.01 (solid line).
Discussion
Our goal was to test the hypothesis that gaze shifts underlie the neurophysiological signature of visual working memory storage known as the CDA. Initially consistent with this hypothesis, we found that subjects’ gaze was shifted toward the visual field where the relevant memory items are presented despite the fact that only the cross fixation is centrally presented during the retention interval. We found that these gaze shifts were systematic in that their magnitude increased with the size of the set of objects subjects needed to remember. The systematic gaze shifts cannot be explained by a small number of trials, by subjects with large shifts, or by the eccentricity of the stimulus configurations across set sizes. In addition, our analyses suggest that fixational eye movements, including microsaccades, play a critical role in inducing the systematic shifts in gaze.
Despite the presence of these set-size dependent gaze shifts, we found that the gaze shifts had no effect on subjects’ change detection performance. More importantly. our other findings demonstrate that they do not underlie the CDA. Three observations support this conclusion. First, the CDA was robustly and reliably measured even on trials with no average shifts of gaze in the direction of the to-be-remembered items. Second, the amplitude of the CDA was correlated with the individual subject’s visual working memory capacity, but the magnitude of the eye movements was not. Third, the set-size dependent CDA began at least 50 ms before the set-size dependent eye movements. These findings indicate that the shift in the corneoretinal potential induced by these eye movements does not underlie the CDA.2 Finally, our findings indicate that gaze shifts do not appear to provide a particularly sensitive measure of memory storage, at least in the kind of color change-detection task we used.
How can we explain the set size dependent gaze shifts occurring during the retention interval of the unilateral visual memory task? We proposed the sustained neural representations in visual working memory facilitate a build-up of activity in neurons that control gaze, especially microsaccades to a particular location (Basso & Wurtz, 1998; Hafed, Goffart, & Krauzlis, 2009; Ignashchenkova, Dicke, Haarmeier, & Thier, 2004). This proposal is reasonable based on recent studies. Population-level activity in the superior colliculus (SC) represents saccadic direction and amplitude (Lee, Rohrer, & Sparks, 1988) and Hafed et al. (2009) have shown that microsaccadic directions and amplitudes are systematically represented in the SC. In addition, Hafed and Ignoashchenkova (2013) recently proposed that the direction of microsaccades is sensitive to the peripheral spatial configuration of stimuli because topographically organized neural activity elicited by stimulus onset in the SC can trigger microsaccades if not canceled in a timely manner. Accordingly, if representations in visual working memory produce neural activity like perceptual inputs do in the unilateral visual memory task (Kang, Hong, Blake, & Woodman, 2011), then increasing memory load should produce more lateralized neural activity in the SC, eliciting set size dependent gaze shifts possibly mediated by microsaccades (Figure 5E & 5F). This is consistent with a similar proposal that activity in the SC underlies shifts of saccade trajectories away from locations held in visual working memory (Theeuwes, Olivers, & Chizk, 2005). Visual working memory related SC activity can also explain the weak lateralized microsaccades following the cue onset (Figure 5C) because the bilateral memory array following immediately after the cue provides the visual input to the SC and, thus, SC activity should be equally distributed bilaterally, overriding directional bias in microsaccades induced by the cue (Hafed & Ignashchenkova, 2013; Pastukhov & Braun, 2010). Of course, we propose that the SC is just one area that could contribute to this type of saccadic behavior. Cortical areas, like the frontal-eye fields and lateral intraparietal area, have neurons that contribute to the control of gaze and have been implicated in the maintenance of information in visual working memory (Chafee & Goldman-Rakic, 1998; Reinhart, et al., 2012).
Previous studies have demonstrated the tight link between various cognitive operations and eye movements including microsaccades (Engbert & Kliegl, 2003; Hafed & Clark, 2002; Hoffman & Subramaniam, 1995; Kahneman & Wright, 1971; Kowler, Anderson, Dosher, & Blaser, 1995; Moore & Armstrong, 2003; Schall, 2004). By simultaneous recording the neurophysiological measure of visual working memory maintenance (e.g., the CDA) and subjects’ eye movements, we found that the miniature gaze shifts appear to result from the representations in visual working memory, as opposed to the index of those representations being an artifact of those eye movements. These findings contribute an important piece to our growing understanding of the relationship between high-level cognitive operations and eye movement behavior.
We tested whether gaze shifts underlie the CDA measure of working memory storage
The CDA and gaze shifts toward the memoranda increased with the memory load
But the CDA was dissociated from the gaze shifts using both timing and magnitude
Acknowledgments
This research was supported by grants to from the National Eye Institute (RO1- EY019882) and the National Science Foundation (BCS 09-57072).
Footnotes
We found that the gaze shifts were greater when subjects were cued to remember objects in the right visual field than in the left visual field. We believe this asymmetry reflects disconjugate, horizontal eye movements because only the left eye was tracked. Previous studies documented the left and right eyes’ voluntary movements were slightly different even though both eyes fixate the same target (e.g. Collewijn, Erkelens, & Steinman, 1988; Robinson, 1964). Although, this asymmetry may be important for studies of binocular eye movements, it is not critical for the hypothesis tested in the present study. Thus, we collapsed the left and right cue conditions for our analyses to investigate the set size dependent eye movements.
We note that the pattern of results we observed is important from an alternative perspective in which eye movements toward the memoranda harms the measurement of the CDA. According to this perspective, given that eye movements toward the memoranda do occur, they may have actually worked against the observation of the CDA, because shifting gaze toward the stimuli being remembered shifts the representations of those stimuli toward the midline or even out of the contralateral visual field altogether. This would have the effect of reducing the amplitude of the CDA provided that the visual working memory representations are allocentric (i.e., each visual working memory representation is linked to a particular location regardless of where the eyes fixate), but the CDA measure is retinotopic (i.e., this ERP measures the number of representations that are currently in the contralateral hemifield relative to fixation at that moment). Whereas the corneoretinal-potential hypothesis that we tested predicts that eye movements will increase the observed amplitude of the CDA, this alternative predicts that the CDA should decrease in amplitude when gaze is shifted toward the memoranda. Our observation that the CDA was slightly larger when gaze shifts occurred appears to provide support for the hypothesis that the corneoretinal potential can boost the CDA amplitude. However, the nature of the spatial reference frames underlying the CDA and the visual working memory representations it measures requires further study.
Publisher's Disclaimer: This is a PDF file of an unedited manuscript that has been accepted for publication. As a service to our customers we are providing this early version of the manuscript. The manuscript will undergo copyediting, typesetting, and review of the resulting proof before it is published in its final citable form. Please note that during the production process errors may be discovered which could affect the content, and all legal disclaimers that apply to the journal pertain.
References
- Anderson DE, Vogel EK, Awh E. Precision in visual working memory reaches a stable plateau when individual item limits are exceeded. Journal of Neuroscience. 2011;31:1128–1138. doi: 10.1523/JNEUROSCI.4125-10.2011. [DOI] [PMC free article] [PubMed] [Google Scholar] [Retracted]
- Awh E, Jonides J. Overlapping mechanisms of attention and spatial working memory. Trends in Cognitive Sciences. 2001;5:119–126. doi: 10.1016/s1364-6613(00)01593-x. [DOI] [PubMed] [Google Scholar]
- Basso MA, Wurtz RH. Modulation of neuronal activity in superior colliculus by changes in target probability. Journal of Neuroscience. 1998;18:7519–7534. doi: 10.1523/JNEUROSCI.18-18-07519.1998. [DOI] [PMC free article] [PubMed] [Google Scholar]
- Brainard DH. The Psychophysics Toolbox. Spatial Vision. 1997;10:433–436. [PubMed] [Google Scholar]
- Carlisle NB, Arita JT, Pardo D, Woodman GF. Attentional templates in visual working memory. The Journal of Neuroscience. 2011;31:9315–9322. doi: 10.1523/JNEUROSCI.1097-11.2011. [DOI] [PMC free article] [PubMed] [Google Scholar]
- Chafee MV, Goldman-Rakic PS. Matching patterns of activity in primate prefrontal area 8a and parietal area 7ip neurons during a spatial working memory task. Journal of Neurophysiology. 1998;79:2919–2940. doi: 10.1152/jn.1998.79.6.2919. [DOI] [PubMed] [Google Scholar]
- Collewijn H, Erkelens CJ, Steinman RM. Binocular co-ordination of human horizontal saccadic eye movements. The Journal of physiology. 1988;404:157–182. doi: 10.1113/jphysiol.1988.sp017284. [DOI] [PMC free article] [PubMed] [Google Scholar]
- Cowan N. The magical number 4 in short-term memory: A reconsideration of mental storage capacity. Behavioral and Brain Sciences. 2001;23, 24:87. doi: 10.1017/s0140525x01003922. [DOI] [PubMed] [Google Scholar]
- Dimigen O, Valsecchi M, Sommer W, Kliegl R. Human microsaccade-related visual brain responses. The Journal of Neuroscience. 2009;29:12321–12331. doi: 10.1523/JNEUROSCI.0911-09.2009. [DOI] [PMC free article] [PubMed] [Google Scholar]
- Engbert R, Kliegl R. Microsaccades uncover the orientation of covert attention. Vision Research. 2003;43:1035–1045. doi: 10.1016/s0042-6989(03)00084-1. [DOI] [PubMed] [Google Scholar]
- Fehd HM, Seiffert AE. Looking at the center of the targets helps multiple object tracking. Journal of Vision. 2010;10 doi: 10.1167/10.4.19. [DOI] [PMC free article] [PubMed] [Google Scholar]
- Gaunt JT, Bridgeman B. Microsaccades and Visual-Spatial Working Memory. Journal of Eye Movement Research. 2012;5, 3(5):1–16. [Google Scholar]
- Hafed ZM, Clark JJ. Microsaccades as an overt measure of covert attention shifts. Vision Research. 2002;42:2533–2545. doi: 10.1016/s0042-6989(02)00263-8. [DOI] [PubMed] [Google Scholar]
- Hafed ZM, Goffart L, Krauzlis RJ. A neural mechanism for microsaccade generation in the primate superior colliculus. Science. 2009;323:940–943. doi: 10.1126/science.1166112. [DOI] [PMC free article] [PubMed] [Google Scholar]
- Hafed ZM, Ignashchenkova A. On the Dissociation between Microsaccade Rate and Direction after Peripheral Cues: Microsaccadic Inhibition Revisited. The Journal of neuroscience : the official journal of the Society for Neuroscience. 2013;33:16220–16235. doi: 10.1523/JNEUROSCI.2240-13.2013. [DOI] [PMC free article] [PubMed] [Google Scholar]
- Hoffman JE, Subramaniam B. The role of visual attention in saccadic eye movements. Perception and Psychophysics. 1995;57:787–795. doi: 10.3758/bf03206794. [DOI] [PubMed] [Google Scholar]
- Ignashchenkova A, Dicke PW, Haarmeier T, Thier P. Neuron-specific contribution of the superior colliculus to overt and covert shifts of attention. Nature Neuroscience. 2004;7:56–64. doi: 10.1038/nn1169. [DOI] [PubMed] [Google Scholar]
- Kahneman D, Wright P. Changes of pupil size and rehearsal strategies in a short-term memory task. The Quarterly journal of experimental psychology. 1971;23:187–196. doi: 10.1080/14640747108400239. [DOI] [PubMed] [Google Scholar]
- Kang MS, Hong SW, Blake R, Woodman GF. Visual working memory contaminates perception. Psychonomic Bulletin & Review. 2011;18:860–869. doi: 10.3758/s13423-011-0126-5. [DOI] [PMC free article] [PubMed] [Google Scholar]
- Kimmel DL, Mammo D, Newsome WT. Tracking the eye non-invasively: simultaneous comparison of the scleral search coil and optical tracking techniques in the macaque monkey. Frontiers in behavioral neuroscience. 2012;6:49. doi: 10.3389/fnbeh.2012.00049. [DOI] [PMC free article] [PubMed] [Google Scholar]
- Kowler E, Anderson E, Dosher B, Blaser E. The role of attention in the programming of saccades. Vision Research. 1995;35:1897–1916. doi: 10.1016/0042-6989(94)00279-u. [DOI] [PubMed] [Google Scholar]
- Kundu B, Sutterer DW, Emrich SM, Postle BR. Strengthened effective connectivity underlies transfer of working memory training to tests of short-term memory and attention. The Journal of neuroscience : the official journal of the Society for Neuroscience. 2013;33:8705–8715. doi: 10.1523/JNEUROSCI.5565-12.2013. [DOI] [PMC free article] [PubMed] [Google Scholar]
- Lee C, Rohrer WH, Sparks DL. Population coding of saccadic eye movements by neurons in the superior colliculus. Nature. 1988;332:357–360. doi: 10.1038/332357a0. [DOI] [PubMed] [Google Scholar]
- Luria R, Sessa P, Gotler A, Jolicoeur P, Dell’Acqua R. Visual short-term memory capacity for simple and complex objects. Journal of cognitive neuroscience. 2010;22:496–512. doi: 10.1162/jocn.2009.21214. [DOI] [PubMed] [Google Scholar]
- Moore T, Armstrong KM. Selective gating of visual signals by microstimulation of frontal cortex. Nature. 2003;421:370–373. doi: 10.1038/nature01341. [DOI] [PubMed] [Google Scholar]
- Nunez P. Electric fields of the brain The neurophysics of EEG. Oxford: Oxford University Press; 2006. [Google Scholar]
- Pastukhov A, Braun J. Rare but precious: microsaccades are highly informative about attentional allocation. Vision Research. 2010;50:1173–1184. doi: 10.1016/j.visres.2010.04.007. [DOI] [PubMed] [Google Scholar]
- Pelli DG. The VideoToolbox software for visual psychophysics: transforming numbers into movies. Spatial Vision. 1997;10:437–442. [PubMed] [Google Scholar]
- Plöchl M, Ossandon JP, Konig P. Combining EEG and eye tracking: identification, characterization, and correction of eye movement artifacts in electroencephalographic data. Frontiers in Human Neuroscience. 2012;6:278. doi: 10.3389/fnhum.2012.00278. [DOI] [PMC free article] [PubMed] [Google Scholar]
- Reinhart RM, Heitz RP, Purcell BA, Weigand PK, Schall JD, Woodman GF. Homologous mechanisms of visuospatial working memory maintenance in macaque and human: properties and sources. Journal of Neuroscience. 2012;32:7711–7722. doi: 10.1523/JNEUROSCI.0215-12.2012. [DOI] [PMC free article] [PubMed] [Google Scholar]
- Rizzolatti G, Riggio L, Dascola I, Umilta C. Reorienting attention across the horizontal and vertical meridians: evidence in favor of a premotor theory of attention. Neuropsychologia. 1987;25:31–40. doi: 10.1016/0028-3932(87)90041-8. [DOI] [PubMed] [Google Scholar]
- Robinson DA. The Mechanics of Human Saccadic Eye Movement. The Journal of physiology. 1964;174:245–264. doi: 10.1113/jphysiol.1964.sp007485. [DOI] [PMC free article] [PubMed] [Google Scholar]
- Rolfs M. Microsaccades: small steps on a long way. Vision Research. 2009;49:2415–2441. doi: 10.1016/j.visres.2009.08.010. [DOI] [PubMed] [Google Scholar]
- Schall JD. On the role of frontal eye field in guiding attention and saccades. Vision Research. 2004;44:1453–1467. doi: 10.1016/j.visres.2003.10.025. [DOI] [PubMed] [Google Scholar]
- Steinman RM, Haddad GM, Skavenski AA, Wyman D. Miniature eye movement. Science. 1973;181:810–819. doi: 10.1126/science.181.4102.810. [DOI] [PubMed] [Google Scholar]
- Theeuwes J, Olivers CN, Chizk CL. Remembering a location makes the eyes curve away. Psychological science. 2005;16:196–199. doi: 10.1111/j.0956-7976.2005.00803.x. [DOI] [PubMed] [Google Scholar]
- Vishwanath D, Kowler E. Localization of shapes: eye movements and perception compared. Vision Research. 2003;43:1637–1653. doi: 10.1016/s0042-6989(03)00168-8. [DOI] [PubMed] [Google Scholar]
- Vogel EK, Machizawa MG. Neural activity predicts individual differences in visual working memory capacity. Nature. 2004;428:748–751. doi: 10.1038/nature02447. [DOI] [PubMed] [Google Scholar]
- Vogel EK, McCollough AW, Machizawa MG. Neural measures reveal individual differences in controlling access to working memory. Nature. 2005;438:500–503. doi: 10.1038/nature04171. [DOI] [PubMed] [Google Scholar]
- Williams M, Pouget P, Boucher L, Woodman GF. Visual-spatial attention aids the maintenance of object representations in visual working memory. Memory & cognition. 2013;41:698–715. doi: 10.3758/s13421-013-0296-7. [DOI] [PMC free article] [PubMed] [Google Scholar]
- Yokoyama T, Noguchi Y, Kita S. Attentional shifts by gaze direction in voluntary orienting: evidence from a microsaccade study. Experimental brain research Experimentelle Hirnforschung Experimentation cerebrale. 2012;223:291–300. doi: 10.1007/s00221-012-3260-z. [DOI] [PMC free article] [PubMed] [Google Scholar]
- Yuval-Greenberg S, Tomer O, Keren AS, Nelken I, Deouell LY. Transient induced gamma-band response in EEG as a manifestation of miniature saccades. Neuron. 2008;58:429–441. doi: 10.1016/j.neuron.2008.03.027. [DOI] [PubMed] [Google Scholar]
- Zuber BL, Stark L, Cook G. Microsaccades and the velocity-amplitude relationship for saccadic eye movements. Science. 1965;150:1459–1460. doi: 10.1126/science.150.3702.1459. [DOI] [PubMed] [Google Scholar]