

Background: The relation between tumor-infiltrating macrophages and tumor cell migration/invasion toward blood vessels remained unclear.
Results: Macrophage induced the endothelin-integrin axis to stimulate breast cancer cell chemotaxis and adhesion toward endothelial cells and transendothelial migration.
Conclusion: Our data suggest how macrophages affect cancer cell interactions with endothelial cells.
Significance: The endothelin-integrin axis has a pivotal role in breast cancer microenvironment.
Keywords: Cell-Cell Interaction, Chemotaxis, Endothelin, Macrophages, Tumor Microenvironment
Abstract
Elevated macrophage infiltration in tumor tissues is associated with breast cancer metastasis. Cancer cell migration/invasion toward angiogenic microvasculature is a key step in metastatic spread. We therefore studied how macrophages stimulated breast cancer cell interactions with endothelial cells. Macrophages produced cytokines, such as interleukin-8 and tumor necrosis factor-α, to stimulate endothelin (ET) and ET receptor (ETR) expression in breast cancer cells and human umbilical vascular endothelial cells (HUVECs). ET-1 was induced to a greater extent from HUVECs than from breast cancer cells, resulting in a density difference that facilitated cancer cell chemotaxis toward HUVECs. Macrophages also stimulated breast cancer cell adhesion to HUVECs and transendothelial migration, which were repressed by ET-1 antibody or ETR inhibitors. The ET axis induced integrins, such as αV and β1, and their counterligands, such as intercellular adhesion molecule-2 and P-selectin, in breast cancer cells and HUVECs, and antibodies against these integrins efficiently suppressed macrophage-stimulated breast cancer cell interactions with HUVECs. ET-1 induced Ets-like kinase-1 (Elk-1), signal transducer and activator of transcription-3 (STAT-3), and nuclear factor-κB (NF-κB) phosphorylation in breast cancer cells. The use of inhibitors to prevent their phosphorylation or ectopic overexpression of dominant-negative IκBα perturbed ET-1-induced integrin αV and integrin β1 expression. The physical associations of these three transcriptional factors with the gene promoters of the two integrins were furthermore evidenced by a chromatin immunoprecipitation assay. Finally, our mouse orthotopic tumor model revealed an ET axis-mediated lung metastasis of macrophage-stimulated breast cancer cells, suggesting that the ET axis was involved in macrophage-enhanced breast cancer cell endothelial interactions.
Introduction
Solid tumors consist of not only malignant cells but also other types of cells, including fibroblasts, endothelial cells, and inflammatory cells, such as macrophages (1). The malignancy of many human cancers represented by breast cancer is correlated with elevated levels of macrophage infiltration (reviewed in Ref. 2). These tumor-infiltrating macrophages can act as an important promoter of tumor progression, most notably via paracrine interaction with tumor cells, to enhance tumor cell migration/invasion, tumor angiogenesis, and metastasis (3–7). In a solid tumor, the process of endothelial cell proliferation and directional migration toward the tumor tissue is called tumor angiogenesis, which is necessary for the support of solid tumor growth. Factors such as vascular endothelial growth factor (VEGF) and basic fibroblast growth factor are produced by the tumor tissue and function as chemotactic materials to attract and affect endothelial cells (2). On the other hand, tumor cell invasion and migration toward angiogenic microvasculature is thought to be a prerequisite step for cancer metastasis. The question of whether endothelial cells might produce some factors to induce tumor cell migration toward endothelial cells is intriguing. Moreover, macrophages have been known to produce angiogenic cytokines, such as interleukin (IL)-8, to enhance tumor cells to produce more IL-8 and other angiogenic factors (2, 6–8). It remains to be investigated whether macrophages can stimulate endothelial cells to express some factor(s) to attract tumor cells and in turn facilitate tumor metastasis.
Endothelins (ETs)2 are a group of peptide ligands predominantly produced by vascular endothelial and smooth muscle cells, and they were initially identified as the proteins involved in the vasoconstriction and vasodilatation of blood vessels (9, 10). ETs exert their vascular effects by binding to the cell surface ET receptors (ETRs) ETR-A and ETR-B, which belong to the G-protein-coupled receptor family. This complex of peptides, receptors, and signaling pathways is referred to as the ET axis (11). Currently, the ET axis is also associated with tumor angiogenesis by directly modulating endothelial cell proliferation, migration, invasion, protease production, and tube formation or by indirectly inducing hypoxia-inducible factor-1α-mediated VEGF production in cancer cells (12–16). Apart from functioning in vascular regulation, the ET axis has also been recognized to enhance the malignant progression of tumor cells. ET-1 stimulates neoplastic cell proliferation and spread (11, 17–20). It induces the mRNA expression, zymogen secretion, and proenzyme activation of two families of matrix-degrading proteinases, matrix metalloproteinases (MMPs) and the urokinase-type plasminogen activator system (14, 15). Additionally, various human cancer cells derived from mammary, pancreatic, and colon adenocarcinomas have been observed to produce significant amounts of ET (21). ETR antagonists can efficiently block ET-induced MMP-dependent cancer cell invasion, suggesting that the ET axis can be used as a therapeutic target.
Integrins are a family of cell membrane proteins, and thus far at least 18 α and 8 β subunits have been described to heterodimerize into 24 different integrin receptors responsible for cell-extracellular matrix (ECM) and cell-cell interactions (22, 23). Some integrins recognize the arginine-glycine-aspartate (RGD) sequence in their ECM ligands, such as fibronectin and vitronectin. Some other integrins recognize the isoleucine-glutamate-threonine (IET) or leucine-aspartate-valine (LDV) sites within their cellular counterligands/counterreceptors, including intercellular adhesion molecules (ICAMs) and vascular cell adhesion molecules (VCAMs). There is also a group of integrins that recognize not the linear amino acid sequences, but rather specific conformational sites, within collagen and laminin. On the other hand, some proteins bind to posttranslationally modified integrins. Selectins are a family of cell adhesion molecules that function as integrin ligands by recognizing the sialyl LewisX moiety of integrins (24). Upon ligand binding, integrin-elicited signaling pathways are not only involved in cell proliferation and survival (25, 26) but also induce cytoskeletal rearrangement, increase motile activity, and produce MMPs to elevate cell migration and invasion abilities (27, 28).
In this study, we investigated whether the ET axis was involved in macrophage-induced interactions of breast cancer cells with endothelial cells. Macrophage-conditioned medium (MφCM) was used to induce breast cancer cell chemotaxis and adhesion toward endothelial cells and transendothelial migration. ETs, ETRs, and integrins were also induced and involved in the interactions between breast cancer cells and endothelial cells. Our studies furthermore indicated that ET-1 induced integrin αV and integrin β1 mRNA expression through an Elk-1 (Ets-like kinase-1)-, STAT-3 (signal transducer and activator of transcription-3)-, and NF-κB (nuclear factor-κB)-mediated transcriptional activation mechanism. Finally, our mouse orthotopic tumor model revealed that the ET axis was indeed involved in MφCM-stimulated lung metastasis of breast cancer.
EXPERIMENTAL PROCEDURES
Reagents
The ETR inhibitors BQ-123 and BQ-788 were obtained from Calbiochem, EMD Millipore, Billerica, MA). Recombinant ET-1 was purchased from Chemicon Co. (Billerica, MA). The antibodies used in this study included those against ET-1 (Chemicon), ETR-A, ETR-B, FAK, IKKβ, glyceraldehyde 3-phosphate dehydrogenase (GAPDH), proliferating cell nuclear antigen, ERK, phosphorylated ERK, JNK, phosphorylated JNK, p38, phosphorylated p38 (Santa Cruz Biotechnology, Inc.), integrins αV, αM, αL, β1, and β2 (Ancell Co., Bayport, MN), NF-κB p65, IKKα, phosphorylated IKKα/β (Epitomics, Burlingame, CA), phosphorylated NF-κB p65, Elk-1, phosphorylated Elk-1 (Cell Signaling, Danvers, MA), integrin α5 (Biogenesis Ltd., Poole, UK), integrin β3 (Leinco Technologies, St. Louis, MO), phosphorylated FAK (Invitrogen), paxillin, STAT-3, phosphorylated STAT-3 (EMD Millipore), and cytokeratin 18 (Abcam, Cambridge, UK). Antibodies were diluted according to the suggestions of the respective manufacturers. IL-8 receptor-antagonizing antibody (IL-8RA) and soluble tumor necrosis factor-α (TNF-α) receptor (sTNFR) were purchased from R & D Systems (Minneapolis, MN).
Cell Cultures
Human breast cancer MCF-7 cells were cultivated in a 37 °C and 5% CO2 humidified incubator with modified Eagle's medium (MEM) supplemented with 10% fetal bovine serum (FBS), 2 mm l-glutamine, 100 units/ml penicillin, and 100 μg/ml streptomycin. Human breast cancer MDA-MB-231 cells and the human monocyte cell line THP-1 were cultivated in a 37 °C and 5% CO2 humidified incubator with RPMI medium containing 10% FBS, 100 units/ml penicillin, 100 μg/ml streptomycin, and 2 mm l-glutamine. These cell lines were authenticated by examining 15 tandem repeat markers (CSF1PO, D2S1338, D3S1358, D5S818, D7S820, D8S1179, D13S317, D16S539, D18S51, D19S433, D21S11, FGA, TH01, TPOX, and vWA) and the gender marker amelogenin using the AmpF/STR® Identifiler® PCR amplification kit (Applied Biosystems, Foster City, CA) and the American Type Culture Collection (Manassas, VA) fingerprint database. For suppressing NF-κB function, MCF-7 and MDA-MB-231 cells were transfected with pRc/CMV-IκB72 plasmid DNA to overexpress dominant negative IκBα (29).
Macrophage-conditioned Medium
For the preparation of macrophage-conditioned medium, THP-1 cells (2 × 10⁶ cells/10-cm plate) were induced to differentiate into macrophages by treating with 12-O-tetradecanoyl-13-phorbol acetate (100 ng/ml) for 16 h. Macrophages (1 × 10⁶ cells) were seeded onto a 10-cm plate containing 10 ml of MEM supplemented with 10% FBS, 100 units/ml penicillin, 100 μg/ml streptomycin, and 2 mm glutamine and incubated at 37 °C, 5% CO2. After 24 h, the medium (MφCM) was harvested and filtered through a 0.45-μm filter for the subsequent treatment of breast cancer cells and endothelial cells.
Human Umbilical Vein Endothelial Cells
Human umbilical cords from normal deliveries were collected; under sterile conditions, each cord was excised at 1 cm from both ends with a scalpel to expose the sterile surface. The umbilical vein was washed with phosphate-buffered saline (PBS) and then perfused with 0.2% collagenase in PBS until the vein was distended. The two ends of each cord were sealed with sterile clamps and incubated for 30 min at 37 °C. During the incubation, the cords were gently massaged to facilitate the detachment of human umbilical vein endothelial cells (HUVECs) from the vessel wall. The solution in the lumen was flushed out and harvested in a 15-cm culture dish, and the lumen of the vein was washed with M199 medium (Invitrogen) containing 100 units/ml penicillin and 100 μg/ml streptomycin. The cell suspension was collected in a 50-ml centrifuge tube and centrifuged at 1000 rpm for 5 min at 4 °C. The cell pellet was resuspended in M199 medium supplemented with 10% FBS, 100 units/ml penicillin, and 100 μg/ml streptomycin; seeded on a 10-cm culture dish; and incubated in a 37 °C incubator with 5% CO2. After overnight incubation, the medium was replaced with M199 medium supplemented with 20% FBS and 30 μg/ml endothelial cell growth supplement (Upstate Biotechnology Inc., Lake Placid, NY). The HUVECs were further subjected to subculture or storage in liquid nitrogen. HUVECs between the second and fifth passages were used for experiments.
Flow Cytometric Analysis
HUVECs or MCF-7 cells that were treated with MφCM in the absence or presence of 5 μg/ml anti-ET-1 antibody or 100 ng/ml of the ETR inhibitor BQ123, BQ788, or a mixture of both were trypsinized and centrifuged at 1000 rpm for 3 min. The cell pellets were resuspended in 500 μl of 1% paraformaldehyde for mild fixation for 5 min. After centrifugation, cell pellets were resuspended and permeabilized with 500 μl of 0.05% Triton X-100 for 5 min. The cells were then centrifuged and incubated for 1 h at room temperature with primary antibodies against ETR-A, ETR-B, and integrins αV, β1, β2, and β3, respectively. After being washed twice with PBS, the cells were added with fluorescein isothiocyanate-conjugated secondary antibody and incubated at room temperature for 1 h. The cells were then washed twice and resuspended in 0.5 ml of PBS for analysis by a FACSCalibur flow cytometer (BD Biosciences).
Determination of ET-1 Levels
The levels of ET-1 produced from MφCM-treated MCF-7 cells and HUVECs were analyzed using the human endothelin-1 enzyme immunometric assay kit (Assay Designs, Ann Arbor, MI). To each well of the plate, 100 μl of assay buffer and sample (or standard) solutions were added. After incubation overnight at 4 °C, excess sample was washed out with wash buffer. Horseradish peroxidase-conjugated anti-ET-1 monoclonal antibody was then added to each well. After incubation at 37 °C for 30 min, excess antibody was washed out, and 100 μl of substrate solution was subsequently added. After another incubation at room temperature for 30 min, the enzyme reaction was stopped by the addition of the stop solution provided with the kit. The optical density of the generated color was measured at 450 nm, which was directly proportional to the concentration of ET-1 in either the standards or the samples.
Determination of mRNA Expression Levels by RT-PCR
Cellular RNA was isolated using the TRIzol reagent (Invitrogen). Five micrograms of RNA was subjected to reverse transcription (RT) using SuperScript® II reverse transcriptase (Invitrogen) as described by the manufacturer. After the RT reaction, the cDNA was used as the template for subsequent PCRs. The sets of forward and reverse primers used and the corresponding PCR annealing temperatures and the lengths of PCR products are as follows: ETR-A (forward, 5′-GGC ATT TTC CCA GAT GTT TA-3′; reverse, 5′-TCA GAC TAT GCA CTT TGG CA-3′; 57 °C and 225 bp); ETR-B (forward, 5′-GGT GGT CTC TGT GGT TCT GG-3′; reverse, 5′-CTT CAA ATG ACT GGC ACC AGC-3′; 57 °C and 550 bp); ET-1 (forward, 5′-TGG GAT CAG AGC AGG AGC-3′; reverse, 5′-GTG TGG ACT TTG GAG TTT CTC C-3′; 57 °C and 337 bp); ET-2 (forward, 5′-TGG GCT ACA AAC CAG GAG CAA CCG TG-3′; reverse, 5′-ATA CAG ACA GGA AAA GCA GAG CAG GC-3′; 57 °C and 197 bp); GAPDH (forward, 5′-GAA GGT GAA GGT CGG AGT-3′; reverse, 5′-GAA GAT GGT GAT GGG ATT TC-3′; 52 °C and 220 bp); integrin αL (forward, 5′-ACC CAC CTT CAG CAT CTC CAC C-3′; reverse, 5′-GCC CTG GCG TCT AAC TGC TTT TG-3′; 52 °C and 140 bp); integrin αM (forward, 5′-ACA GAG CTG CCT CTC GGT GGC CA-3′; reverse, 5′-TTC CCT TCT GCC GGA GAG GCT ACG C-3′; 52 °C and 490 bp); integrin αV (forward, 5′-ATA GGG TGA CTT GTG TTT TTA GG-3′; reverse, 5′-AAA GAC ATG ATT GCT AAG GTC C-3′; 52 °C and 227 bp); integrin α4 (forward, 5′-AAA ACA GAC TCA GGT TGT AGT-3′; reverse, 5′-AGA AGT CAT TTC ACT AAG CTC-3′; 52 °C and 630 bp); integrin α5 (forward, 5′-CCT CCC AAT TTC AGA CTC CC-3′; reverse, 5′-ACA AGG GTC CTT CAC AGT GC-3′; 52 °C and 205 bp); integrin β1 (forward, 5′-TCC TAT TTT AAC ATT ACC AA-3′; reverse, 5′-ACT GTG ACT ATG GAA ATT GC-3′; 52 °C and 462 bp); integrin β2 (forward, 5′-GAG AAA GAT TCT GCT CTG A-3′; reverse, 5′-AGC CTG TAA TTG AAG TTT TAT-3′; 52 °C and 529 bp); integrin β3 (forward, 5′-GGC CTG TTC TTC TAT GGG TT-3′; reverse, 5′-GTG GGA GTG TCT GTA CCC TG-3′; 52 °C and 220 bp); integrin β5 (forward, 5′-CGA GCT TGG GAT AAA GCA AG-3′; reverse, 5′-TCA ACA GGC ATC TCA ACA GC-3′; 52 °C and 326 bp); ICAM-1 (forward, 5′-TAT GGC AAC GAC TCC TTC T-3′; reverse, 5′-CAT TCA GCG TCA CCT TGG-3′; 52 °C and 237 bp); ICAM-2 (forward, 5′-CAG GTG TTT GTA TTC GGG CT-3′; reverse, 5′-ACA CCA CGG TGG TCA CTG-3′; 52 °C and 126 bp); VCAM-1 (forward, 5′-CTG AGA GGC AGA CTT CCC TG-3′; reverse, 5′-AGA TGA CAA AGG TCA GCT GTC A-3′; 52 °C and 332 bp); PE-CAM (forward, 5′-AGC ACC ACC TCT CAC GTC A-3′; reverse, 5′-CTT GGA TGG CCT CTT TCT TG-3′; 52 °C and 250 bp); E-selectin (forward, 5′-CTC TGA CAG AAG AAG CCA AG-3′; reverse, 5′-ACT TGA GTC CAC TGA AGC-CA-3′; 52 °C and 254 bp); P-selectin (forward, 5′-GTG TCC TCT GTT ACT CAC AA-3′; reverse, 5′-CTT CAG TAC TCC TCC CTT AG-3′; 52 °C and 828 bp). The PCR mixture was first denatured at 94 °C for 5 min. The PCR was then performed at 94 °C for 1 min, annealing for 1 min, and 72 °C for 3 min for 30 cycles. Finally, the reactions were terminated by 72 °C for 7 min. The PCR products were visualized after agarose gel electrophoresis and ethidium bromide staining.
Cell Chemotaxis Assays
We set up three models for assaying cell chemotaxis. (i) Breast cancer cells were seeded at a density of 2 × 10⁶ cells/10-cm plate. After 16 h of incubation, the cells were treated with MφCM for 24 h. Half of the cells on the plate were swabbed out with a sterile cotton swab, and the remaining cells were treated as described below. HUVECs (3 × 10⁵) were seeded per well in a 6-well plate harboring a coverslip in each well. Subsequently, the HUVECs were treated with control medium or MφCM for 24 h. The coverslips with HUVECs were transferred and adhered onto the clear side of the above-mentioned MCF-7 cell plates. The whole sets were added with 10 ml of fresh MCF-7 culture medium in the absence or presence of 100 ng/ml BQ123 or BQ788 or 5 μg/ml anti-ET-1 antibody and incubated at 37 °C and 5% CO2 for 24 h. (ii) MCF-7 cells, seeded at a density of 2 × 10⁶ cells/10-cm plate, were treated with MφCM for 24 h. The right and left one-third of the cells on the plate were swabbed out with a sterile cotton swab, and the remaining cells were subjected to the following treatment. HUVECs were treated with MφCM for 24 h (designated as HUVECs*) and incubated for another 24 h with fresh MEM supplemented with 10% FBS, 2 mm l-glutamine, 100 units/ml penicillin, and 100 μg/ml streptomycin. The conditioned medium was collected and designated as HUVECs* CM. The dialysis tubings containing HUVECs* CM plus 5 μg/ml control immunoglobulin (IgG) or anti-ET-1 antibody were placed onto the left and right clear sides of the above-mentioned MCF-7 cell plates, respectively. The whole sets were incubated with 10 ml of fresh MCF-7 culture medium for 24 h. (iii) MCF-7 cells were treated as described in (ii), except that PBS and 100 ng/ml recombinant ET-1 protein were used instead in the dialysis tubings. After treatment under one of these three conditions, the chemotactic MCF-7 cells were photographed using a microscope (magnification ×100). In each plate, the numbers of chemotactic cells in three fields were counted and averaged.
Cell-Cell Adhesion Assay
MCF-7 or MDA-MB-231 cells were incubated for 24 h with control medium or MφCM in the absence or presence of 100 ng/ml ETR inhibitor(s) or 20 μg/ml anti-integrin antibody; after being washed with PBS, the cells were labeled with 7.5 μm carboxyfluorescein diacetate (CFDA; Invitrogen) at 37 °C for 20 min. Cells were allowed to recover in fresh culture medium for 30 min and then washed with PBS three times before trypsinization. The fluorescence-labeled MCF-7 or MDA-MB-231 cells (1 × 10⁵) were then seeded in each well of a 24-well plate that had been preseeded with HUVECs* (3 × 10⁵ cells/well). After incubation for 1 h, non-adherent cells were washed off twice using PBS. The adherent fluorescent cells were observed and counted under the Axiovert S100/AxioCam HR microscope system (Carl Zeiss, Oberkochen, Germany).
Transendothelial Migration Assay
HUVECs* (3 × 10⁵) were seeded on each Transwell insert (pore size, 8 μm; BD Biosciences) precoated with 50 μl of 1:3 diluted Matrigel (BD Biosciences). After a 6-h adhesion period, the HUVECs* were treated with 100 μl of 1% paraformaldehyde to decrease endothelial cell invasiveness but without changing their adhesion to cancer cells. MCF-7 or MDA-MB-231 cells (1 × 10⁶) that had been treated for 24 h with control medium or MφCM (in the absence or presence of BQ123, BQ788, or anti-integrin αV, αL, αM, α4, α5, β1, β2, β3, or β5 antibody) were labeled with CFDA and seeded onto the endothelial cell layer in each Transwell insert. Each Transwell insert was then placed into the well of a 24-well plate. The entire set-up was incubated with culture medium in a 37 °C and 5% CO2 humidified incubator. After 16 h, the cells together with the Matrigel in the Transwell insert were gently swabbed out using cotton swabs. The cells remaining on the lower side of the Transwell insert were observed and counted under the Axiovert S100/AxioCam HR microscope system.
Immunofluorescence
MCF-7 cells, seeded on coverslips at a density of 1 × 10⁵ cells/22 × 22 mm, were treated with MφCM for 24 h. The treated cells were then washed three times with PBS and fixed for 10 min at room temperature with 3.7% paraformaldehyde in PBS. The cells were washed three times with PBST (PBS + 0.05% Tween 20) and incubated with PBST plus 5% bovine serum albumin (BSA) for 1 h. The cells were further incubated for 12 h at 4 °C with primary antibody diluted in PBST plus 5% BSA. After being washed three times with PBST for 5 min each, the cells were treated with fluorochrome-conjugated secondary antibody diluted in PBST plus 5% BSA at room temperature in dark for another 1 h. For further actin-filament staining, cells were treated for 20 min with phalloidin-tetramethylrhodamine B isothiocyanate (phalloidin-TRITC, Molecular Probes, Inc., Grand Island, NY). For further nuclear staining, cells were incubated with 4′,6′-diamidino-2-phenylindole (DAPI; Molecular Probes). Finally, the fluorescence-labeled cells were mounted with ProLong antifade reagent (Invitrogen) and photographed using a TCS SP5 confocal microscope (Leica, Wetzlar, Germany).
Cell Migration and Invasion Assay
For assaying cell migration activity, time lapse photography was performed to monitor cell migration tracks. The monolayer of breast cancer cells was wound with a white tip, washed with PBS, and incubated at 37 °C for 24 h. Pictures of the cells migrating into the wounded area were taken every 10 min using a CCM-330F system (Astec Co., Fukuoka, Japan) and analyzed using Image-Pro Plus version 5.0.2 software (MediaCybernetics Inc., Silver Spring, MD). Additionally, a Transwell invasion assay was performed to evaluate cell invasion activity. MCF-7 or MDA-MB-231 cells were suspended in 0.5% FBS-containing culture medium and loaded into the top chambers of Transwell inserts precoated with 1:5 diluted Matrigel. Cells were allowed to invade through the Matrigel for 16 h toward the bottom chambers containing culture medium plus 10% FBS. The cells remaining on the lower side of the Transwell insert were fixed, stained with Giemsa, and quantified using the Image-Pro Plus software after photography.
Gelatinase Zymography
The levels of MMP-9 secreted by MCF-7 cells were evaluated by gelatinase zymography as described previously (30). MCF-7 cells were treated for 24 h with MφCM in the presence of control IgG or anti-integrin antibody, as indicated. After treatment, cells were incubated with fresh 0.5% FBS-containing medium for another 24 h. Medium samples were collected, filtered through a 0.45-μm filter, mixed with Laemmli SDS sample buffer (without β-mercaptoethanol), and resolved on 10% SDS-polyacrylamide gels containing 0.1% gelatin. The gels were washed four times with 50 mm Tris-Cl (pH 7.5) plus 2.5% Triton X-100, followed by rinsing four times with double-distilled H2O. The gels were then incubated at 37 °C for 16 h with buffer containing 50 mm Tris-Cl (pH 7.5), 200 mm NaCl, and 10 mm CaCl2. The gels were stained with 0.5% Coomassie Blue and then destained with 10% methanol plus 10% acetic acid until transparent bands were visible on the dark background. Finally, images were taken and quantified using the Alpha-InnoTech IS500 digital Imaging System (Avery Dennison, CA).
Preparation of Cell Protein Samples for Immunoblot Analysis
Total cell lysates and nuclear extracts were prepared as described previously (29, 31). Briefly, total cell lysates were prepared by lysing cells in buffer consisting of 10 mm Na2HPO4, 1.8 mm KH2PO4, pH 7.4, 137 mm NaCl, 2.7 mm KCl, 0.5% deoxycholate, 1% Nonidet P-40, 0.3% SDS, and 1 mm phenylmethylsulfonyl fluoride (31). Nuclear extracts were prepared according to the protocol provided in the NE-PERTM nuclear and cytoplasmic extraction reagents kit (Pierce) (29). Immunoblot analyses were performed according to the canonical procedure (31).
Chromatin Immunoprecipitation (ChIP) Assay
ChIP was performed according to the protocol provided in the Pierce ChIP kit (Thermo Scientific) using micrococcal nuclease to digest DNA. ET-1-treated MCF-7 and MDA-MB-231 cells were treated with 1% formaldehyde before cell lysis and DNA fragmentation. After preclearing by protein A/G-conjugated agarose, 10-μl aliquots of lysates were saved as “input” fractions, and the remaining lysates were immunoprecipitated with control IgG or anti-Elk-1, NF-κB, or STAT-3 antibody. DNA was extracted for PCR amplification of the following DNA fragments: the κB site-containing region (−1850 to −1682) of the integrin αV gene using the primers 5′-GAC GCT GGA CCG TAT CTC C-3′ and 5′-TCA GCG TAC TTC CGT GAG TG-3′; the κB site-containing region (−2178 to −1980) of the integrin β1 gene using the primers 5′-CAT GTT GTG GGT TCG AAA TG-3′ and 5′-TGC AGA GGT GTT AGG GAC AA-3′; the Elk site-containing region (−295 to −107) of the integrin αV gene using the primers 5′-TTC AGG CAG ATG CTA GAC CA-3′ and 5′-AGG CTC AGG AGT TCC AGG TT-3′; the Elk site-containing region (−448 to −254) of the integrin β1 gene using the primers 5′-AAC TGC CTG TCG CTT CAT CT-3′ and 5′-ACC TCG TGG ATC CTG AAA AA-3′; the STAT-3 site-containing region (−1548 to −1446) of the integrin αV gene using the primers 5′-GGC TAT GCT GGC TTT CTG GA-3′ and 5′-GCA GGC TCT CAC GAA CGA AA-3′; and the STAT-3 site-containing region (−1040 to −915) of the integrin β1 gene using the primers 5′-GGT AGG AAA TTG GGG TAG TTG-3′ and 5′-CAC CTC TCC CCC AAC AAA AA-3′. The condition for PCRs was as follows: 35 cycles of 94 °C for 30 s, 60 °C for 1 min, and 72 °C for 30 s.
Mouse Models
Two mouse models were set up in our research. In the first model, MCF-7 cells were transfected with pDsRed-Monomer-N1 plasmid DNA (Clontech), and a cell clone stably expressing red fluorescent protein was obtained after selection with neomycin. This clone of MCF-7 cells and HUVECs were pretreated with control medium or MφCM for 24 h. These cells were harvested in PBS, PBS plus control IgG, or PBS plus anti-ET-1 antibody (1.5 × 10⁶ cells in 50 μl for each injection) and then mixed with an equal volume of Matrigel for subcutaneous injections into NOD-SCID mice. The injection sites of treated HUVECs were 1 cm distant from those of treated MCF-7 cells. After 2 days, the sites of cell injections were observed using a live imaging instrument IVIS Imaging System 50 Series (PerkinElmer Life Sciences). In the second mouse model, MDA-MB-231 cells were pretreated for 24 h with control medium, MφCM, or MφCM plus PBS or 100 ng/ml BQ123. The cells were harvested in the fresh respective media (3.5 × 10⁶ cells in 50 μl for each injection), mixed with an equal volume of Matrigel, and then injected into the bases of the second left nipples of NOD-SCID mice. The growth of primary tumors was monitored externally every 3 days. Once one of the mice exhibited ∼2 cm in tumor diameter, all mice were sacrificed, and their axillary lymph node, lung, liver, pancreas, spleen, and kidney specimens were taken and investigated.
Statistical Analysis
All of the experiments were performed independently at least three times, and the data were expressed as mean ± S.D. The significance of the difference between data from the two groups was evaluated by Student's t test. p < 0.05 was considered significant.
RESULTS
MφCM Induces ET and ETR Expression in Breast Cancer Cells and HUVECs
We investigated whether macrophages affected the expression levels of ETs (ET-1 and ET-2) and ETRs (ETR-A and ETR-B) in HUVECs and MCF-7 cells. Cell surface levels of ETR-A and ETR-B were analyzed by flow cytometry. The results revealed that both ETR-A and ETR-B levels were significantly increased in MφCM-treated MCF-7 cells; however, only ETR-B was induced in HUVECs (Fig. 1A). The effect of MφCM on cellular ET-1 production was also investigated. MCF-7 cells and HUVECs were treated for 24 h with MφCM and incubated with fresh culture medium for another 24 h. The conditioned media were collected for the measurement of ET-1 concentrations. Although MφCM contained only background levels of ET-1, it significantly induced ET-1 levels in the collected conditioned media (Fig. 1B), suggesting that ET-1 secretion was significantly stimulated in both MCF-7 cells and HUVECs after MφCM treatment. It was noticed that the increased ET-1 level in HUVECs was greater than that in MCF-7 cells. MφCM also efficiently induced ET-1, ET-2, and ETR-B mRNA expression in MCF-7 cells and HUVECs (Fig. 1C). Consistent with the data in Fig. 1A, ETR-A mRNA was induced only in MCF-7 cells but not in HUVECs. We detected that MφCM contained a significant amount of IL-8 (1851.5 pg/ml), in addition to 29.5 pg/ml TNF-α and trace amounts of IL-6 (2.3 pg/ml) and IL-10 (3.5 pg/ml). To determine whether IL-8 and TNF-α were responsible for MφCM-induced ET and ETR expression in MCF-7 cells and HUVECs, we treated cells with MφCM in the presence of IL-8RA or sTNFR, which were able to antagonize IL-8 and TNF-α function, respectively. The results indicated that in both MCF-7 cells and HUVECs, the induction of ET and ETR expression by MφCM was drastically blocked by IL-8RA and sTNFR (Fig. 1D), suggesting that macrophages stimulated ET and ETR expression through the secretion of IL-8 and TNF-α. Besides MCF-7 cells, MφCM also induced ET-1, ET-2, ETR-A, and ETR-B mRNA expression in another breast cancer cell line, MDA-MB-231 (Fig. 1E).
FIGURE 1.

MφCM induces ET and ETR expression in HUVECs and breast cancer cells. A, flow cytometric analysis of cellular ETR-A and ETR-B protein levels in HUVECs and MCF-7 cells treated with control medium (CTRL) or MφCM for 24 h. B, determination of the ET-1 levels produced by HUVECs and MCF-7 cells after MφCM treatment. HUVECs or MCF-7 cells (3 × 10⁵) were treated with 2 ml of control medium or MφCM for 24 h and incubated with fresh culture medium for another 24 h. The conditioned media were harvested for ELISA. The data represent the mean ± S.D. (error bars) of three independent experiments. #, p < 0.05 compared with CTRL. C, RT-PCR analysis of the mRNA levels of ETR-A, ETR-B, ET-1, and ET-2 in HUVECs and MCF-7 cells treated with control medium or MφCM for 24 h. The levels of GAPDH mRNA were also detected as internal controls. D, RT-PCR analysis of the mRNA levels of ETR-A, ETR-B, ET-1, and ET-2 in HUVECs and MCF-7 cells treated for 24 h with control medium or MφCM plus 500 ng/ml control IgG, 500 ng/ml IL-8RA, or 100 ng/ml sTNFR (prepared in PBS). E, RT-PCR analysis of the mRNA levels of ETR-A, ETR-B, ET-1, and ET-2 in MDA-MB-231 cells treated with control medium or MφCM for 24 h. All of the data are the representative of at least three independent experiments.
The ET Axis Is Involved in the MφCM-induced Chemotaxis of MCF-7 Cells toward HUVECs
To study whether the MφCM-induced ET axis functioned in cancer cell interactions with endothelial cells, we first investigated whether the ET axis was involved in MφCM-induced chemotaxis of MCF-7 cells toward HUVECs. We set up a chemotaxis experiment model as depicted in Fig. 2A. MCF-7 cells, seeded at a density of 2 × 10⁶ cells per 10-cm dish, were treated for 24 h with MφCM. One half of the MφCM-treated MCF-7 cells from each dish were swabbed out and replaced with a coverslip with or without seeded HUVECs (1 × 10⁵) pretreated for 24 h with control medium or MφCM. The set-up was further incubated for 24 h with fresh culture medium in the absence or presence of anti-ET-1 antibody or the ET axis inhibitor BQ123 or BQ788. As shown in Fig. 2B, MCF-7 cells did not migrate toward the mock coverslip or the coverslip with HUVECs that were not pretreated with MφCM. However, if HUVECs were pretreated for 24 h with MφCM (designated as HUVECs*), MCF-7 cells obviously migrated toward HUVECs*. Furthermore, when BQ123, BQ788, or the anti-ET-1 antibody was present, the chemotactic migration of MCF-7 cells toward HUVECs* was significantly suppressed (Fig. 2, B and C), suggesting that the ET axis is involved in the MφCM-induced chemotaxis of MCF-7 cells toward endothelial cells. Because Fig. 1B shows that HUVECs and MCF-7 cells exhibited different ET-1 induction levels upon MφCM treatment, we performed the following experiments to confirm whether the ET-1 density difference between MCF-7 cells and HUVECs* was an inducer for the chemotaxis of MCF-7 cells toward endothelial cells. Both the right and left one-third of seeded MCF-7 cells from each 10-cm dish were swabbed out and replaced with the dialysis tubings containing HUVECs* CM plus control IgG and anti-ET-1 antibody, respectively (Fig. 3A). The pore size of the dialysis tubing allowed the passage of <30-kDa molecules, including ET-1, which induced the chemotactic migration of MCF-7 cells (Fig. 3, B and C). When anti-ET-1 antibody was present in the dialysis tubing, the chemotactic migration of MCF-7 cells was significantly prevented (Fig. 3, B and C). Additionally, PBS and recombinant ET-1 protein were used instead in the dialysis tubings (Fig. 4A). ET-1 exhibited an efficient ability to induce MCF-7 cell chemotactic migration (Fig. 4, B and C). These data together suggest that ET-1 is a macrophage-induced chemokine that causes breast cancer cells to migrate toward endothelial cells. The phenomenon that ET-1 was involved in MφCM-induced chemotaxis of MCF-7 cells toward endothelial cells could also be observed from the xenografts in a mouse model (Fig. 5).
FIGURE 2.
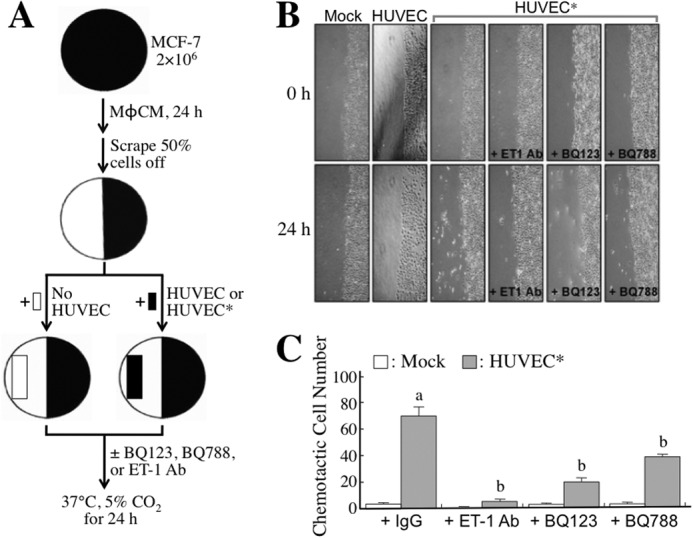
The ET axis is involved in the MφCM-induced chemotaxis of MCF-7 cells toward HUVECs (model 1). A, schematic experimental design. The detailed procedure is described under “Experimental Procedures.” B, representative photographs of chemotactic MCF-7 cells under different conditions. MCF-7 cells did not migrate toward the mock coverslip or the coverslip containing HUVECs without MφCM pretreatment. However, MCF-7 cells migrated significantly toward HUVECs pretreated with MφCM (designated as HUVECs*). This phenomenon was drastically abolished when 5 μg/ml anti-ET-1 antibody or 100 ng/ml ETR inhibitor BQ123 or BQ788 was present. Chemotactic MCF-7 cells were photographed with a microscope (×100). C, quantitative data from the chemotaxis assay. In each experiment, the numbers of chemotactic cells in three fields from each plate were counted and averaged. The data represent the mean ± S.D. (error bars) of three independent experiments. a, p < 0.05 compared with mock. b, p < 0.05 compared with control IgG or PBS.
FIGURE 3.
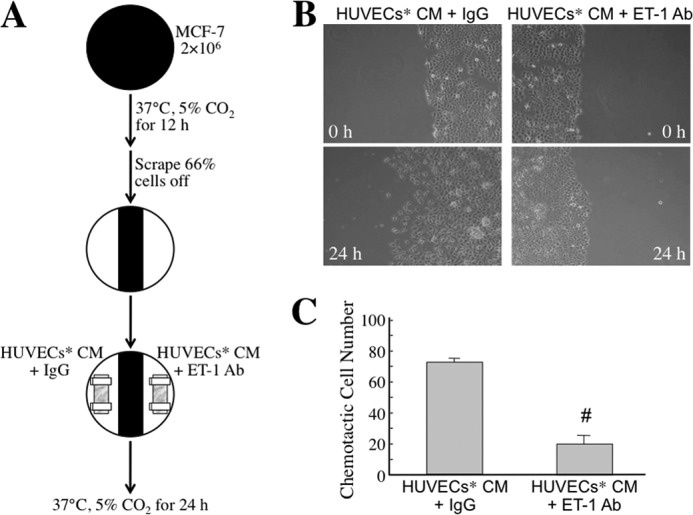
The ET axis is involved in the MφCM-induced chemotaxis of MCF-7 cells toward HUVECs (model 2). A, schematic experimental design. The detailed procedure is described under “Experimental Procedures.” B, representative photographs of chemotactic MCF-7 cells under different conditions. MCF-7 cells indeed migrated toward the dialysis tubing containing HUVECs* CM plus control IgG. However, MCF-7 cell migration toward HUVECs* CM was drastically suppressed if the anti-ET-1 antibody was present. Chemotactic MCF-7 cells were photographed with a microscope (magnification, ×100). C, quantitative data from the chemotaxis assay. In each experiment, the numbers of chemotactic cells in three fields from each plate were counted and averaged. The data represent the mean ± S.D. (error bars) of three independent experiments. #, p < 0.05 compared with HUVECs* CM plus control IgG.
FIGURE 4.
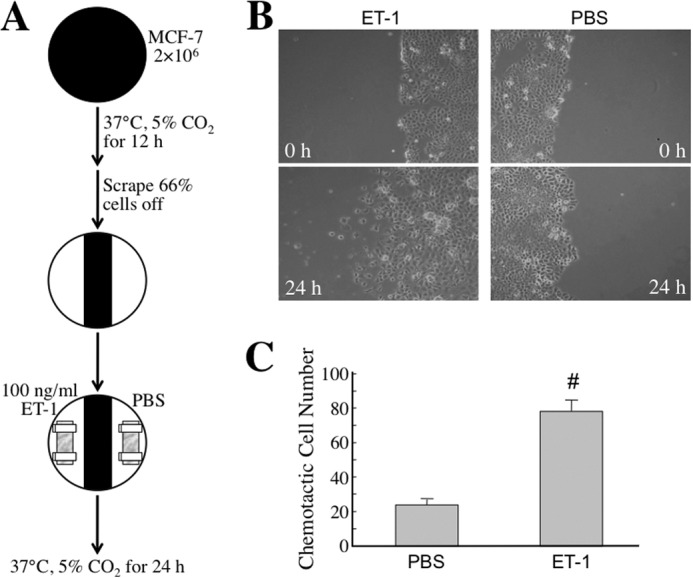
The ET axis is involved in the MφCM-induced chemotaxis of MCF-7 cells toward HUVECs (model 3). A, schematic experimental design. The detailed procedure is described under “Experimental Procedures.” B, representative photographs of chemotactic MCF-7 cells under different conditions. MCF-7 cells migrated toward the dialysis tubing containing ET-1 but not PBS. Chemotactic MCF-7 cells were photographed with a microscope (magnification, ×100). C, quantitative data from the chemotaxis assay. In each experiment, the numbers of chemotactic cells in three fields from each plate were counted and averaged. The data represent the mean ± S.D. (error bars) of three independent experiments. #, p < 0.05 compared with PBS.
FIGURE 5.

MφCM induces chemotactic migration of MCF-7 cells toward HUVECs in vivo. A, schematic experimental design. HUVECs and a MCF-7 cell clone stably expressing red fluorescent protein were treated with control medium or MφCM for 24 h (designated as HUVEC, HUVEC*, MCF-7, and MCF-7*, respectively). These cells were harvested in PBS, PBS plus control IgG, or PBS plus anti-ET-1 antibody, as indicated (1.5 × 10⁶ cells in 50 μl for each injection), mixed with an equal volume of Matrigel, and then injected subcutaneously into NOD-SCID mice. The injection sites of HUVEC/HUVEC* were 1 cm distant from those of MCF-7/MCF-7*. After 48 h, the sites were observed using an IVIS imaging system. B, representative photographs of chemotactic MCF-7/MCF-7* cells toward HUVEC/HUVEC*. C, quantitative data from the in vivo chemotactic migration assay. Each experiment was performed in triplicate. The data represent the mean ± S.D. (error bars) of three independent experiments. #, p < 0.05 compared with MCF-7-to-HUVEC. ▵, p < 0.05 compared with MCF-7*-to-HUVEC* + IgG.
The ET Axis Is Involved in MφCM-induced Adhesion and Transendothelial Migration of MCF-7 Cells
We furthermore investigated whether the ET axis was involved in MφCM-induced breast cancer cell adhesion onto endothelial cells. Confluent HUVECs* were cultivated on each well of a 24-well dish to provide a layer of “cell lawn” for seeding CFDA-labeled MCF-7 cells that were pretreated with control medium or MφCM with or without BQ-123 and/or BQ-788 (Fig. 6A). After 1 h of incubation, non-adherent cells were washed off, and the adherent fluorescent cells were counted. We found that MφCM induced better adhesion of MCF-7 cells onto HUVECs* (Fig. 6, B and C). This induction of MCF-7 cell adhesion could be inhibited by BQ123, BQ788, or a mixture of both. Consistent with this, the MCF-7-to-HUVEC* adhesion was found to be induced by the exogenous addition of recombinant ET-1 (Fig. 6C). These results clearly suggest that the ET axis was involved in the MφCM-induced adhesion of breast cancer cells to endothelial cells. Next, we investigated whether the ET axis was involved in MφCM-induced transendothelial migration of MCF-7 cells. The experimental model of transendothelial migration was established as depicted in Fig. 7A. The Transwell insert was pre-coated with Matrigel and seeded with confluent HUVECs*. After the HUVECs* completely attached, CFDA-labeled MCF-7 cells were seeded onto the layer of HUVECs*. After incubation for 16 h at 37 °C, fluorescent MCF-7 cells that had transmigrated to the lower side of the Transwell insert were counted. As shown in Fig. 7, B and C, MφCM induced the migration of a larger number of MCF-7 cells through the endothelial cell layer than did control medium. The level of MφCM-induced transendothelial migration of MCF-7 cells could also be inhibited by BQ123 and BQ788.
FIGURE 6.
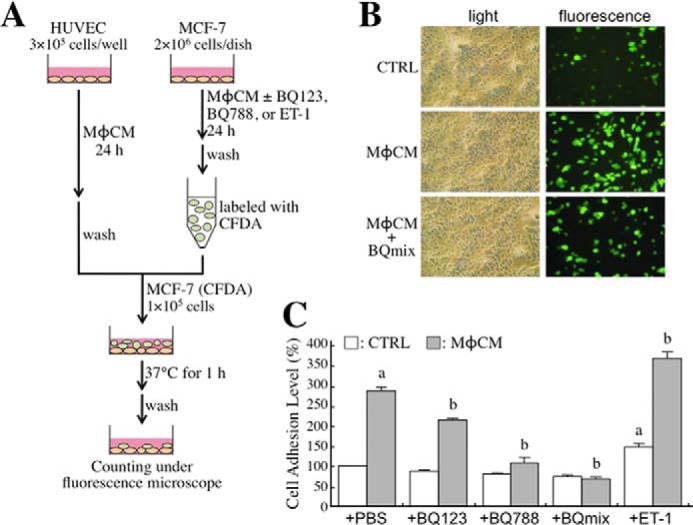
The ET axis is involved in the MφCM-induced adhesion of MCF-7 cells onto HUVECs*. A, schematic experimental design. The detailed procedure is described under “Experimental Procedures.” B, the representative photographs of adhesive MCF-7 cells under different experimental conditions (magnification, ×100). C, quantitative data from the adhesion assay. MφCM induced greater MCF-7 cell adhesion onto HUVECs*; this could be inhibited by 100 ng/ml BQ123, BQ788, or a mixture of both. Consistently, MφCM-induced MCF-7-to-HUVEC* adhesion was enhanced by the exogenous addition of 100 ng/ml recombinant ET-1 protein. The data represent the mean ± S.D. (error bars) of at least three independent experiments. a, p < 0.05 compared with CTRL plus PBS. b, p < 0.05 compared with MφCM plus PBS.
FIGURE 7.

The ET axis is involved in the MφCM-induced transendothelial migration of MCF-7 cells. A, schematic experimental design. The detailed procedure is described under “Experimental Procedures.” B, representative photographs of MCF-7 cells that had migrated through the endothelial cell layer under different experimental conditions (magnification, ×100). C, quantitative data from the transendothelial migration assay. It was observed that MφCM induced more MCF-7 cells to pass through the endothelial cell layer. This phenomenon could be inhibited by 100 ng/ml BQ123 or BQ788. The data represent the mean ± S.D. (error bars) of three independent experiments. a, p < 0.05 compared with control medium (CTRL) plus PBS. b, p < 0.05 compared with MφCM plus PBS.
The ET Axis Is Involved in the MφCM-induced Cellular Expression of Integrins
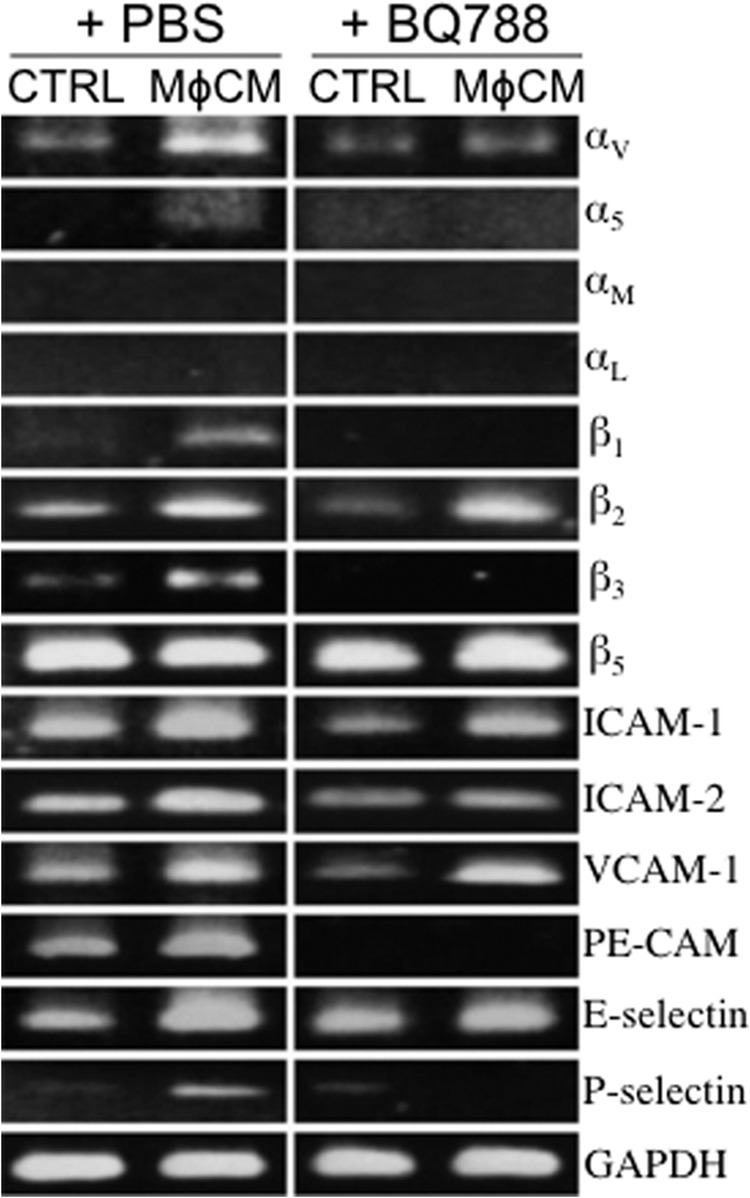
Integrins are a family of cell membrane proteins responsible for cell-to-ECM and cell-to-cell interactions. We investigated if MφCM affected the cellular expression of integrins, such as αV, α4, α5, αL, αM, β1, β2, β3, and β5. The mRNA levels of integrins αV, α5, αM, β1, β2, and β3 were significantly induced when MCF-7 cells were stimulated with MφCM (Fig. 8A). The induction of mRNA levels of integrins αV, αM, β1, β2, and β3 in MCF-7 cells was inhibited when the anti-ET-1 antibody was present in the MφCM. The mRNA levels of the counterligands of integrins, including ICAM-1, ICAM-2, VCAM-1, PE-CAM, E-selectin, and P-selectin, were also investigated. MCF-7 cells exhibited higher mRNA levels of ICAM-1, ICAM-2, VCAM-1, E-selectin, and P-selectin in response to MφCM stimulation (Fig. 8A). Consistent with the mRNA induction, increased cell surface protein levels of integrins αV, β1, β2, and β3 were detected in MφCM-treated MCF-7 cells by flow cytometry; this could be inhibited by BQ123, BQ788, or a mixture of both (Fig. 8B). Because integrins exert their biological functions by forming heterodimeric complexes between α-type and β-type integrins, we did indeed observe co-localization of the MφCM-induced integrins αV and β1 in MCF-7 cells after immunofluorescent staining (Fig. 8C). On the other hand, increases in the mRNA levels of integrins αV, α5, β1, β2, and β3 were easily detected in MφCM-treated HUVECs (Fig. 9). The increases in the mRNA levels of integrins αV, α5, β1, and β3 could be blocked by BQ788. The levels of ICAM-1, ICAM-2, VCAM-1, PE-CAM, E-selectin, and P-selectin mRNA were all elevated in MφCM-treated HUVECs (Fig. 9).
FIGURE 8.

The ET axis is involved in the MφCM-induced expression of integrins and their counterligands in MCF-7 cells. A, RT-PCR analysis of the mRNA levels of integrins αV, α4, α5, αM, β1, β2, β3, and β5, and the counterligands ICAM-1, ICAM-2, VCAM-1, PE-CAM, E-selectin, and P-selectin in MCF-7 cells treated for 24 h with control medium (CTRL) or MφCM in the absence or presence of anti-ET-1 antibody. Representative data from at least three independent experiments are shown. B, flow cytometric analysis of the levels of cell surface integrins αV, β1, β2, and β3 in MCF-7 cells treated for 24 h with control medium or MφCM in the absence or presence of BQ123, BQ788, or mix of both. Representative data from three independent experiments are shown. C, immunofluorescent staining of integrin αV and integrin β1 in MCF-7 cells treated with control medium or MφCM for 24 h. The cells were further stained for F-actin with phalloidin-TRITC and for nuclei with DAPI. Finally, the fluorescence-labeled cells were photographed with a TSC SP5 confocal microscope (Leica), and the images were analyzed by LASAF software (Leica).
FIGURE 9.
The ET axis is involved in the MφCM-induced expression of integrins and their counterligands in HUVECs. Shown is RT-PCR analysis of the mRNA levels of integrins αV, α5, αM, αL, β1, β2, β3, and β5 and the counterligands ICAM-1, ICAM-2, VCAM-1, PE-CAM, E-selectin, and P-selectin in HUVECs treated for 24 h with control medium (CTRL) or MφCM in the absence or presence of 100 ng/ml BQ788. Representative data from at least three independent experiments are shown.
Integrins Are Involved in the MφCM-induced Transendothelial Migration of Breast Cancer Cells
To further identify whether ET axis-induced integrins contributed to the MφCM-induced aggressiveness of MCF-7 cells, we included antagonizing antibodies against integrins αV, β1, and others in the following experiments. First, we examined if the overexpressed integrins were involved in MφCM-induced MCF-7 cell migration. Time lapse photography was performed to monitor MCF-7 cell migration during a 24-h MφCM-treatment course. The movement tracks and quantified data are shown in Fig. 10, A and B. MCF-7 cell migration was significantly enhanced by MφCM treatment, which could be drastically blocked by the antibody against integrin αV or β1. A Transwell invasion assay was also performed to study the involvement of integrins in MφCM-induced MCF-7 cell invasiveness. The data clearly show that MφCM-induced MCF-7 cell invasion could be inhibited to different extents by antibodies against integrins αV, αM, αL, β1, β2, and β3, respectively (Fig. 10C). Finally, we investigated the involvement of integrins in the MφCM-induced transendothelial migration of MCF-7 cells. The results suggest that all of the tested integrins (αV, αM, α5, β1, β2, and β3) were involved in the induction of MCF-7 cell transendothelial migration by MφCM (Fig. 10D). When cell surface integrins bind with their counterligands from ECM or other cells, FAK is recruited, phosphorylated, and activated at cell membrane sites, including focal adhesions and podosomes. Paxillin is one of the proteins that is subsequently recruited and conveys the signaling from the cell membrane to the actin cytoskeleton. By immunofluorescent staining, we observed that integrin αV was indeed co-localized with phosphorylated (activated) FAK (Fig. 11A), and phosphorylated FAK was moreover co-localized with paxillin (Fig. 11B) in MφCM-treated MCF-7 cells, suggesting that MφCM induced an integrin-FAK-paxillin-F-actin cascade leading to MCF-7 cell migration. MMP-9, inducible by ET-1, can be used to promote cancer cell invasion and transendothelial migration levels. By gelatinase zymography, we observed that the MφCM-induced MMP-9 level was inhibited to different extents by antibodies antagonizing integrins αV, αM, α5, β1, β2, and β3, respectively (Fig. 11C). Besides MCF-7 cells, MφCM also induced the ET axis-mediated expression of integrins αV and β1 in MDA-MB-231 cells (Fig. 12A). Furthermore, BQ123, BQ788, and integrin αV and integrin β1 antibodies could be used to repress MφCM-induced MDA-MB-231 cell invasion (Fig. 12B), adhesion on endothelial cells (Fig. 12C), and transendothelial migration (Fig. 12D).
FIGURE 10.

The ET axis-mediated integrin expression is involved in MφCM-induced MCF-7 cell migration, invasion, and transendothelial migration. A, MφCM-induced MCF-7 cell migration was blocked by the antibodies against integrins αV and β1. MCF-7 cells were treated with control medium (CTRL) or MφCM in the presence of 20 μg/ml anti-integrin αV or integrin β1 antibody, and their migration tracks were monitored for 24 h by time lapse photography. Twenty cells in each treatment group were randomly selected, and their migration tracks were depicted by Image-Pro Plus software. The results shown are representative of three independent experiments. B, the accumulated distances of the migration tracks shown in A were quantified by Image-Pro Plus software and expressed as mean ± S.D. (error bars). #, p < 0.05 compared with control. *, p < 0.05 compared with MφCM plus IgG. C, MφCM-induced MCF-7 cell invasion was blocked to different extents by antibodies against integrins αV, αM, αL, β1, β2, and β3. MCF-7 cells were treated with control medium or MφCM in the presence of 20 μg/ml antagonizing antibody against integrin αV, αM, αL, β1, β2, or β3. After 24 h, the treated cells were allowed to invade through Matrigel for another 16 h. Invasive MCF-7 cells were counted using Image-Pro Plus software from the lower sides of the Transwell inserts. The mean ± S.D. values of three independent experiments are shown. #, p < 0.05 compared with control. *, p < 0.05 compared with MφCM plus IgG. D, MφCM-induced transendothelial migration of MCF-7 cells was blocked to different extents by antibodies against integrins αV, α5, αM, β1, β2, and β3. The data represent the mean ± S.D. of three independent experiments. #, p < 0.05 compared with control. *, p < 0.05 compared with MφCM plus IgG.
FIGURE 11.
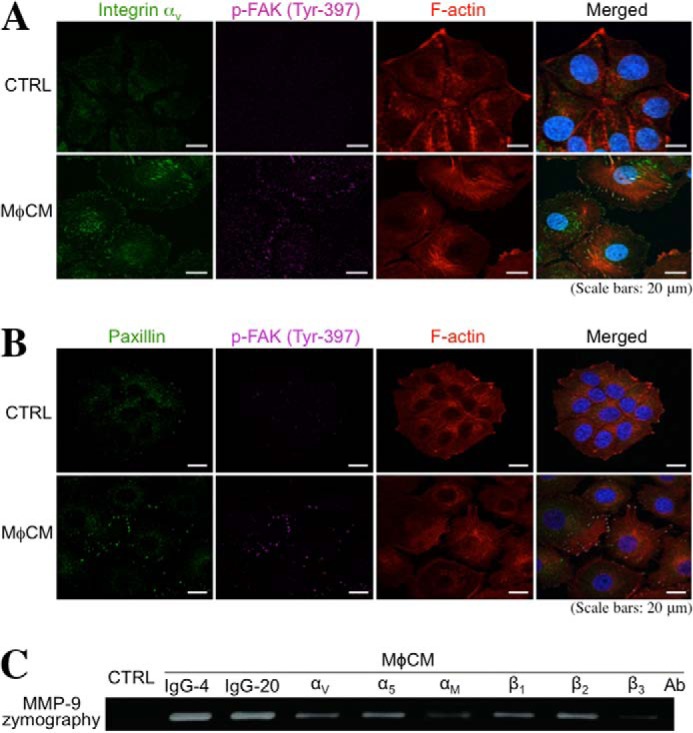
MφCM induces integrin-FAK-paxillin and integrin-MMP-9 pathways in MCF-7 cells. A, immunofluorescent staining of integrin αV and phosphorylated FAK in MCF-7 cells treated with control medium (CTRL) or MφCM for 24 h. The cells were further stained for F-actin with phalloidin-TRITC and for nuclei with DAPI. Induction of integrin αV and phosphorylated FAK levels and their colocalization were observed in MφCM-treated MCF-7 cells with a TSC SP5 confocal microscope. B, immunofluorescent staining of paxillin and phosphorylated FAK in MCF-7 cells treated with control medium or MφCM for 24 h. The cells were further stained for F-actin with phalloidin-TRITC and for nuclei with DAPI. Induction of paxillin and phosphorylated FAK colocalization was observed in MφCM-treated MCF-7 cells with a TSC SP5 confocal microscope. C, MφCM-induced MMP-9 production from MCF-7 cells was blocked to different extents by antibodies against integrins αV, α5, αM, β1, β2, and β3. MCF-7 cells were treated for 24 h with control medium or MφCM in the presence of 4 or 20 μg/ml control IgG or 20 μg/ml of the antibodies against integrins αV, α5, αM, β1, β2, and β3, respectively. Cells were then incubated with fresh 0.5% FCS-containing MEM for another 24 h. The media were collected for MMP-9 zymography. The data are representative of at least three independent experiments.
FIGURE 12.
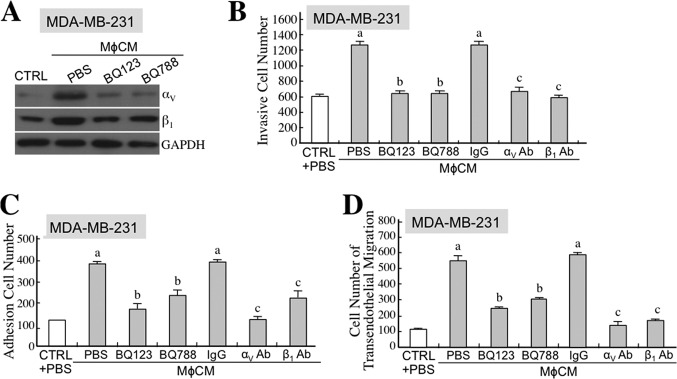
The ET axis-mediated expression of integrins αV and β1 is involved in MφCM-induced MDA-MB-231 cell interactions with endothelial cells. A, the ET axis is involved in the MφCM-induced expression of integrins αV and β1 in MDA-MB-231 cells. Immunoblot analysis of the levels of integrins αV and β1 in MDA-MB-231 cells treated for 24 h with control medium (CTRL) or MφCM in the presence of BQ123 or BQ788. GAPDH levels were also detected as internal controls. Representative data from three independent experiments are shown. B, MDA-MB-231 cell invasion induced by MφCM was blocked by BQ123, BQ788, and antibodies against integrins αV and β1. The data represent the mean ± S.D. (error bars) of three independent experiments. a, p < 0.05 compared with CTRL plus PBS. b, p < 0.05 compared with MφCM plus PBS. c, p < 0.05 compared with MφCM plus control IgG. C, MφCM-induced MDA-MB-231 cell adhesion on endothelial cells was blocked by BQ123, BQ788, and antibodies against integrins αV and β1. The data represent the mean ± S.D. of three independent experiments. a, p < 0.05 compared with CTRL plus PBS. b, p < 0.05 compared with MφCM plus PBS. c, p < 0.05 compared with MφCM plus control IgG. D, the MφCM-induced transendothelial migration of MDA-MB-231 cells was blocked by BQ123, BQ788, and antibodies against integrins αV and β1. The data represent the mean ± S.D. of three independent experiments. a, p < 0.05 compared with control medium plus PBS. b, p < 0.05 compared with MφCM plus PBS. c, p < 0.05 compared with MφCM plus control IgG.
ET-1 Induces Integrins αV and β1 via an Elk-1-, NF-κB-, and STAT-3-dependent Mechanism
We explored which signaling pathways were elicited by ET-1 to induce integrin αV and integrin β1 expression. Like MφCM, recombinant ET-1 protein increased the mRNA and protein expression of integrin αV and integrin β1 in MCF-7 and MDA-MB-231 cells (Fig. 13A). The phosphorylated (active) levels of ERK and IKKα/β and their respective downstream transcription factors Elk-1 and NF-κB were also induced by ET-1 in both cell lines (Fig. 13A). Inhibitors that efficiently blocked ERK and IKKα/β phosphorylation prevented ET-1-induced Elk-1 and NF-κB phosphorylation and the expression of integrins αV and β1 (Fig. 13B). Ectopic overexpression of dominant negative IκBα, which diminished the ET-1-induced nuclear NF-κB level, also inhibited ET-1-induced integrin αV and integrin β1 expression (Fig. 13C). These data together suggest that the ERK-Elk-1 and IKK-NF-κB pathways were responsible for ET-1-induced integrin αV and integrin β1 expression. In addition to Elk-1 and NF-κB, STAT-3 phosphorylation was also induced by ET-1 (Fig. 13A), and the STAT-3 phosphorylation inhibitor JSI-124 could suppress the ET-1-induced expression of integrin αV and integrin β1 (Fig. 13B). Putative sites for Elk-1, NF-κB, and STAT-3 binding were recognized in the promoter regions of the integrin αV and integrin β1 genes. The physical association of Elk-1, NF-κB, and STAT-3 with the promoter regions of integrin αV and integrin β1 genes was furthermore evidenced by chromatin immunoprecipitation assay (Fig. 13D). These data together suggest that ET-1 induced the mRNA expression of integrins αV and β1 through an Elk-1-, NF-κB-, and STAT-3-mediated transcriptional activation mechanism.
FIGURE 13.

ET-1 induced the mRNA expression of integrins αV and β1 through an Elk-1-, STAT-3-, and NF-κB-dependent transactivation mechanism. A, RT-PCR and immunoblot analyses were performed to demonstrate that both mRNA and protein levels of integrins αV and β1 were induced in MCF-7 and MDA-MB-231 cells after treatment with 100 ng/ml ET-1 for 24 h. Increases in ERK, IKKα/β, Elk-1, NF-κB, and STAT-3 phosphorylation were also demonstrated by immunoblot analyses. B, the involvement of ERK, Elk-1, IKKα/β, NF-κB, and STAT-3 in the ET-1-induced expression of integrins αV and β1. MCF-7 and MDA-MB-231 cells were treated for 24 h with ET-1 in the presence of the inhibitor against MEKK (PD98059; 5 μm), JNK (SP600125; 5 μm), p38MAPK (SB202190; 5 μm), IKKα/β (6-amino-4-(4-phenoxyphenylethylamino) quinazoline; 0.1 μm), or STAT-3 (JSI-124; 10 μm). The activities of these proteins were effectively inhibited by the respective inhibitors, as demonstrated by decreases in the phosphorylation levels of these proteins or their downstream targets. However, only the inhibitors of MEKK, IKK, and STAT-3 drastically suppressed the ET-1-induced expression of integrins αV and β1, suggesting that the action of ET-1 was via a MEKK-ERK-Elk-1-, IKKα/β-NF-κB-, and STAT-3-dependent manner. C, NF-κB is involved in the ET-1-induced expression of integrins αV and β1. MCF-7 and MDA-MB-231 cells were transfected for 48 h with control vector or dominant negative IκBα-overexpressing plasmids. Transfected cells were further treated with PBS or ET-1 for another 24 h. Nuclear and total cell extracts were prepared for immunoblot analyses of the levels of NF-κB and integrins αV and β1, respectively. The results reveal that overexpression of dominant negative IκBα was efficient in suppressing the ET-1-induced level of nuclear NF-κB and also drastically inhibited the ET-1-induced expression of integrins αV and β1. The levels of proliferating cell nuclear antigen (PCNA) were used as internal controls. D, a ChIP assay was performed to reveal physical associations of NF-κB, Elk-1, and STAT-3 with the promoters of the genes encoding integrins αV and β1 in MCF-7 and MDA-MB-231 cells treated with 100 ng/ml ET-1 for 24 h. All of the data are representative of three independent experiments.
The ET Axis Is Involved in MφCM-stimulated Breast Cancer Metastasis
Finally, we set up an orthotopic tumor model to investigate whether or not the ET axis is involved in macrophage-stimulated breast cancer metastasis. In a preliminary experiment, MDA-MB-231 cells pretreated with control medium or MφCM rapidly proliferated and formed primary tumors in NOD-SCID mice (Fig. 14A). However, MφCM-pretreated MDA-MB-231 cells exhibited a higher activity to metastasize to lung when compared with the cells pretreated with control medium (Fig. 14B). Furthermore, MDA-MB-231 cells were pretreated with MφCM plus PBS or 100 ng/ml BQ123. Their growth of primary tumors was significantly retarded by the presence of BQ123 (Fig. 14C). The formation of tumor nodules on lungs was also prevented in the five mice injected with MDA-MB-231 cells pretreated with MφCM plus BQ123 (Fig. 14D). The tissue sections of the tumor nodules were positively staining with the antibody specific for human but not mouse cytokeratin 18 (CK18), confirming that the tumor nodules were indeed derived from inoculated MDA-MB-231 cells (Fig. 14E).
FIGURE 14.

The ET axis is involved in MφCM-stimulated MDA-MB-231 cell metastasis. A, image of the primary tumors from the NOD-SCID mice inoculated with the MDA-MB-231 cells pretreated with control medium (CTRL) or MφCM for 24 h. The primary tumors were taken from the sacrificed mice 40 days postinoculation. The data for tumor volume represent the mean ± S.D. of the five tumors produced in five NOD-SCID mice. B, representative image of the lungs from the NOD-SCID mice inoculated with the MDA-MB-231 cells pretreated with control medium or MφCM for 24 h. It was noticed that MφCM-treated MDA-MB-231 cells developed more tumor nodules on the lungs when compared with MDA-MB-231 cells treated with control medium. C, image of the primary tumors from the NOD-SCID mice inoculated with the MDA-MB-231 cells pretreated for 24 h with MφCM plus PBS or 100 ng/ml BQ123. The primary tumors were taken from the sacrificed mice 28 days postinoculation. The data for tumor volume represent the mean ± S.D. of the five tumors produced in five NOD-SCID mice. D, representative image of the lungs from the NOD-SCID mice inoculated with the MDA-MB-231 cells pretreated with MφCM plus PBS or BQ123. Development of tumor nodules on the lungs was drastically prevented in the five mice injected with the MDA-MB-231 cells pretreated with MφCM in the presence of BQ123. E, representative images of the mouse lung tissue sections staining with hematoxylin/eosin (H/E) dye or the antibody specific for human cytokeratin 18 (CK18; Abcam catalog no. AB32118) to confirm that the tumor nodules were indeed derived from MDA-MB-231 cells.
DISCUSSION
A naturally occurring solid tumor tissue is composed of an amalgamation of cancer cells and other cell types, such as fibroblasts, endothelial cells, and macrophages. It is widely accepted that the initiation and progression of tumors result from an accumulation of somatic mutations in epithelial cells. However, accumulating studies have revealed that stromal fibroblasts and macrophages have a profound influence on the development and progression of cancer cells (32–35). Clinically, the correlation of macrophages with angiogenesis and poor prognosis was first reported in breast cancer (36). It is now known that macrophages are associated with poorer clinical outcomes in more than 10 cancer types, including breast, bladder, prostate, uterine, lung, liver, and brain cancers (2). Although a higher level of macrophage infiltration in tumor tissue is associated with increased metastatic potential, the underlying mechanism for this observation is still not fully understood. Some studies have indicated that paracrine signaling networks between macrophages and tumor cells can enhance tumor cell migration and invasion and tumor angiogenesis (3, 4, 6). Although tumor cell invasion and migration toward angiogenic microvasculature is a key step in the metastatic spread of tumor cells, mechanistic details about this step are still lacking. In this study, we provide evidence demonstrating that MφCM induced cancer cells to move toward and adhere to endothelial cells and process transendothelial migration, suggesting that the factors released from macrophages can facilitate cancer cell interactions with endothelial cells. It has been suggested that myeloid-derived cells are important in the inflammation microenvironment to provide favorable conditions for cancer cell metastasis (37, 38). Macrophages are one of these cells and function as a major source of inflammatory cytokines. Our data showing that MφCM-induced ET and ETR expression can be abolished by IL-8RA and sTNFR (Fig. 1) suggest that macrophages induce the ET axis in endothelial and breast cancer cells through IL-8 and TNF-α secretion. IL-8 and TNF-α can promote tumor angiogenesis and metastasis (2, 39, 40). Possible mechanisms include the stimulation of cancer and endothelial cells to express matrix-degrading proteases and other cytokines. The results of our study indicate that IL-8 and TNF-α can affect the interactions between breast cancer cells and endothelial cells through the induction of the ET axis in both cells.
Metastasis is a phenomenon by which tumor cells travel to other tissue(s)/organ(s) through the circulation via intravasation and extravasation. Briefly, there are three steps for cancer cells to achieve intravasation. First, tumor cells become invasive and migrate away from the primary tumor mass, moving toward angiogenic microvasculatures. Second, invasive cells adhere onto endothelial cells. The third step is the translocation of the tumor cells into the lumen, referred as transendothelial migration. Once they enter the vasculature, tumor cells must escape from immunosurveillance and survive in ECM-free circulating conditions so as to move to secondary sites, where extravasation occurs. The mechanism of tumor cell extravasation has been compared to the exit of leukocytes from the circulation and is said to occur via three steps: rolling of the cells on the luminal endothelial surface, firm attachment of the tumor cells to the endothelium, and transendothelial migration and extravasation into the surrounding tissue (41). At a favorable site, proliferation of the cells results in the formation of a metastatic tumor. Both intravasation and extravasation processes require specific interactions between adhesion receptors present on vascular endothelial cells and their counterligands present on cancer cells, and vice versa (42). These adhesive interactions induce forward signaling in endothelial cells, which causes loss of cellular junctions and passive retraction of endothelial cells to increase transendothelial permeability, and reverse signaling in cancer cells to increase their migration and invasive abilities, such as rearrangement of the cytoskeleton, increase of motile potential, and activation of matrix-degrading proteinases (43–46). In this study, we set up experimental models and observed that macrophages induced cancer cell chemotaxis and adhesion toward endothelial cells and transendothelial migration. These results implied that macrophages could facilitate breast cancer metastasis by enhancing the intravasation ability of breast cancer cells. Furthermore, our results demonstrate that the ET-integrin axis was induced and involved in these processes.
ETs were originally found to be associated with the regulation of vasoconstriction and vasodilatation of blood vessels (9, 10). The ET axis has also been known to play an important regulatory role in tumor angiogenesis (12–16). The ET axis modulates various stages of neovascularization, including endothelial cell proliferation, migration, invasion, protease production, and tube formation. In addition to functioning in vascular regulation, the ET axis has been shown to stimulate the proliferation and survival of various types of cancer cells (17–20). An ETR-A antagonist is able to block the ET-1-induced MMP-dependent invasion of ovarian carcinoma cells (14, 15). Additionally, ET-1 has been reported to enhance neutrophil adhesion to human coronary artery endothelial cells through ETR-A activation (47). It has also been reported that tumor cells can be chemotactically attracted to endothelial capillaries (48). Therefore, we propose that ET-1 production by endothelial cells could be increased in order to attract tumor cells. It is well known that monocyte chemotactic proteins 1, 2, and 3 (MCP-1 to -3) are produced by tumor tissues to recruit macrophages from peripheral vessels, and VEGF and basic fibroblast growth factor are also released from tumor tissues to stimulate neovascularization toward tumor tissues (2). In our study, ET-1 levels in MCF-7 cells were increased after MφCM treatment. However, ET-1 levels in HUVECs after MφCM treatment were even higher than those in macrophage-affected MCF-7 cells. The resultant ET-1 density difference between MCF-7 cells and HUVECs caused the chemotactic migration of MCF-7 cells toward HUVECs. Antagonists of the ET axis, such as the ET-1 antibody, BQ123, and BQ788, could be used to block this chemotaxis of breast cancer cells, confirming that ET-1 functioned as a chemoattractant for breast cancer cells toward the microvasculature during metastasis.
Besides ETs, MφCM also induced the expression of ETR-B in HUVECs and of ETR-A and ETR-B in breast cancer cells. Interactions between ETs and ETRs should induce some signaling pathways and downstream gene expression for the interactions between breast cancer cells and HUVECs. Indeed, our data indicated that the MφCM-induced ET axis turned on the expression of integrins αV, αM, β1, β2, and β3 and their counterligands ICAM-2, VCAM-1, and P-selectin in MCF-7 cells and the expression of integrins αV, α5, β1, and β3 and the counterligands ICAM-1, ICAM-2, VCAM-1, PE-CAM, E-selectin, and P-selectin in HUVECs. The expression of these adhesion molecules could account for macrophage-induced cancer cell adhesion onto endothelial cells and further transendothelial migration (Figs. 10–12). The interactions of integrins with their counterligands could elicit several signaling pathways not only for cell proliferation and survival (25, 26) but also for cytoskeleton rearrangement and MMP production, which result in an increase in cancer cell migration and invasion (27, 28) and the loss of cellular junctions and thus the passive retraction of endothelial cells for increase in transendothelial permeability (49, 50). In this study, we indeed observed that MφCM induced an integrin-FAK-paxillin-F-actin cascade during the induction of MCF-7 cell migration. An ET-integrin-MMP axis was also induced by macrophages in breast cancer cells during the induction of cell invasion and transendothelial migration. Furthermore, the results of our mouse orthotopic tumor model, which revealed an ET axis-mediated lung metastasis of MφCM-stimulated breast cancer cells (Fig. 14), suggested that the ET axis was involved in macrophage-enhanced interactions between breast cancer cells and endothelial cells.
Our study indicated that MφCM induced the expression of integrins αV, α5, αM, β1, β2, and β3 in MCF-7 cells (Fig. 8). The component cytokines of MφCM like IL-8, TNF-α, and IL-6 have been known to induce some integrins (51–53). However, the MφCM-induced expression of integrins αV, αM, β1, β2, and β3 was drastically suppressed by anti-ET-1 antibody, suggesting a pivotal role of ET-1 in the MφCM action. We have shown in Fig. 1 that MφCM significantly induced ET-1 secretion from MCF-7 cells and HUVECs at 50–180 pg/ml, which was comparable with the serum ET-1 levels detected from clinical samples. In tissues, the ET-1 levels were detected at 1–2 ng/ml (54). Because the concept of “the synapse between cells” has been generally accepted to describe cell-cell close interactions, such as the case of cytokine secretion from cell A acting on cell B (55, 56), the actual working levels of ET-1 are thought to be much higher than the detected levels in physiological/pathological conditions. ET-1 was therefore used for studies at a concentration as high as 100 nm (13, 57). In our study, breast cancer cells were treated with 100 ng/ml (∼40 nm) recombinant ET-1 to study the mechanisms underlying the ET axis-induced expression of integrins αV and β1. ET-1 induced the phosphorylation (activation) of Elk-1, STAT-3, and NF-κB transcription factors in MCF-7 and MDA-MB-231 cells. The results of our series of studies suggest that ET-1 induced the expression of the genes encoding integrins αV and β1 via an Elk-1-, STAT-3-, and NF-κB-mediated transcriptional activation mechanism (Fig. 13).
In conclusion, our studies suggest that macrophages induce the ET-integrin axis to enhance breast cancer cell chemotaxis and adhesion to endothelial cells as well as transendothelial migration. Detailed studies further indicate that ET-1 stimulates the expression of integrins αV and β1 through an Elk-1-, NF-κB-, and STAT-3-mediated transcriptional activation mechanism. The effect of macrophages on tumor angiogenesis has been extensively studied and reviewed. Our present studies provide some clues regarding how macrophages affect cancer cell migration/invasion toward blood vessels.
This work was supported by National Health Research Institutes Grant CA-099-PP-10 and Department of Health Grant DOH102-TD-C-111-004, Taiwan, Republic of China.
- ET
- endothelin
- ETR
- ET receptor
- MMP
- matrix metalloproteinase
- ECM
- extracellular matrix
- ICAM
- intercellular adhesion molecule
- VCAM
- vascular cell adhesion molecule
- MφCM
- macrophage-conditioned medium
- IL-8RA
- IL-8 receptor-antagonizing antibody
- sTNFR
- soluble TNF-α receptor
- MEM
- modified Eagle's medium
- HUVEC
- human umbilical vein endothelial cell
- HUVEC*
- HUVEC treated with MφCM for 24 h
- CFDA
- carboxyfluorescein diacetate
- TRITC
- tetramethylrhodamine B isothiocyanate
- FAK
- focal adhesion kinase.
REFERENCES
- 1. Balkwill F., Mantovani A. (2001) Inflammation and cancer: back to Virchow? Lancet 357, 539–545 [DOI] [PubMed] [Google Scholar]
- 2. Lee C. C., Liu K. J., Huang T. S. (2006) Tumor-associated macrophage: its role in tumor angiogenesis. J. Cancer Mol. 2, 135–140 [Google Scholar]
- 3. Wyckoff J., Wang W., Lin E. Y., Wang Y., Pixley F., Stanley E. R., Graf T., Pollard J. W., Segall J., Condeelis J. (2004) A paracrine loop between tumor cells and macrophages is required for tumor cell migration in mammary tumors. Cancer Res. 64, 7022–7029 [DOI] [PubMed] [Google Scholar]
- 4. Pukrop T., Klemm F., Hagemann T., Gradl D., Schulz M., Siemes S., Trümper L., Binder C. (2006) Wnt 5a signaling is critical for macrophage-induced invasion of breast cancer cell lines. Proc. Natl. Acad. Sci. U.S.A. 103, 5454–5459 [DOI] [PMC free article] [PubMed] [Google Scholar]
- 5. Bingle L., Lewis C. E., Corke K. P., Reed M. W., Brown N. J. (2006) Macrophages promote angiogenesis in human breast tumour spheroids in vivo. Br. J. Cancer 94, 101–107 [DOI] [PMC free article] [PubMed] [Google Scholar]
- 6. Lee C. C., Liu K. J., Chen L. L., Wu Y. C., Huang T. S. (2006) Tumor necrosis factor-α, interleukin-8 and interleukin-6 are involved in vascular endothelial cell capillary tube and network formation induced by tumor-associated macrophages. J. Cancer Mol. 2, 155–160 [Google Scholar]
- 7. Pollard J. W. (2004) Tumour-educated macrophages promote tumour progression and metastasis. Nat. Rev. Cancer 4, 71–78 [DOI] [PubMed] [Google Scholar]
- 8. Balkwill F. (2004) Cancer and the chemokine network. Nat. Rev. Cancer 4, 540–550 [DOI] [PubMed] [Google Scholar]
- 9. Haynes W. G., Webb D. J. (1998) Endothelin as a regulator of cardiovascular function in health and disease. J. Hypertens. 16, 1081–1098 [DOI] [PubMed] [Google Scholar]
- 10. Penna C., Rastaldo R., Mancardi D., Cappello S., Pagliaro P., Westerhof N., Losano G. (2006) Effect of endothelins on the cardiovascular system. J. Cardiovasc. Med. 7, 645–652 [DOI] [PubMed] [Google Scholar]
- 11. Nelson J., Bagnato A., Battistini B., Nisen P. (2003) The endothelin axis. Emerging role in cancer. Nat. Rev. Cancer 3, 110–116 [DOI] [PubMed] [Google Scholar]
- 12. Bagnato A., Salani D., Di Castro V., Wu-Wong J. R., Tecce R., Nicotra M. R., Venuti A., Natali P. G. (1999) Expression of endothelin 1 and endothelin A receptor in ovarian carcinoma: evidence for an autocrine role in tumor growth. Cancer Res. 59, 720–727 [PubMed] [Google Scholar]
- 13. Salani D., Di Castro V., Nicotra M. R., Rosanò L., Tecce R., Venuti A., Natali P. G., Bagnato A. (2000) Role of endothelin-1 in neovascularization of ovarian carcinoma. Am. J. Pathol. 157, 1537–1547 [DOI] [PMC free article] [PubMed] [Google Scholar]
- 14. Rosanò L., Varmi M., Salani D., Di Castro V., Spinella F., Natali P. G., Bagnato A. (2001) Endothelin-1 induces tumor proteinase activation and invasiveness of ovarian carcinoma cells. Cancer Res. 61, 8340–8346 [PubMed] [Google Scholar]
- 15. Rosanò L., Salani D., Di Castro V., Spinella F., Natali P. G., Bagnato A. (2002) Endothelin-1 promotes proteolytic activity of ovarian carcinoma. Clin. Sci. 103, 306S–309S [DOI] [PubMed] [Google Scholar]
- 16. Spinella F., Rosanò L., Di Castro V., Natali P. G., Bagnato A. (2002) Endothelin-1 induces vascular endothelial growth factor by increasing hypoxia-inducible factor-1α in ovarian carcinoma cells. J. Biol. Chem. 277, 27850–27855 [DOI] [PubMed] [Google Scholar]
- 17. Grant K., Loizidou M., Taylor I. (2003) Endothelin-1: a multifunctional molecule in cancer. Br. J. Cancer 88, 163–166 [DOI] [PMC free article] [PubMed] [Google Scholar]
- 18. Bagnato A., Natali P. G. (2004) Endothelin receptors as novel targets in tumor therapy. J. Transl. Med. 2, 16. [DOI] [PMC free article] [PubMed] [Google Scholar]
- 19. Grimshaw M. J. (2005) Endothelins in breast tumour cell invasion. Cancer Lett. 222, 129–138 [DOI] [PubMed] [Google Scholar]
- 20. Guise T. A., Yin J. J., Mohammad K. S. (2003) Role of endothelin-1 in osteoblastic bone metastases. Cancer 97, 779–784 [DOI] [PubMed] [Google Scholar]
- 21. Kusuhara M., Yamaguchi K., Nagasaki K., Hayashi C., Suzaki A., Hori S., Handa S., Nakamura Y., Abe K. (1990) Production of endothelin in human cancer cell lines. Cancer Res. 50, 3257–3261 [PubMed] [Google Scholar]
- 22. Hood J. D., Cheresh D. A. (2002) Role of integrins in cell invasion and migration. Nat. Rev. Cancer 2, 91–100 [DOI] [PubMed] [Google Scholar]
- 23. Kinashi T. (2005) Intracellular signaling controlling integrin activation in lymphocytes. Nat. Rev. Immunol. 5, 546–559 [DOI] [PubMed] [Google Scholar]
- 24. McEver R. P., Moore K. L., Cummings R. D. (1995) Leukocyte trafficking mediated by selectin-carbohydrate interactions. J. Biol. Chem. 270, 11025–11028 [DOI] [PubMed] [Google Scholar]
- 25. Howe A., Aplin A. E., Alahari S. K., Juliano R. L. (1998) Integrin signaling and cell growth control. Curr. Opin. Cell Biol. 10, 220–231 [DOI] [PubMed] [Google Scholar]
- 26. Tucker G. C. (2006) Integrins: molecular targets in cancer therapy. Curr. Oncol. Rep. 8, 96–103 [DOI] [PubMed] [Google Scholar]
- 27. Wiesner S., Legate K. R., Fässler R. (2005) Integrin-actin interactions. Cell. Mol. Life Sci. 62, 1081–1099 [DOI] [PMC free article] [PubMed] [Google Scholar]
- 28. Stefanidakis M., Koivunen E. (2006) Cell-surface association between matrix metalloproteinases and integrins: role of the complexes in leukocyte migration and cancer progression. Blood 108, 1441–1450 [DOI] [PubMed] [Google Scholar]
- 29. Chen W. S., Chen C. C., Chen L. L., Lee C. C., Huang T. S. (2013) Secreted heat shock protein 90α (HSP90α) induces nuclear factor-κB-mediated TCF12 protein expression to down-regulate E-cadherin and to enhance colorectal cancer cell migration and invasion. J. Biol. Chem. 288, 9001–9010 [DOI] [PMC free article] [PubMed] [Google Scholar]
- 30. Huang T. S., Lee C. C., Chang A. C., Lin S., Chao C. C., Jou Y. S., Chu Y. W., Wu C. W., Whang-Peng J. (2003) Shortening of microsatellite deoxy(CA) repeats involved in GL331-induced down-regulation of matrix metalloproteinase-9 gene expression. Biochem. Biophys. Res. Commun. 300, 901–907 [DOI] [PubMed] [Google Scholar]
- 31. Huang T. S., Shu C. H., Shih Y. L., Huang H. C., Su Y. C., Chao Y., Yang W. K., Whang-Peng J. (1996) Protein tyrosine phosphatase activities are involved in apoptotic cancer cell death induced by GL331, a new homolog of etoposide. Cancer Lett. 110, 77–85 [DOI] [PubMed] [Google Scholar]
- 32. Bhowmick N. A., Neilson E. G., Moses H. L. (2004) Stromal fibroblasts in cancer initiation and progression. Nature 432, 332–337 [DOI] [PMC free article] [PubMed] [Google Scholar]
- 33. Lewis C. E., Pollard J. W. (2006) Distinct role of macrophages in different tumor microenvironments. Cancer Res. 66, 605–612 [DOI] [PubMed] [Google Scholar]
- 34. Condeelis J., Pollard J. W. (2006) Macrophages: obligate partners for tumor cell migration, invasion, and metastasis. Cell 124, 263–266 [DOI] [PubMed] [Google Scholar]
- 35. Shih J. Y., Yuan A., Chen J. J. W., Yang P. C. (2006) Tumor-associated macrophage: its role in cancer invasion and metastasis. J. Cancer Mol. 2, 101–106 [Google Scholar]
- 36. Leek R. D., Lewis C. E., Whitehouse R., Greenall M., Clarke J., Harris A. L. (1996) Association of macrophage infiltration with angiogenesis and prognosis in invasive breast carcinoma. Cancer Res. 56, 4625–4629 [PubMed] [Google Scholar]
- 37. Robinson-Smith T. M., Isaacsohn I., Mercer C. A., Zhou M., Van Rooijen N., Husseinzadeh N., McFarland-Mancini M. M., Drew A. F. (2007) Macrophages mediate inflammation-enhanced metastasis of ovarian tumors in mice. Cancer Res. 67, 5708–5716 [DOI] [PubMed] [Google Scholar]
- 38. Bayne L. J., Beatty G. L., Jhala N., Clark C. E., Rhim A. D., Stanger B. Z., Vonderheide R. H. (2012) Tumor-derived granulocyte-macrophage colony-stimulating factor regulates myeloid inflammation and T cell immunity in pancreatic cancer. Cancer Cell 21, 822–835 [DOI] [PMC free article] [PubMed] [Google Scholar]
- 39. Bar-Eli M. (1999) Role of interleukin-8 in tumor growth and metastasis of human melanoma. Pathobiology 67, 12–18 [DOI] [PubMed] [Google Scholar]
- 40. Waterston A., Bower M. (2004) TNF and cancer: good or bad? Cancer Ther. 2, 131–148 [Google Scholar]
- 41. Dua R. S., Gui G. P., Isacke C. M. (2005) Endothelial adhesion molecules in breast cancer invasion into the vascular and lymphatic systems. Eur. J. Surg. Oncol. 31, 824–832 [DOI] [PubMed] [Google Scholar]
- 42. Haier J., Nicolson G. L. (2001) The role of tumor cell adhesion as an important factor in formation of distant colorectal metastasis. Dis. Colon Rectum 44, 876–884 [DOI] [PubMed] [Google Scholar]
- 43. Hu Y., Kiely J. M., Szente B. E., Rosenzweig A., Gimbrone M. A. (2000) E-selectin-dependent signaling via the mitogen-activated protein kinase pathway in vascular endothelial cells. J. Immunol. 165, 2142–2148 [DOI] [PubMed] [Google Scholar]
- 44. Laferriere J., Houle F., Taher M. M., Valerie K., Huot J. (2001) Transendothelial migration of colon carcinoma cells requires expression of E-selectin by endothelial cells and activation of stress-activated protein kinase-2 (SAPK2/p38) in the tumor cells. J. Biol. Chem. 276, 33762–33772 [DOI] [PubMed] [Google Scholar]
- 45. Weis S., Cui J., Barnes L., Cheresh D. (2004) Endothelial barrier disruption by VEGF-mediated Src activity potentiates tumor cell extravasation and metastasis. J. Cell Biol. 167, 223–229 [DOI] [PMC free article] [PubMed] [Google Scholar]
- 46. Baldwin A. L., Thurston G. (2001) Mechanics of endothelial cell architecture and vascular permeability. Crit. Rev. Biomed. Eng. 29, 247–278 [DOI] [PubMed] [Google Scholar]
- 47. Zouki C., Baron C., Fournier A., Filep J. G. (1999) Endothelin-1 enhances neutrophil adhesion to human coronary artery endothelial cells: role of ET(A) receptors and platelet-activating factor. Br. J. Pharmacol. 127, 969–979 [DOI] [PMC free article] [PubMed] [Google Scholar]
- 48. von Bülow C., Hayen W., Hartmann A., Mueller-Klieser W., Allolio B., Nehls V. (2001) Endothelial capillaries chemotactically attract tumour cells. J. Pathol. 193, 367–376 [DOI] [PubMed] [Google Scholar]
- 49. Tremblay P. L., Auger F. A., Huot J. (2006) Regulation of transendothelial migration of colon cancer cells by E-selectin-mediated activation of p38 and ERK MAP kinases. Oncogene 25, 6563–6573 [DOI] [PubMed] [Google Scholar]
- 50. Hordijk P. L. (2006) Endothelial signalling events during leukocyte transmigration. FEBS J. 273, 4408–4415 [DOI] [PubMed] [Google Scholar]
- 51. Lee C. Y., Huang C. Y., Chen M. Y., Lin C. Y., Hsu H. C., Tang C. H. (2011) IL-8 increases integrin expression and cell motility in human chondrosarcoma cells. J. Cell. Biochem. 112, 2549–2557 [DOI] [PubMed] [Google Scholar]
- 52. Montecucco F., Steffens S., Burger F., Da Costa A., Bianchi G., Bertolotto M., Mach F., Dallegri F., Ottonello L. (2008) Tumor necrosis factor-α (TNF-α) induces integrin CD11b/CD18 (Mac-1) up-regulation and migration to the CC chemokine CCL3 (MIP-1α) on human neutrophils through defined signalling pathways. Cell. Signal. 20, 557–568 [DOI] [PubMed] [Google Scholar]
- 53. Jovanović M., Vićovac L. (2009) Interleukin-6 stimulates cell migration, invasion and integrin expression in HTR-8/SVneo cell line. Placenta 30, 320–328 [DOI] [PubMed] [Google Scholar]
- 54. Wong M., Jeng A. Y. (1995) Determination of tissue endothelin levels. Biochem. Mol. Biol. Int. 35, 1359–1364 [PubMed] [Google Scholar]
- 55. Davis D. M., Dustin M. L. (2004) What is the importance of the immunological synapse? Trends Immunol. 25, 323–327 [DOI] [PubMed] [Google Scholar]
- 56. Dustin M. L. (2012) Signaling at neuro/immune synapses. J. Clin. Invest. 122, 1149–1155 [DOI] [PMC free article] [PubMed] [Google Scholar]
- 57. Said N., Smith S., Sanchez-Carbayo M., Theodorescu D. (2011) Tumor endothelin-1 enhances metastatic colonization of the lung in mouse xenograft models of bladder cancer. J. Clin. Invest. 121, 132–147 [DOI] [PMC free article] [PubMed] [Google Scholar]