

Background: FIT2 is an ER protein purported to be important for triglyceride lipid droplet formation.
Results: FIT2 deficiency in adipose tissue results in lipodystrophy and metabolic dysfunction.
Conclusion: FIT2 is required for normal triglyceride storage in adipose tissue.
Significance: This study provides the first proof-of-principle mouse models indicating that FIT2 is essential for normal triglyceride storage in adipose tissue.
Keywords: Endoplasmic Reticulum (ER), Lipid Droplets, Lipodystrophy, Membrane Proteins, Obesity
Abstract
Triglycerides within the cytosol of cells are stored in a phylogenetically conserved organelle called the lipid droplet (LD). LDs can be formed at the endoplasmic reticulum, but mechanisms that regulate the formation of LDs are incompletely understood. Adipose tissue has a high capacity to form lipid droplets and store triglycerides. Fat storage-inducing transmembrane protein 2 (FITM2/FIT2) is highly expressed in adipocytes, and data indicate that FIT2 has an important role in the formation of LDs in cells, but whether FIT2 has a physiological role in triglyceride storage in adipose tissue remains unproven. Here we show that adipose-specific deficiency of FIT2 (AF2KO) in mice results in progressive lipodystrophy of white adipose depots and metabolic dysfunction. In contrast, interscapular brown adipose tissue of AF2KO mice accumulated few but large LDs without changes in cellular triglyceride levels. High fat feeding of AF2KO mice or AF2KO mice on the genetically obese ob/ob background accelerated the onset of lipodystrophy. At the cellular level, primary adipocyte precursors of white and brown adipose tissue differentiated in vitro produced fewer but larger LDs without changes in total cellular triglyceride or triglyceride biosynthesis. These data support the conclusion that FIT2 plays an essential, physiological role in fat storage in vivo.
Introduction
The unique ability of adipose tissue to expand to store triglycerides during periods of positive energy balance has been the focus of much research due to the global emergence of obesity. The lipid droplet (LD)3 is a phylogenetically conserved organelle that is composed of a monolayer of phospholipids and a unique proteome surrounding a core of neutral lipids (1). Triglyceride (TAG)-rich unilocular LDs in white adipose tissue (WAT) serve as the main storage depot in the body for energy and particularly when energy intake exceeds energy expenditure. Adipose tissue expansion can occur by two parallel processes involving preadipocyte recruitment and differentiation into adipocytes, whereupon they produce new LDs, and enlargement of preexisting unilocular LDs in mature adipocytes (2). In contrast, upon increased energy demand, free fatty acids are hydrolyzed from TAG stored in unilocular LDs in WAT and released into the circulation, where they serve as substrates for mitochondrial β-oxidation and ATP generation in skeletal muscle or for ketogenesis and synthesis of TAG in the liver. In comparison with the current understanding of LD catabolism, relatively little is known about LD formation. There is substantial evidence that LDs form at the endoplasmic reticulum (ER), and a widely held model is the coalescence of triglyceride synthesized by acyl-CoA:diacylglycerol acyltransferase enzymes between the leaflets of the ER followed by budding of the LD into the cytoplasm (3). However, the nature of the protein machinery regulating LD formation and details of the process of LD formation remain to be determined.
We recently identified a phylogenetically conserved two-gene family of proteins that are involved in the partitioning of TAG into LDs, which we named fat storage-inducing transmembrane protein 1 and 2 (FITM1/FIT1 and FITM2/FIT2) (4). Both FIT1 and FIT2 are ER-localized proteins that share a common membrane topology, having six transmembrane domains (4, 5). FIT1 and FIT2 exhibit different tissue expression profiles, where FIT1 is primarily expressed in skeletal muscle, with much lower levels in heart, whereas FIT2 is ubiquitously expressed at low levels in tissues, with the highest expression in WAT and brown adipose tissue (BAT). Overexpression of FIT proteins in mammalian cells in culture resulted in accumulation of LDs without an increase in fatty acid or triglyceride biosynthesis. Overexpression of FIT2 in liver and skeletal muscle also resulted in increased cellular TAG and LDs (4), consistent with a role in LD formation. FIT proteins produce LDs by partitioning de novo synthesized triglyceride from the ER into LDs (4). As part of the mechanism by which FIT proteins mediate LD formation, purified FIT proteins directly bind to triglyceride, and binding is essential for its function in forming LDs (6). Converse to overexpression studies, knockdown of FIT2 in 3T3-L1 adipocytes resulted in a significant reduction in LD accumulation without an obvious effect on adipogenesis (4), supporting an important role of FIT2 in LD formation in this cell model.
The enrichment of FIT2 in adipose tissue is probably related to the findings that both human and mouse FIT2 are direct targets of the adipogenic transcription factor PPARγ, where they share a conserved intronic PPARγ response element (7–9). Taken together, these studies support an important role of FIT2 in LD accumulation. However, it has not been determined if FIT2 plays an essential role in TAG accumulation in adipocytes in vivo. To test if FIT2 is required for fat storage in adipose tissue, we generated mice with a deficiency of FIT2 in adipose tissue (AF2KO) using aP2-cre to drive gene deletion of FIT2 in mature adipocytes. Here we demonstrate that FIT2 is required for maintaining normal adipose mass and volume in WAT in standard chow diet-fed (SD) and high fat diet (HFD)-fed mice as well as in the ob/ob monogenetic obesity mouse model. Moreover, we show, using adipocyte precursor cells isolated from WAT and brown adipose tissue, that FIT2 is not required for LD formation per se but rather regulates the number of LDs that form and consequently LD size. Together, this study provides the first in vivo evidence that FIT2 is essential for normal fat storage.
EXPERIMENTAL PROCEDURES
Mice
A Loxp site and a Frt-Neo-Frt-Loxp (FNFL) cassette were engineered to flank the promoter, exon 1, and PPAR binding site of the wild-type Fitm2 allele to generate the “floxed/neo” Fitm2 allele on a bacterial artificial chromosome. A gene-targeting vector was constructed by retrieving the 2-kb short homology arm (5′ to Leu-83), the floxed sequence containing promoter/exon 1, the FNFL cassette, and the 5-kb long homology arm (end of FNFL to 3′) into a plasmid carrying the diphtheria toxin α-chain negative selection marker. The FNFL cassette conferred G418 resistance during gene targeting in PTL1 (129B6 hybrid) embryonic stem cells, and the diphtheria toxin α-chain cassette provided an autonomous negative selection to reduce the random integration event during gene targeting. Several targeted embryonic stem cells were identified and injected into C57BL/6 blastocysts to generate chimeric mice. Male chimeras were bred to homozygous ACTB(Flpe/Flpe) females (in C57BL/6 background) to transmit the floxed Fitm2 allele. Mice carrying floxed Fitm2 allele were crossed to aP2-cre deleter (B6.Cg-Tg(Fabp4-cre)1Rev/J) for conditional knock-out study. Study protocols were approved by the Institutional Animal Care and Use Committee of SingHealth. Mice were fed a standard chow diet composed of 4.8% fat (Specialty Feeds, catalog no. 8310)) or a high fat diet (Research Diets, Inc., number D12492) composed of 34.9% fat (60 kcal % fat) for the indicated amount of time.
Tissue Processing and Histology
Tissues were fixed for 24 h in 10% neutral buffered formalin (Sigma-Aldrich, HT501128) and stored in 70% ethanol. Tissues were processed using a Leica TP-1020 tissue processor and a Leica tissue-embedding station Leica EG-1160 following standard protocols. Paraffin-embedded sections were stained with H&E (hematoxylin from Vector Labs, catalog no. H-3401; eosin from Sigma, catalog no. HT110380) using standard protocols. Following deparaffinization and antigen retrieval, slides were incubated with either F4/80 primary antibody, 1:200 dilution (Abcam AB7481), or Perilipin 1 primary antibody, 1:100 dilution (Abcam AB7481). Slides were then incubated with secondary antibodies (Invitrogen; A-21434, Alexa Fluor 555 at 1:500 dilution or A-11008, Alexa Fluor 488 at 1:200 dilution). Proteins were visualized using a Leica DMI3000 B fluorescence microscope with the Leica Application Suite version 4.0 and a Leica DM 2000 microscope with the Leica Application suite version 3.5.0 for H&E-stained sections.
Adipocyte Precursor Isolation and Differentiation
The stromal vascular fraction of inguinal adipose depots from 2–3-week-old mice were isolated according to Sun et al. (10). In brief, interscapular brown fat and inguinal fat were minced, digested with collagenase, filtered, and collected by centrifugation. Cells were resuspended in DMEM supplemented with 10% (v/v) newborn bovine serum. Following growth to confluence, cells were induced to differentiate into adipocytes using an induction mixture containing 850 nm insulin, 0.5 μm dexamethasone, 250 μm 3-siobutyl-1-methylxanthine, and 1 μm rosiglitazone. Brown adipocytes were treated with the same induction mixture but with an additional 1 nm T3 and 125 nm indomethacin. Following 2 days of induction, fresh medium was added that contained 160 nm insulin (and 1 nm T3 for the brown adipocyte cultures).
Measurement of Adipocyte Number and Size
Lipid droplets in adipocytes in culture were stained with BODIPY 493/503 and Hoechst 33342, and images were captured using a Leica DMI3000 B fluorescence microscope. Lipid droplet size and number were calculated using ImageJ. Four to five images were analyzed for each condition that totaled more than 1500 LDs/condition.
Magnetic Resonance Acquisition and Image Processing
Whole body lean and fat mass was measured in mice using an EchoMRI 4-in-1. For quantification of adipose volumes in both subcutaneous white adipose tissue (SWAT) and epididmyal white adipose tissue (EWAT), the following protocol was employed. MRI measurements were performed on a 7 T Bruker ClinScan using a 40-mm volume transmit and receive coil. Prior to in vivo experiments, mice were initially anesthetized with 3% isofluorane in a dedicated chamber. During the imaging session, anesthesia levels were reduced to 1.5–2% in a combination of medical air and medical oxygen. Mice were positioned in the prone position and respiration-gated image acquisition was performed. Physiological monitoring was performed using an ML880 16/30 Powerlab system (AD Instruments, Spechbach, Germany). The temperature probe was placed inside the rectum of the mice, and body temperature was monitored and controlled with circulating warm water. The imaging experiments were performed on both L/L and AF2KO group animals at 24 weeks of age. T2 weighted coronal images were obtained to localize the lumbar I to lumbar V of the abdomen region using the turbo spin echo method. Respiration-gated Dixon imaging was performed in the transverse plane by acquiring 22 slices (1 mm thick); time of repetition, 8 ms; number of averages, 2; echo time (opposite phase), 1 ms; echo time (in phase), 2.5 ms; flip angle, 6º; echo bandwidths, 1090 and 1500 Hz/pixel; matrix size, 192 × 256; and in-plane resolution, 0.195 × 0.195 mm. Segmentation of SWAT and EWAT was performed using the hybrid algorithms level set (11, 12) and fuzzy c-means (FCM) (13) by an in-house developed MATLAB program. Dixon-based fat image volume data were first filtered using a bifilter to reduce the high frequency noise and homogenize the regions with little intensity variations and to preserve and sharpen the edges. The strength of the edges in the image volume was improved using edge enhancement techniques. The initial mask or level set was derived from the binary image of the data for each slice. The distance-regularized level set evolution-based level set was allowed to expand and contract for localizing the boundary between SWAT and EWAT. FCM, with a different number of classes, was performed on SWAT and EWAT regions, respectively, and thresholds for classifying the data into fat and nonfat regions were derived using statistical parameters like mean, variance, and neighborhood relation. The different FCM regions in SWAT and EWAT were merged based on the intensity and neighborhood relation. Quantitation of SWAT and EWAT regions was done using the voxel dimensions of scan.
Measurement of Plasma Analytes
Plasma analyte levels were determined using the insulin ELISA (Millipore, EZRMI-13K); adiponectin ELISA (Millipore, EZMADP-60K); mouse leptin ELISA (Millipore) TNF-α Quantikine ELISA kit (R&D Systems, MTA00B); triglycerides LiquiColor® test (Stanbio Laboratories, 2200-225); and unesterified fatty acids HR series NEFA-HR(2) (Wako Diagnostics, 294-63601).
Insulin and Glucose Tolerance Tests
Prior to glucose or insulin tollerance test, mice were fasted for 6 h with ad libitum access to water and then administered glucose (1 g/kg) or insulin (1 unit/kg for SD-fed and 1.5 unit/kg for HFD-fed mice) intraperitoneally, respectively. Blood glucose was measured in blood samples collected from tail vain using a glucometer (OneTouch® Ultra®).
Adipose Lipolysis Assay
Quantification of fatty acid release from fat pad explants was performed according to Jaworksi et al. (26). In brief, ∼20 mg of epididymal fat pads were removed from mice and incubated at 37 °C in Krebs-Ringer buffer (12 mm HEPES, 121 NaCl, 4.9 mm KCl, 1.2 mm MgSO4, and 0.33 mm CaCl2) with 3.5% fatty acid-free BSA and 3 mm glucose (KRB), with or without 200 nm isoproterenol (Sigma). Medium was collected at 1, 2, and 4 h, and glycerol content was measured enzymatically (Sigma).
Gene Expression and Western Blot Analysis
cDNA was synthesized from mouse tissues and cells using the SuperScript III first strand cDNA synthesis kit and oligo(dT) primers (Invitrogen). Gene expression analysis was assessed by quantitative SYBR Green real-time PCR using an Applied Biosystems HT7900 real-time PCR system.
Primer sequences are available upon request. Relative quantification of each target was normalized to GAPDH. Tissues were homogenized in RIPA buffer plus EDTA-free protease inhibitors (Roche Applied Science). Protein concentration was determined by a BCA protein assay (Pierce), and 80 μg of protein were used per sample. Samples were separated by SDS-PAGE on 8, 12, or 15% polyacrylamide gels, transferred to nitrocellulose membranes (Bio-Rad), and incubated with the indicated antibodies: FIT2 (4), Plin1 (Abcam AB7481), Fsp27 (gift of Li Peng), Fabp4 (Cell Signaling), GAPDH (Santa Cruz Biotechnology, Inc.), and Calnexin (Sigma). Quantification of signals was performed using an Odyssey infrared scanner (LI-COR).
Basal TAG Synthesis and Basal Turnover
Basal TAG synthesis was measured in differentiated adipocytes in culture by treating cells with 10 μm [14C]oleate-BSA complex in DMEM for the indicated times. At the end of each time point, cellular lipids were extracted with hexane/isopropanol (3:2), and radioactive TAG was separated by TLC analysis (14) and quantified using PhosphorImager analysis. Free glycerol reagent was from Sigma (catalog no. F6428).
Statistical Analysis
All quantitative data are represented as mean ± S.E. p values were generated by Student's t test.
RESULTS
AF2KO Mice Exhibit Progressive Lipodystrophy with Age
To test the hypothesis that FIT2 is important for normal fat storage in adipose tissue in vivo, we used gene-targeting to generate viable “floxed” FIT2 mice by flanking exon 1 of FIT2 with LoxP sites (Fig. 1A). Mice carrying floxed FIT2 alleles were crossed to aP2-cre mice to generate mice with a deficiency of FIT2 in adipose tissue, henceforth named AF2KO. Littermates having both FIT2 alleles flanked with LoxP sites (L/L) were used as controls. It is critical to note that the use of aP2-cre can only delete genes after differentiation of adipocytes (15). The reason for this effect is that the aP2 promoter is under the control of PPARγ, which is expressed late in adipogenesis, and FIT2 is a direct target of PPARγ (7–9). Hence, deletion of FIT2 can only happen postdifferentiation. To date, there are no available adipose-specific promoters available to delete genes early in preadipocytes.
FIGURE 1.

Gene-targeting strategy and adipose-specific deletion of FIT2. A, graphical representation of the gene-targeting strategy used in this study to delete FIT2 in adipose depots. B, quantitative RT-PCR analysis of FIT2 mRNA in the indicated tissues shows adipose-specific deficiency of FIT2 in AF2KO mice. C, Western blot analysis of FIT2 on the indicated tissues shows adipose-specific deficiency of FIT2 protein in EWAT, SWAT, and BAT but not in the heart of AF2KO mice. D, quantitative RT-PCR of FIT2 mRNA in peritoneal macrophage from L/L and AF2KO mice (macrophage harvested from 4 mice/genotype). Data are represented as mean ± S.E. (error bars).
Quantification of FIT2 mRNA and protein confirmed that AF2KO mice had a significant reduction in FIT2 levels in SWAT, EWAT, and BAT, without changes in expression in the heart (Fig. 1, B and C). aP2-cre transgenic is known to have expression in macrophage. However, FIT2 protein is not detectable in macrophage, but mRNA levels in macrophage of AF2KO mice quantified by qRT-PCR were similar to L/L controls (Fig. 1D). The residual levels of FIT2 in AF2KO WAT depots are probably due to FIT2 expression in non-adipocyte cell types in the stromal vascular compartment, which has been similarly seen with the use of aP2-cre (15). Measurements of body weight gain over time showed no statistical difference between L/L and AF2KO mice (Fig. 2A), consistent with no significant changes in whole body lean and fat mass as determined by whole body MRI (Fig. 2B). Food intake and plasma leptin levels were similar between both genotypes (Fig. 2, C and D). Analysis of individual WAT depots of 15-week-old AF2KO mice fed a standard diet indicated a small but insignificant decrease in WAT depot weights and an insignificant increase in liver weight (Fig. 2E). AF2KO mice exhibited normal glucose and insulin tolerance but interestingly had significantly lower plasma adiponectin (Fig. 2, F–H). The absence of a weight difference at 15 weeks of age is similar to what was reported for the adipose knockout of PPARγ using the same aP2-cre approach (FKOγ). However, FKOγ mice did exhibit progressive lipodystrophy as they aged (15). Examination of mice at the gross anatomical level indicated that AF2KO mice clearly exhibited less WAT at 24 weeks of age (Fig. 3A), which was confirmed through quantification of adipose depot volumes using MRI in living mice and wet weight of excised fat depots (Fig. 3, B–D). Adipose tissue macrophage infiltration, as indicated by the crownlike structures surrounding adipocytes, was observed in EWAT of AF2KO mice but not in L/L mice (Fig. 3E). These crownlike structures were confirmed to be macrophage by staining positive for the myeloid cell surface marker F4/80 (Fig. 3E). Livers of AF2KO mice weighed 25% more than control livers, probably indicating reallocation of triglyceride from WAT to liver (Fig. 3D), a phenotype commonly associated with lipodystrophy in humans and mice (16). Congruent with these phenotypes, AF2KO mice had low levels of plasma adiponectin, hyperinsulinemia, and insulin intolerance but normal glucose tolerance (Fig. 3, F and G), indicative of metabolic maladaptation to FIT2 deficiency in adipose tissue. Normal glucose tolerance of AF2KO mice can probably be explained by their hyperinsulinemia. AF2KO mice had normal fasting levels of cholesterol, triglycerides, and unesterified fatty acids (Table 1). Taken together, the data indicate that FIT2 is essential for normal storage of triglyceride in white adipose tissue.
FIGURE 2.
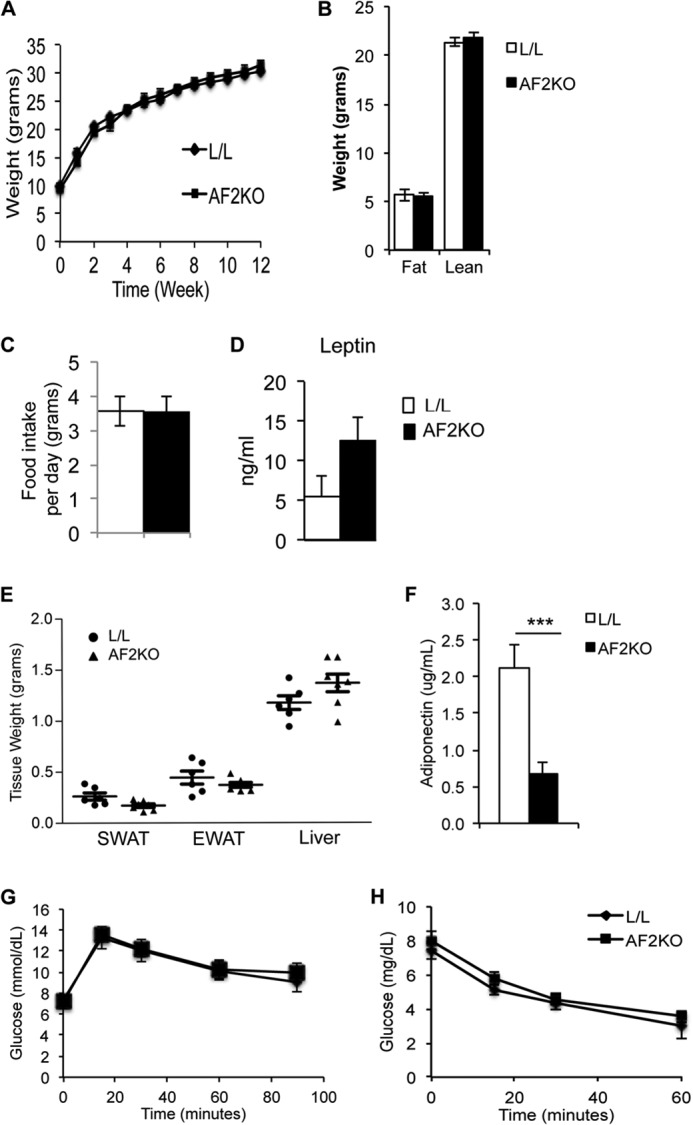
Adipose depot weights in 15-week-old AF2KO and L/L control mice. A, body weights of standard diet-fed mice starting at 3 weeks of age. B, MRI analysis of total body fat and lean mass. C, quantification of food intake per day. D, quantification of plasma leptin levels. E, quantification of wet weights of SWAT and EWAT and liver from 15-week-old male AF2KO and L/L controls. Although adipose depot weights trended lower, the differences were not statistically significant. F, fasting plasma adiponectin levels were significantly lower in AF2KO mice, indicative of adipose tissue dysfunction (n = 5 per genotype). ***, p < 0.0001. Insulin tolerance test (G) and glucose tolerance test (H) both indicated that AF2KO mice have similar insulin and glucose tolerance. n = 6 mice/genotype. Data are represented as mean ± S.E. (error bars) for all panels.
FIGURE 3.

Mice with adipose-specific deficiency of FIT2 are lipodystrophic and insulin-resistant. A, gross anatomical view of a 24-week-old control (L/L) and a knock-out mouse with adipose deficiency of FIT2 (AF2KO) indicates reduced white adipose mass. B, images from MRI analysis of living mice indicate reduced amounts of SWAT and EWAT in AF2KO mice. C, volumetric quantification of adipose-specific depots derived from MRI analysis indicate reduced volumes of EWAT and SWAT in AF2KO mice. D, quantification of adipose tissue depot and liver wet weights indicating reduced adipose depot mass and enlarged liver weight in AF2KO mice. Data are represented as mean ± S.D. Circles and triangles, L/L and AF2KO, respectively. E, histological sections of EWAT from L/L and AF2KO mice stained with H&E or immunolocalization of F4/80. The sections shown for H&E and F4/80 are non-consecutive. F, fasting plasma insulin and adiponectin (n = 5 mice/genotype). G, insulin tolerance test; H, glucose tolerance test. n = 5–7 mice/genotype. Data are represented as mean ± S.E. (error bars) for C, D, and F–H. *, p < 0.01; **, p < 0.001; ***, p < 0.0001.
TABLE 1.
AF2KO serum metabolites
Blood was collected from AF2KO mice after a 6-h fast. Serum metabolites were measured using a colorimetric assay. AF2KO mice did not exhibit significant difference in serum metabolites as compared with L/L mice. Data are represented as mean ± S.E. n = 4 mice/genotype.
| Metabolite | L/L | AF2KO |
|---|---|---|
| Triglyceride (mg/dl) | 51.91 ± 1.80 | 54.63 ± 4.03 |
| Cholesterol (mg/dl) | 156.45 ± 10.55 | 175.42 ± 12.78 |
| Free fatty acid (nmol/ml) | 477.78 ± 48.44 | 421.04 ± 36.08 |
High Fat Diet Feeding Accelerates Lipodystrophy in AF2KO Mice
The progressive lipodystrophy observed in AF2KO mice fed standard diet indicates that FIT2 plays an important role in TAG storage in WAT. To further test if FIT2 is important for fat storage under conditions of positive energy balance, we fed AFKO mice HFD for 12 weeks postweaning to an age of 15 weeks old, an age at which AF2KO mice fed a standard diet did not exhibit significant changes in adipose tissue mass (Fig. 2E). AF2KO mice showed a similar body weight gain on HFD as L/L mice but exhibited a significant change in body weight only at the 10- and 12-week time point on HFD (Fig. 4A). Plasma leptin levels were unchanged, which is consistent with a similar rate of weight gain seen in AF2KO mice as in L/L controls (Fig. 4B). Thus, AF2KO mice are not protected from HFD-induced weight gain.
FIGURE 4.

AF2KO mice have reduced accumulation of adipose tissue in response to high fat diet. A, body weights of HFD-fed mice starting at 3 weeks of age. B, quantification of plasma leptin levels. C, gross anatomical view of a 15-week-old control (L/L) and an adipose-specific FIT2 knock-out mouse (AF2KO) indicates reduced white adipose mass following HFD feeding. Note the enlarged pale liver in the AF2KO mouse. D, MRI analysis of total body fat and lean mass. E, images from MRI analysis of living mice indicate reduced amounts of SWAT and EWAT in AF2KO mice. F, volumetric quantification of adipose-specific depots derived from MRI analysis indicate reduced volumes of EWAT and SWAT in AF2KO mice. G, quantification of adipose tissue depot and liver wet weights, indicating reduced adipose depot mass and enlarged liver weight in AF2KO mice. Data are represented as mean ± S.D. (error bars) for A, B, and D–G. *, p < 0.01; **, p < 0.001; ***, p < 0.0001. Circles and triangles, L/L and AF2KO, respectively.
Examination of mice at the gross anatomical level indicated that AF2KO mice clearly exhibited decreased WAT depots (Fig. 4C), which was confirmed using two different MRI methods and measurement of adipose tissue depot weights (Fig. 4, D–G). HFD-fed AF2KO exhibited pale livers and significantly increased liver weight relative to L/L mice, indicative of enhanced liver fat accumulation (Fig. 4, C and G). Histological examination of sections of WAT from HFD-fed AF2KO indicated a severe exacerbation of the tissue phenotype seen in standard diet-fed mice, namely heterogeneity in adipocyte size and, more strikingly, a massive accumulation of macrophage relative to L/L controls (Fig. 5A). This level of macrophage infiltration could be indicative of adipocyte death. Plin1 staining has been shown to be a surrogate marker for adipocyte cell death associated with macrophage infiltration (17). As expected for intact cells, Plin1 staining of sections of EWAT of L/L mice indicated homogenous staining around unilocular LDs in the majority of cells. However, AF2KO mice exhibited heterogeneous staining of LDs for Plin1, indicative of dead and dying cells, providing an explanation for the progressive lipodystrophy of AF2KO mice (Fig. 5A).
FIGURE 5.

Increased M1 and M2 adipose tissue macrophage populations in HFD-fed AF2KO mice. A, histological sections of EWAT from L/L and AF2KO mice stained with H&E or immunolocalization of F4/80 and perilipin 1 (Plin1). The sections shown for H&E and F4/80 and Plin1 are non-consecutive. B, quantitative RT-PCR of mRNAs of M1 and M2 markers in adipose tissue of HFD-fed AF2KO and L/L controls. n = 5 mice/genotype. Data are represented as mean ± S.E. *, p < 0.01; **, p < 0.001; ***, p < 0.0001. C, glycerol release from fresh white adipose explants was quantified over the time course indicated (Basal). Duplicate explants were treated with isoproterenol to stimulate lipolysis, and glycerol release was quantified (Stimulated). Adipose explants were taken from three mice for each genotype. D, fasting plasma insulin, adiponectin, and TNFα (n = 5 mice/genotype). Shown are insulin (E) and glucose (F) tolerance tests (n = 5–7 mice/genotype). Data are represented as mean ± S.E. (error bars). *, p < 0.01; **, p < 0.001; ***, p < 0.0001.
Analysis of macrophage markers indicated that EWAT from AF2KO had significantly increased levels of both proinflammatory M1 and alternatively activated M2 macrophage (Fig. 5B). In addition, EWAT explants from HFD-fed AF2KO mice showed higher basal and stimulated fatty acid release relative to HFD-fed L/L (Fig. 5C). Fatty acids released by adipocytes have been shown to promote macrophage recruitment in mice (18, 19) and provide an explanation for the high levels of adipose tissue macrophage in AF2KO mice. High levels of adipose tissue macrophage in response to HFD feeding in mice have been correlated with a low grade inflammatory response in WAT through the release of cytokines, such as TNFα (20). This profile of macrophage infiltration and cell death of adipocytes in HFD-fed AF2KO would be expected to lead to metabolic dysfunction. Indeed, AF2KO mice had hyperinsulinemia, low levels of plasma adiponectin, and high levels of plasma TNFα (Fig. 5D). Consistent with these metabolic changes in AF2KO, AF2KO mice had significantly reduced insulin tolerance but normal glucose tolerance (Fig. 5, E and F). The normal glucose tolerance exhibited by AF2KO mice is consistent with their hyperinsulinemia. Together our data indicate that FIT2 is essential for fat storage in WAT under conditions of positive energy balance.
FIT2 Deficiency Reduces WAT Mass in a Genetic Model of Obesity
As described above, age or HFD accelerated the lipodystrophy of AF2KO mice. To further test the idea that positive energy balance exacerbates the progressive lipodystrophy in the absence of FIT2, we placed the AF2KO deletion on the background of the genetically obese ob/ob mouse model. We hypothesized that the rapid onset of adipocyte hyperplasia and hypertrophy in ob/ob mice would be compromised in the absence of FIT2. Indeed, 10-week-old AF2KO/obob mice showed a significant reduction in body weight due to reductions in wet weights of SWAT and EWAT depots without changes in liver or BAT weights (Fig. 6, A–C). Consistent with previously published findings, histological examination of EWAT from LL/obob controls indicated the presence of tissue macrophage (Fig. 6D). Importantly, AF2KO/obob had significantly more macrophage infiltration in EWAT relative to LL/obob mice (Fig. 6D). Surprisingly, BAT of AF2KO/obob mice primarily had LDs with a unilocular phenotype (Fig. 6E). These findings further support an important in vivo role of FIT2 in regulating fat storage.
FIGURE 6.
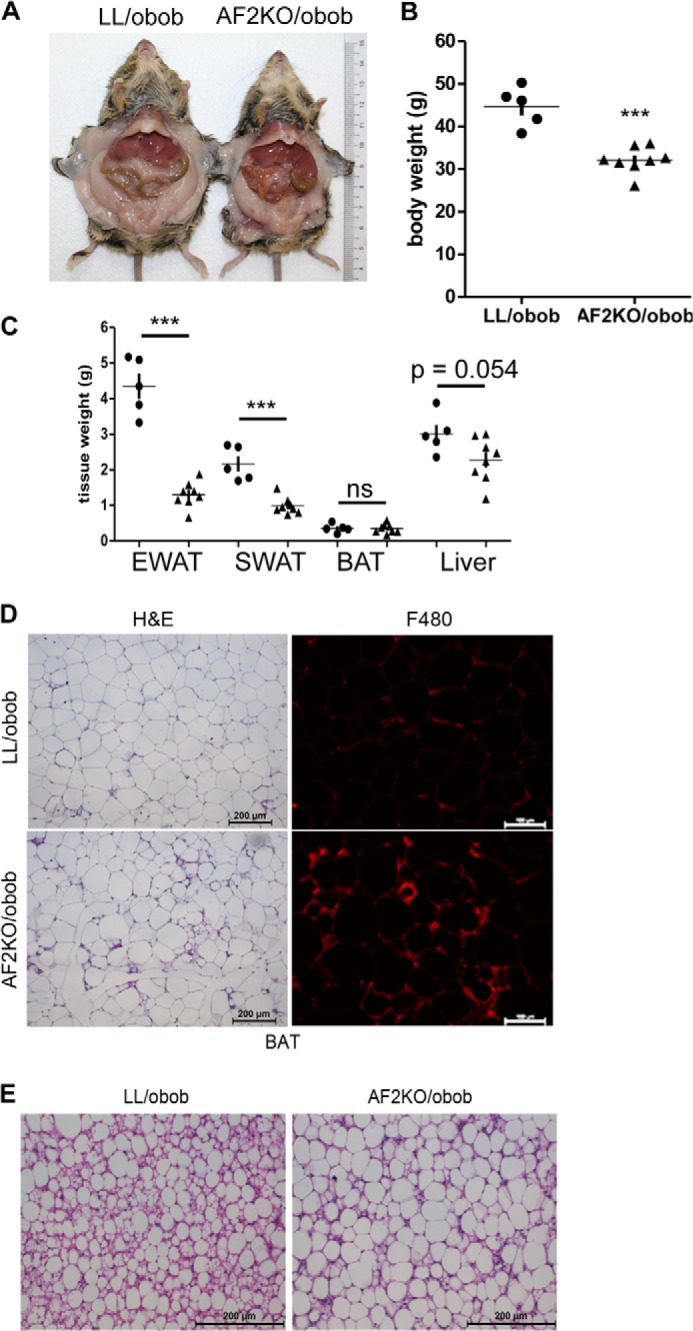
Adipose deficiency of FIT2 in ob/ob mice results in reduced adiposity and unilocular LDs in BAT. A, gross anatomical view of a 10-week-old control (LL/obob) and an adipose-specific FIT2 knock-out mouse on the ob/ob genetic backround (AF2KO/obob) indicates reduced white adipose mass. B, quantification of body weights. C, quantification of wet weights of adipose depots and livers from LL/obob and AF2KO/obob mice. Circles and triangles, L/L and AF2KO, respectively. D, histological sections of EWAT from LL/obob and AF2KO/obob mice stained with H&E or immunolocalization of F4/80. The sections shown for H&E and F4/80 are non-consecutive. E, histological sections of BAT from LL/obob and AF2KO/obob mice stained with H&E show the appearance of larger unilocular LDs in AF2KO BAT than in LL/obob BAT. Data are represented as mean ± S.D. (error bars) (n = 5–8 mice/genotype). ***, p < 0.0001; ns, not significant.
Differentiated Adipocyte Precursors from AF2KO Exhibited Fewer but Larger LDs
To determine whether defects in LD formation could explain the lipodystrophic phenotype in AF2KO mice, we examined the cell-autonomous effects of FIT2 deficiency using preadipocytes from the stromal vascular cell fraction isolated from WAT of AF2KO and L/L control mice. Preadipocytes from AF2KO mice showed no changes in adipocyte differentiation markers relative to L/L control preadipocytes, as indicated by similar levels of PPARγ and PPARγ targets (Fig. 7A). FIT2 was detected at day 4 of differentiation, consistent with the induction of other PPARγ target genes (Fig. 7A). As expected for the aP2-cre driver, FIT2 deficiency was observed by day 4 of differentiation (Fig. 7A). By day 6, when cells were fully differentiated, AF2KO adipocytes had significantly larger LDs relative to L/L control (Fig. 7, B and C). The significant increase in LD size was not associated with differences in total TAG content, TAG biosynthesis, or lipolysis between genotypes, indicating fewer LDs in AF2KO cells (Figs. 7 (C and D) and 8). To assess the ability of AF2KO adipocytes to store excess fatty acids, we challenged them with 1 mm oleic acid starting at day 4 of differentiation, at which time FIT2 is deleted, and quantified LD size and number at day 6, when cells were fully differentiated. Control L/L adipocytes showed an expected increase in LD size and visibly in LD number, whereas AF2KO adipocytes showed an even greater increase in LD size relative to L/L controls (Fig. 7, B and C). Once again, AF2KO cells showed no significant change in total cellular TAG relative to L/L controls, indicating that AF2KO cells produced fewer LDs (Fig. 7, C and D). These findings indicate that FIT2 plays an important role at the cellular level in regulating the number of LDs that are formed but not in TAG biosynthesis, consistent with our previous findings (4).
FIGURE 7.

FIT2 deficiency affects LD size and number in differentiated primary WAT precursor cells. A, primary WAT precursor cells were isolated from L/L and AF2KO littermates and differentiated in vitro into adipocytes. Western blot analysis of FIT2 and other adipocyte markers indicates FIT2 deficiency during differentiation of AF2KO adipocytes but normal expression of other PPARγ adipocyte markers. B, differentiated adipocyte precursor cells were treated with or without oleic acid at day 4, and LDs were stained with BODIPY 493/503 (green) at day 6. Larger and fewer LDs are seen in AF2KO cells than in L/L control cells. Nuclei were stained with Hoechst 33342 (blue). C, quantification of LD size and number (inset) from cells set up in B shows that AFK2O cells produce larger but fewer LDs than L/L control cells. D, quantification of TAG using TLC analysis in cells set up as in B is shown. A.U., arbitrary units. Triplicate experiments are represented as mean ± S.D. (error bars) *, p < 0.01.
FIGURE 8.
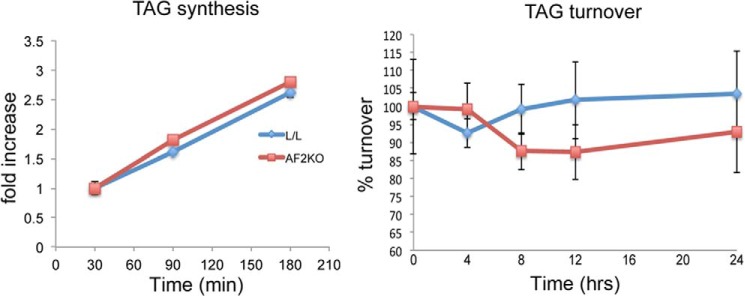
TAG synthesis rates in differentiated WAT precursor cells in culture. WAT precursor cells were differentiated to day 6 and treated with 50 μm [14C]oleate-BSA complex for the times indicated, and radioactive TAG was quantified by TLC and phosphorimaging analysis. Basal TAG turnover (i.e. non-stimulated) was measured in WAT precursor cells differentiated to day 6. Cells were labeled overnight with 50 μm [14C]oleate-BSA and then washed and incubated in fresh medium without radiotracer for the times indicated. Radioactive cellular TAG was quantified by TLC and phosphorimaging analysis. Data are represented as mean ± S.D. (error bars) No significant differences were found.
FIT2 Deficiency in BAT Results in Fewer but Larger LDs
We next examined the consequences of FIT2 deficiency for fat storage in interscapular BAT. BAT is an adipose depot metabolically distinct from WAT in that it exhibits a high capacity to oxidize fatty acids and high rates of uncoupling of oxidative phosphorylation mediated by UCP1 and appears resistant to macrophage infiltration in response to an HFD (21). Examination of BAT histology from 24-week-old L/L mice fed an SD indicated the appearance of numerous LDs per cell (Fig. 9A), a well known phenotype of BAT. In contrast, BAT from 24-week-old AF2KO littermates showed primarily large but few LDs per cell (Fig. 9A). HFD challenge increased the size of LDs in L/L controls and dramatically enhanced the LD phenotype in AF2KO with the appearance of even fewer and larger LDs (Fig. 9A), similar to the LD phenotype of BAT from AF2KO/obob (Fig. 6E). Despite the visible increase in LD size in BAT from AF2KO mice, the concentration of TAG in this tissue did not significantly differ from BAT in L/L mice fed standard diet or HFD (Fig. 9A). Remarkably, this indicates that a deficiency of FIT2 in BAT results in an LD phenotype and not a change in overall TAG storage, suggesting a change in LD formation. To test this idea, primary BAT precursor cells were isolated from AF2KO and L/L littermate controls and differentiated in vitro. As anticipated, differentiated BAT precursor cells from AF2KO mice expressed similar levels of differentiation markers as L/L controls and were deficient in FIT2 (Fig. 9B). Similar to what was found for precursor cells from WAT, BAT cells from AF2KO mice produced significantly fewer but larger LDs without a change in the rate of TAG biosynthesis (Fig. 9, C–E). Taken together, these findings further support the conclusion that FIT2 is required for normal triglyceride storage in adipose depots.
FIGURE 9.

FIT2 deficiency in BAT results in increased size of LDs. A, histological sections of BAT from L/L and AF2KO mice stained with H&E show the appearance of large unilocular LDs in AF2KO BAT. The graph on the right shows the quantification of TAG using TLC analysis in equal amounts of BAT from AF2KO and L/L mice (n = 4 mice/genotype). B, primary BAT precursor cells were isolated from L/L and AF2KO littermates and differentiated in vitro into brown adipocytes. Western blot analysis of FIT2, other PPARγ adipocyte markers, and the BAT cell marker UCP1 indicates FIT2 deficiency in AF2KO adipocytes but normal expression of other PPARγ adipocyte markers and UCP1. A.U., arbitrary units. C, LDs were stained with BODIPY 493/503 (green) at day 6 in differentiated BAT adipocyte precursor cells. Nuclei were stained with Hoechst 33342 (blue). D, quantification of LD size from cells set up in C indicates that AFK2O cells produce larger but fewer LDs than L/L control cells. E, BAT precursor cells were differentiated to day 6 and treated with 50 μm [14C]oleate-BSA complex for the times indicated, and radioactive TAG was quantified by TLC and phosphorimaging analysis. Data are represented as mean ± S.E. (error bars). ***, p < 0.0001.
DISCUSSION
In this study, we show that FIT2 plays an important role in the storage of fat in white and brown adipose tissues. FIT2 deficiency in SWAT and EWAT resulted in progressive lipodystrophy with age in mice fed a standard diet that was markedly accelerated when AF2KO mice were fed an HFD or on the genetically obese ob/ob background, resulting in increased adipocyte death, inflammation, and insulin resistance. Furthermore, preadipocytes isolated from WAT of AF2KO mice produced fewer but larger LDs with or without challenge with exogenous fatty acids. Importantly, we show that BAT and differentiated BAT precursors in culture have increased LD size but decreased LD number without changes in TAG biosynthesis, strongly supporting the conclusion that FIT2 is important for triglyceride storage at the level of regulating LD number and size.
AF2KO mice exhibit a progressive lipodystrophy reminiscent of the phenotype of PPARγ knock-out mice that were previously generated using the same aP2-cre approach (15). A constitutive deletion of PPARγ resulted in severe lipodystrophy (22), whereas deletion using aP2-cre resulted in mice with normal adiposity at a young age but with progressive adipocyte loss with aging that was exacerbated with HFD feeding (15). Under commonly used mouse husbandry conditions, mice exhibit gradual weight gain during aging. This increase in weight gain is probably a result of increased energy intake exceeding expenditure, resulting in a greater demand on WAT to store fat. Our in vivo data indicate that AF2KO mice are able to maintain normal fat storage up to ∼15 weeks of age but lose this capacity at ∼24 weeks of age. The ability of AF2KO mice fed a standard diet to maintain their ability to store fat at an early age might be due to the ability of preexisting LDs to expand to store triglycerides. However, under HFD conditions or during aging when mice have a positive energy balance, AF2KO mice are unable to efficiently store fat in WAT and exhibit adipocyte cell death and macrophage infiltration. Indeed, primary adipocytes from AF2KO mice with or without challenge with exogenous fatty acids exhibited larger but fewer LDs, suggesting that FIT is important in regulating the number of LDs formed in a cell but is not essential for LD formation.
A striking piece of evidence from this study that FIT2 plays a role in regulating LD number or size is our characterization of BAT from AF2KO mice. BAT from standard diet-fed AF2KO mice exhibited a LD phenotype with enlarged but fewer LDs without changes in total TAG levels. This phenotype was recapitulated at the cellular level in differentiated BAT precursors from AF2KO mice, without changes in TAG biosynthesis. The pathophysiological consequences of FIT2 deficiency on WAT and BAT in vivo obviously differed, with WAT exhibiting macrophage infiltration and overall lower tissue mass and volume not seen in BAT from AF2KO mice. This distinction could be due to the high oxidative capacity of BAT that allows these cells to handle excess fatty acids, as well as the relative resistance toward macrophage infiltration (21).
The finding that differentiated adipocyte precursor cells from AF2KO mice had fewer but larger LDs is in direct contrast to our previous finding that RNAi knockdown of FIT2 in 3T3-L1 cells resulted in a significant reduction in total LD and TAG levels. The mechanistic explanation for these differences is that knockdown of FIT2 in 3T3-L1 cells, which were stable knockdown lines, also resulted in a drastic reduction in TAG biosynthesis (4), a phenotype not seen in the current study using primary cells. It is likely that reduced TAG synthesis in stable knockdown of FIT2 in 3T3-L1 cells is a secondary adaptation to constitutive FIT2 deficiency, which is not an issue with the induced knockout driven by aP2-cre in primary cells.
WAT has a distinct cellular architecture arising from a singular, large lipid droplet (i.e. unilocular LD) occupying the majority of the volume of the adipocyte. Recent studies indicate that the generation of unilocular droplets requires the activity of both Fsp27 and Plin1 (23, 24). Fsp27 together with Plin1 have been found to co-localize at contact points between small LDs and large LDs, which results in the smaller LD being absorbed into the larger LD. Fsp27 knock-out mice accumulate small LDs in WAT, and a human mutation in Fsp27 has been identified that results in the appearance of multilocular LDs in WAT, providing strong genetic evidence for the essentiality of Fsp27 in unilocular LD formation. However, the mechanistic details of the process by which unilocular LDs form in adipose tissue and the stages of LD formation are unknown. It is likely that during adipogenesis in vivo, de novo LD formation is the initial step in generating unilocular LDs. Thus, the more de novo LDs that form might dictate in part the size of the unilocular LD that ultimately is generated in adipose tissue. Questions pertaining to the amount of de novo LD formation and LD fusion that is required in vivo for unilocular droplet formation as opposed to LD expansion through other mechanisms remain to be addressed. One such mechanism could be through the de novo synthesis of TAG at the LD. Wilfing et al. (25) have recently demonstrated in non-adipocyte cell types that the enzymes required for TAG synthesis localize to a subpopulation of LDs, thereby allowing for de novo TAG synthesis on the LD and LD expansion; it remains to be determined that this pathway plays a quantitative role in LD expansion in adipocytes.
It is important to note that our findings support the conclusion that FIT2 is not essential for LD formation but is required in vivo for normal storage of TAG and maintenance of metabolic homeostasis. What mechanistic role might FIT2 play in LD formation? Our previously published biochemical studies indicated that FIT2 functions downstream of DGAT enzymes and that purified FIT2 binds directly to TAG that is essential for FIT2-mediated LD formation in cells (6). Based on the current view of LD formation, where a TAG “lens” forms between the leaflets of the ER (3), FIT2 through its ability to bind TAG might increase the solubility of TAG in the ER, leading to accumulation of sufficient TAG to facilitate the process of LD formation. Therefore, FIT2 might be a “gatekeeper” or regulator downstream of TAG biosynthesis that determines the number of nascent LDs that will form. Nevertheless, the current study provides the first proof-of-principle mouse models indicating that FIT2 is essential for normal fat storage.
This work was supported in part by grants from the Singapore Ministry of Health's National Medical Research Council CBRG/0012/2012 (to D. L. S.), the National Research Foundation Singapore under its NRF fellowship Award No. NRF2008NRF-RF001-117 (to H. W.), the Singapore Bioimaging Consortium, from the Agency for Science, Technology and Research (A*STAR) (to V. S. S.), and the National Science Scholarship award (to V. J. G.).
- LD
- lipid droplet
- TAG
- triglyceride
- WAT
- white adipose tissue
- ER
- endoplasmic reticulum
- BAT
- brown adipose tissue
- SWAT
- subcutaneous white adipose tissue
- EWAT
- epididmyal white adipose tissue
- FIT
- fat storage-inducing transmembrane protein
- SD
- standard diet
- HFD
- high fat diet
- FNFL
- Frt-Neo-Frt-Loxp
- PPAR
- peroxisome proliferator-activated receptor
- FCM
- fuzzy c-means.
REFERENCES
- 1. Walther T. C., Farese R. V., Jr. (2012) Lipid droplets and cellular lipid metabolism. Annu. Rev. Biochem. 81, 687–714 [DOI] [PMC free article] [PubMed] [Google Scholar]
- 2. Gray S. L., Vidal-Puig A. J. (2007) Adipose tissue expandability in the maintenance of metabolic homeostasis. Nutr. Rev. 65, S7–S12 [DOI] [PubMed] [Google Scholar]
- 3. Yang H., Galea A., Sytnyk V., Crossley M. (2012) Controlling the size of lipid droplets. Lipid and protein factors. Curr. Opin. Cell Biol. 24, 509–516 [DOI] [PubMed] [Google Scholar]
- 4. Kadereit B., Kumar P., Wang W. J., Miranda D., Snapp E. L., Severina N., Torregroza I., Evans T., Silver D. L. (2008) Evolutionarily conserved gene family important for fat storage. Proc. Natl. Acad. Sci. U.S.A. 105, 94–99 [DOI] [PMC free article] [PubMed] [Google Scholar]
- 5. Gross D. A., Snapp E. L., Silver D. L. (2010) Structural insights into triglyceride storage mediated by fat storage-inducing transmembrane (FIT) protein 2. PloS One 5, e10796. [DOI] [PMC free article] [PubMed] [Google Scholar]
- 6. Gross D. A., Zhan C., Silver D. L. (2011) Direct binding of triglyceride to fat storage-inducing transmembrane proteins 1 and 2 is important for lipid droplet formation. Proc. Natl. Acad. Sci. U.S.A. 108, 19581–19586 [DOI] [PMC free article] [PubMed] [Google Scholar]
- 7. Villanueva C. J., Waki H., Godio C., Nielsen R., Chou W. L., Vargas L., Wroblewski K., Schmedt C., Chao L. C., Boyadjian R., Mandrup S., Hevener A., Saez E., Tontonoz P. (2011) TLE3 is a dual-function transcriptional coregulator of adipogenesis. Cell Metab. 13, 413–427 [DOI] [PMC free article] [PubMed] [Google Scholar]
- 8. Lefterova M. I., Zhang Y., Steger D. J., Schupp M., Schug J., Cristancho A., Feng D., Zhuo D., Stoeckert C. J., Jr., Liu X. S., Lazar M. A. (2008) PPARγ and C/EBP factors orchestrate adipocyte biology via adjacent binding on a genome-wide scale. Genes Dev. 22, 2941–2952 [DOI] [PMC free article] [PubMed] [Google Scholar]
- 9. Soccio R. E., Tuteja G., Everett L. J., Li Z., Lazar M. A., Kaestner K. H. (2011) Species-specific strategies underlying conserved functions of metabolic transcription factors. Mol. Endocrinol. 25, 694–706 [DOI] [PMC free article] [PubMed] [Google Scholar]
- 10. Sun L., Xie H., Mori M. A., Alexander R., Yuan B., Hattangadi S. M., Liu Q., Kahn C. R., Lodish H. F. (2011) Mir193b-365 is essential for brown fat differentiation. Nat. Cell Biol. 13, 958–965 [DOI] [PMC free article] [PubMed] [Google Scholar]
- 11. Li C., Xu C., Gui C., Fox M. D. (2010) Distance regularized level set evolution and its application to image segmentation. IEEE Trans. Image Process. 19, 3243–3254 [DOI] [PubMed] [Google Scholar]
- 12. Lankton S., Tannenbaum A. (2008) Localizing region-based active contours. IEEE Trans. Image Process. 17, 2029–2039 [DOI] [PMC free article] [PubMed] [Google Scholar]
- 13. Bezdek J. C., Coray C., Gunderson R., Watson J. (1981) Detection and characterization of cluster substructure. 1. Linear structure: fuzzy C-lines. Siam. J. Appl. Math. 40, 339–357 [Google Scholar]
- 14. Gross D. A., Snapp E. L., Silver D. L. (2010) Structural insights into triglyceride storage mediated by fat storage-inducing transmembrane (FIT) protein 2. PLoS One 5, e10796. [DOI] [PMC free article] [PubMed] [Google Scholar]
- 15. He W., Barak Y., Hevener A., Olson P., Liao D., Le J., Nelson M., Ong E., Olefsky J. M., Evans R. M. (2003) Adipose-specific peroxisome proliferator-activated receptor γ knockout causes insulin resistance in fat and liver but not in muscle. Proc. Natl. Acad. Sci. U.S.A. 100, 15712–15717 [DOI] [PMC free article] [PubMed] [Google Scholar]
- 16. Savage D. B. (2009) Mouse models of inherited lipodystrophy. Dis. Model. Mech. 2, 554–562 [DOI] [PubMed] [Google Scholar]
- 17. Li P., Lu M., Nguyen M. T., Bae E. J., Chapman J., Feng D., Hawkins M., Pessin J. E., Sears D. D., Nguyen A. K., Amidi A., Watkins S. M., Nguyen U., Olefsky J. M. (2010) Functional heterogeneity of CD11c-positive adipose tissue macrophages in diet-induced obese mice. J. Biol. Chem. 285, 15333–15345 [DOI] [PMC free article] [PubMed] [Google Scholar]
- 18. Mottillo E. P., Shen X. J., Granneman J. G. (2007) Role of hormone-sensitive lipase in β-adrenergic remodeling of white adipose tissue. Am. J. Physiol. Endocrinol. Metab. 293, E1188–E1197 [DOI] [PubMed] [Google Scholar]
- 19. Patsouris D., Neels J. G., Fan W., Li P. P., Nguyen M. T., Olefsky J. M. (2009) Glucocorticoids and thiazolidinediones interfere with adipocyte-mediated macrophage chemotaxis and recruitment. J. Biol. Chem. 284, 31223–31235 [DOI] [PMC free article] [PubMed] [Google Scholar]
- 20. Glass C. K., Olefsky J. M. (2012) Inflammation and lipid signaling in the etiology of insulin resistance. Cell Metab. 15, 635–645 [DOI] [PMC free article] [PubMed] [Google Scholar]
- 21. Kajimura S., Seale P., Spiegelman B. M. (2010) Transcriptional control of brown fat development. Cell Metab. 11, 257–262 [DOI] [PMC free article] [PubMed] [Google Scholar]
- 22. Duan S. Z., Ivashchenko C. Y., Whitesall S. E., D'Alecy L. G., Duquaine D. C., Brosius F. C., 3rd, Gonzalez F. J., Vinson C., Pierre M. A., Milstone D. S., Mortensen R. M. (2007) Hypotension, lipodystrophy, and insulin resistance in generalized PPARγ-deficient mice rescued from embryonic lethality. J. Clin. Invest. 117, 812–822 [DOI] [PMC free article] [PubMed] [Google Scholar]
- 23. Sun Z., Gong J., Wu H., Xu W., Wu L., Xu D., Gao J., Wu J. W., Yang H., Yang M., Li P. (2013) Perilipin1 promotes unilocular lipid droplet formation through the activation of Fsp27 in adipocytes. Nat. Commun. 4, 1594. [DOI] [PMC free article] [PubMed] [Google Scholar]
- 24. Grahn T. H., Zhang Y., Lee M. J., Sommer A. G., Mostoslavsky G., Fried S. K., Greenberg A. S., Puri V. (2013) FSP27 and PLIN1 interaction promotes the formation of large lipid droplets in human adipocytes. Biochem. Biophys. Res. Commun. 432, 296–301 [DOI] [PMC free article] [PubMed] [Google Scholar]
- 25. Wilfling F., Wang H., Haas J. T., Krahmer N., Gould T. J., Uchida A., Cheng J. X., Graham M., Christiano R., Fröhlich F., Liu X., Buhman K. K., Coleman R. A., Bewersdorf J., Farese R. V., Jr., Walther T. C. (2013) Triacylglycerol synthesis enzymes mediate lipid droplet growth by relocalizing from the ER to lipid droplets. Dev. Cell 24, 384–399 [DOI] [PMC free article] [PubMed] [Google Scholar]
- 26. Jaworksi K., Ahmadian M., Duncan R. E., Sarkadi-Nagy E., Varady K. A., Hellerstein M. K., Lee H. Y., Samuel V. T., Shulman G. I., Kim K. H., de Val S., Kang C., Sul H. S. (2009) AdPLA ablation increases lipolysis and prevents obesity induced by high-fat feeding or leptin deficiency. Nat. Med. 15, 159–168 [DOI] [PMC free article] [PubMed] [Google Scholar]