

Background: Fibroblast growth factor-receptor-heparan sulfate (FGF-HS-FGFR) signals cell proliferation.
Results: HS synthesized with sulfated domains at its non-reducing ends actively promotes cellular proliferation in a three-dimensional cell microarray.
Conclusion: A symmetric 2:2:2 FGF-HS-FGFR complex is preferred over an asymmetric 2:1:2 model by these data.
Significance: This paper suggests a preference for symmetry in the signal transduction complex having two FGF-FGFR on the non-reducing end of two HS chains.
Keywords: Fibroblast Growth Factor (FGF), Fibroblast Growth Factor Receptor (FGFR), Glycosaminoglycan, Heparan Sulfate, Polysaccharide, Three-dimensional Cellular Printing, Block Copolymers, Fibroblast Growth Factors, Signaling Complex
Abstract
Four well-defined heparan sulfate (HS) block copolymers containing S-domains (high sulfo group content) placed adjacent to N-domains (low sulfo group content) were chemoenzymatically synthesized and characterized. The domain lengths in these HS block co-polymers were ∼40 saccharide units. Microtiter 96-well and three-dimensional cell-based microarray assays utilizing murine immortalized bone marrow (BaF3) cells were developed to evaluate the activity of these HS block co-polymers. Each recombinant BaF3 cell line expresses only a single type of fibroblast growth factor receptor (FGFR) but produces neither HS nor fibroblast growth factors (FGFs). In the presence of different FGFs, BaF3 cell proliferation showed clear differences for the four HS block co-polymers examined. These data were used to examine the two proposed signaling models, the symmetric FGF2-HS2-FGFR2 ternary complex model and the asymmetric FGF2-HS1-FGFR2 ternary complex model. In the symmetric FGF2-HS2-FGFR2 model, two acidic HS chains bind in a basic canyon located on the top face of the FGF2-FGFR2 protein complex. In this model the S-domains at the non-reducing ends of the two HS proteoglycan chains are proposed to interact with the FGF2-FGFR2 protein complex. In contrast, in the asymmetric FGF2-HS1-FGFR2 model, a single HS chain interacts with the FGF2-FGFR2 protein complex through a single S-domain that can be located at any position within an HS chain. Our data comparing a series of synthetically prepared HS block copolymers support a preference for the symmetric FGF2-HS2-FGFR2 ternary complex model.
Introduction
Glycosaminoglycans (GAGs)2 are linear acidic polysaccharides that are commonly located on the cell membrane or in the extracellular matrix (1–4). Most GAGs are biosynthesized in the Golgi on a core protein, and the resulting proteoglycans (PGs) exhibit a wide variety of critical biological activities through their interaction with cell membrane and extracellular proteins (5–8). An important family of GAGs and PGs is the heparan sulfates (HS), which play critical roles in cellular signaling through their interaction with heparin (HP, a highly modified HS-type GAG)-binding proteins (8).
HS/HP, extracted from natural animal tissues, are large (Mr >10 kDa), polydisperse (for Mr 10–30 kDa, polydispersity values of 1.2–1.6), and microheterogenous (possessing multiple domains and variable saccharide sequences) (9–12), complicating the study of their structure-activity relationship with regard to their protein-mediated activities. Many structure-activity relationship studies rely on natural HS/HP, some rely on chemically modified HS/HP, and some rely on HS/HP oligosaccharides either enzymatically prepared or chemically or chemoenzymatically synthesized (13–16). However, natural HS/HPs have highly variable compositions and sequences, and only a very limited number of chemically modified HS/HP chains can be reliably prepared. Structurally defined HS/HP oligosaccharides are often too small to exhibit many important biological activities.
HS/HP polymerizing and modifying enzymes have been identified, cloned, expressed, and utilized for reactions in vitro (17–23). The backbones of these GAG chains can be efficiently and controllably synthesized in vitro using GAG synthases to add the monosaccharide units from UDP-sugar donors onto an acceptor or primer sugar (Fig. 1). When building GAGs from natural or non-natural (modified) UDP-sugars (24), in vitro GAG chain synthesis can be performed in one of two preferred formats: stepwise elongation (i.e. one sugar unit at a time) or in a synchronized polymerization reaction. Although both of these formats yield well defined products with narrow size distributions (monodisperse or nearly so) and potentially more controllable compositions than the GAG produced in vivo, it remains challenging to produce large GAG chains (Mr > 5) through stepwise elongation (16, 25–27).
FIGURE 1.

Synthesis of di-block and tri-block HS copolymer using a chemoenzymatic approach. A, a recombinant catalyst composed of parts of both PmHS1 and -2 heparosan synthases, Chimera G, drives the elongation of a short acceptor into the first ∼8-kDa molecular mass section of the block copolymer with either protection (R = TFA) or acetylation (R = CH3CO) at the amine position of the glucosamine residue. B, after this first series of elongations, a second elongation, of the initial ∼8 kDa polymer to a total molecular mass of ∼16 kDa, is done to form a di-block copolymer. In the second series, the R′ modification of the amine residue is the reverse of the R-group in the first series. C, for tri-block copolymers, a final elongation was performed to a total molecular mass of ∼24 kDa, with R-groups identical to the first series. After the synthesis of these block copolymers, the substrates were de-NTFA-protected and N-sulfonated. Finally, the di-block and tri-block copolymers underwent treatment with C5-epimerase/2-O sulfotransferase (C5-Epi, 2-OST) and 6-O sulfotransferase isoform 1 and 3 (6-OST-1,3) in sequential steps. The sulfonated di-block and tri-block copolymers were ∼20 and 30 kDa in molecular mass, respectively (see Fig. 3B for their structures).
During HS/HP biosynthesis, the heparosan backbone, [→4)-β-d-GlcA(1→4)-α-d-GlcNAc(1→] (where GlcA is glucuronic acid and GlcNAc is N-acetylglucosamine), is modified through the action of N-deacetylase, N-sulfotransferases, introducing N-sulfo groups, C5-epimerase, which converts GlcA into iduronic acid, and O-sulfotransferases, which transfer sulfo groups from the donor 3′-phosphoadenosine-5′-phosphosulfate to the various hydroxyl groups of the GAG. These biosynthetic enzymes have been identified, cloned, and expressed (18–20, 28–31).
HS/HP regulate the activity of the 22-member family of extracellular fibroblast growth factors (FGFs) involved in critically important cellular activities including angiogenesis, cellular proliferation, cellular motility, differentiation (32–34), and adhesion (35, 36). The FGFs signal through their cognate membrane-bound fibroblast growth factor receptors (FGFRs), a group of seven distinct protein receptors (37–39). Kinetic experiments using surface plasmon resonance suggest that two extracellular FGFs first bind to the HS chain(s) of membrane-anchored HSPGs and then recruit two FGFRs to assemble into a signaling complex (40). Assembly of an FGF-HS-FGFR ternary complex (41) then activates signaling across the transmembrane helix, which then activates the intracellular tyrosine kinase domain (42). The individual binding affinities of the HS chains for FGFs and FGFRs have been determined, but the actual structure of the ternary complex remains unclear (40, 43–47). The dimeric protein complex, FGF2-FGFR2, forms a positively charged canyon of basic amino acid residues that interacts with one or two complementary negatively charged HS chains with high (nm range) affinity (38, 48, 49). A major point of contention regarding the formation of the FGF-HS-FGFR ternary complex is whether its structure is symmetric (50) or asymmetric (51); there are several conflicting lines of experimental evidence (potentially due to methodological artifacts and/or investigator interpretations). The symmetric ternary complex has a 2:2:2 stoichiometry (Fig. 2A), whereas the asymmetric complex has a 2:1:2 (FGF-HS-FGFR) stoichiometry (Fig. 2B). A better understanding of the molecular interactions between HS, FGF, and FGFR is of importance as this will be helpful in designing small molecule signal transduction inhibitors. Previously, investigation into the complex mechanism showed that highly sulfated non-reducing ends of heparan sulfate domain bind with higher affinity and are more biologically active in FGF2-FGFR1 complexes (52).
FIGURE 2.
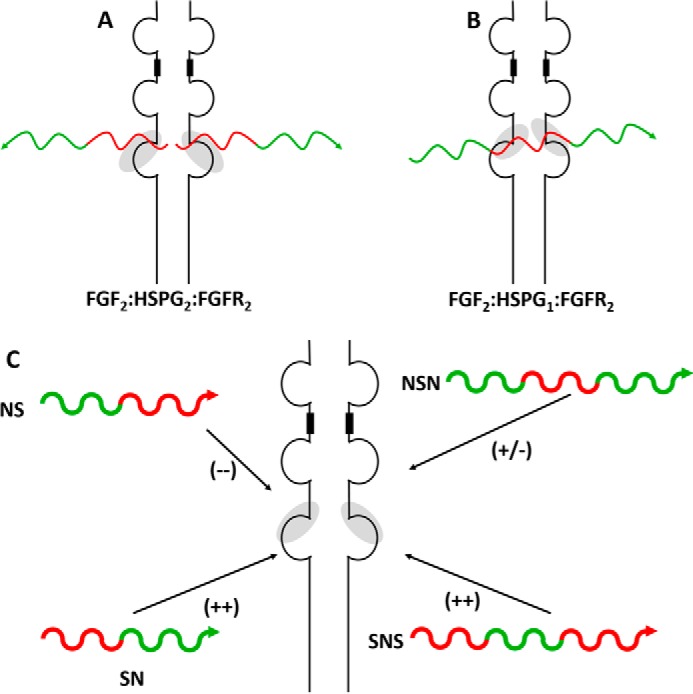
The formation of the FGF, HS, and FGFR ternary complex has previously been described by two unique mechanisms. A, the FGF2-HS2-FGFR2 model was first described by Schlessinger et al. (50) and describes a model in which the non-reducing end of two HSPGs interacts with dimeric complex of FGF2-FGFR2 to complete the ternary complex and initiate cell signaling. B, in the Pellegrini model (51), only a single molecule of HS is required for interaction with the FGF2-FGFR2 dimeric complex. In this model, the domain specificity of the sulfation pattern was less significant, as the whole HS chain was considered in the ternary complex. C, a goal of the current work is to test the domain sulfation pattern (red = high sulfation; green = low sulfation) of HS against cellular proliferation promoted by the formation of the FGF-HS-FGFR ternary complex. Each HS block copolymer is unique, in that is contains only reducing end sulfation (NS), only non-reducing end sulfation (SN), sulfation of both ends (SNS), or sulfation of neither (NSN). The arrows at the end of these substrates indicate the reducing end of the substrate. The + and − shown in the parentheses indicate the relative strength of signaling shown by each HS block copolymer.
The current study addresses this critical structural biology question by using a chemoenzymatic method (23) to synthesize several HS GAG chains having defined domain structures. These HS GAG chains were probed in a three-dimensional cell-based microarray using soluble FGFs and murine immortalized bone marrow (BaF3) cells developed by Ornitz and Itoh (38) and Ornitz and Leder (49) that express a single FGFR type and are completely devoid of HSPGs and FGFs; the assay output of cellular proliferation was measured to assess the ternary complex signaling process.
EXPERIMENTAL PROCEDURES
Materials
BaF3 cells, expressing the fibroblast growth factor receptor 1c, 2c, and 3c, (FGFR1c, FGFR2c, and FGFR3c), were generously provided by Dr. David M. Ornitz of Washington University, St. Louis, MO. Fibroblast growth factor 1 (FGF1), fibroblast growth factor 2 (FGF2), and fibroblast growth factor 7 (FGF7) were purchased from Invitrogen. RPMI 1640 media was purchased from MediaTech (Manassas, VA). Fetal bovine serum (FBS), penicillin/streptomycin solution (PenStrep), sterile phosphate-buffered saline (PBS), Geneticin (G418), and interleukin-3 (IL3) were purchased from Invitrogen. Sterile polycarbonate 125-ml Erlenmeyer flasks were purchased from VWR (Radnor, PA). 3-(4,5-Dimethylthiazol-2-yl)-2,5-diphenyltetrazolium bromide ((MTT), UDP-GlcA, UDP-GlcNAc, and Breathe EZ breathable membrane as well as the remaining fine chemicals were purchased from Sigma unless otherwise noted. HS disaccharide standards (Iduron, Manchester UK) had the structures: ΔUA (1→4) GlcNAc (di0S); ΔUA 2S (1→4) GlcNAc; ΔUA (1→4) GlcNAc6S (di6S); ΔUA 2S (1→4) GlcNAc6S (di2S6S); ΔUA (1→4) GlcNS (diNS); ΔUA 2S (1→4) GlcNS (diNS2S); ΔUA 2S (1→4) GlcNS (diNS2S); ΔUA (1→4) GlcNS6S (diNS6S); and ΔUA 2S (1→4) GlcNS6S (diTriS, where ΔUA is 4-deoxyl-α-l-threo-lex-4-eno-pyranosyl uronic acid, GlcN is glucosamine, and S is sulfo and Ac is acetyl).
Recombinant human C5-epimerase (NCBI:NM_015554.1), hamster 2-O-sulfotransferase (GenBankTM: D88811.1), murine 6-O-sulfotransferase 1 (NCBI:NM_015818.2), and murine 6-O-sulfotransferase 3 (NCBI:NM_015820.3) were each expressed as a form of maltose-binding protein fusion protein. The expression of these enzymes were carried out in Escherichia coli and purified by an amylose-agarose column (New England Biolabs) as previously described (53).
Block Polysaccharide Synthesis
Polysaccharides containing alternating blocks of GlcNAc- and GlcN-trifluoroacetamide (TFA)-based repeats were synthesized by a series of successive addition reactions as described (54). Reaction buffer contained 50 mm Tris, pH 7.2, and 1 mm MnCl2. Each stage was incubated at 30 °C for 16 h. The first reaction had 400-μm heparosan tetrasaccharide (GlcA-GlcNAc-GlcA-anhydromannitol) as an acceptor. All reactions received 10 mm UDP-GlcA and, depending on the desired block, either 10 mm UDP-GlcNAc or 10 mm UDP-GlcNTFA (for preparing the N- or S-domain, respectively) (15, 16) Each reaction received 0.5 μg/μl purified Chimera G enzyme. This enzyme, PmHS2(1–167)PmHS1(134–318)PmHS2(353–651), was selected as the catalyst for blocking polysaccharide synthesis because it exhibits at least a 10- and 2-fold higher specific activity using UDP-GlcNAc and UDP-GlcNTFA when compared with PmHS2, respectively. Also, Chimera G is roughly twice as acceptor-dependent as PmHS2 due to a lower level of de novo synthesis. After each step, polysaccharide products were purified from the unincorporated UDP-sugars and UDP using ultrafiltration (Amicon Ultra 3,000 molecular weight cut-off (MWCO); Millipore, Billerica, MA) using three 500-μl distilled water rinses at 14,000 × g for 10 min each. These polysaccharide intermediates were then used as acceptor (as noted) in reactions where the hexosamine donors were alternated (e.g. after GlcNAc was added in first block, UDP-GlcNTFA was then employed) as indicated to produce di-block or tri-block polysaccharide products. After a final ultrafiltration step, the protein was removed by chloroform extraction. Each block was determined to be ∼8 kDa (or ∼40 saccharide units) based on polyacrylamide gel/Alcian blue staining analyses (thus, the di-block and tri-block polymers were ∼16 and 24 kDa, respectively).
De-trifluoracetylation and N-Sulfonation
N-Sulfonation of block copolymers was performed according to a modified procedure from Maruyama et al. (55) using NMe3·SO3 as the sulfonating agent. Briefly, the N-trifluoroacetylated block copolymer was dissolved in a solution of MeOH/H2O/Et3N = 1/1/0.5 at a concentration of 1 mg/ml and stirred overnight at room temperature to expose the amine functionality protected by the TFA group. The de-N-trifluoroacetylated block co-polymer was then loaded onto a 3000-MWCO Amicon Ultra spin unit (Millipore) and washed with distilled H2O 3× for 10 min at 14,000 × g. The retentate containing the de-N-trifluoroacetylated block copolymer was recovered and lyophilized. The lyophilized polysaccharide was then dissolved in distilled H2O (1 mg/ml) at pH 7. To this solution, 3-times the amount of polysaccharide of Na2CO3 and NMe3·SO3 (e.g. 3 mg of Na2CO3 and NMe3·SO3 for 1 mg of starting polysaccharide) was added and stirred for 12 h at 45 °C. A second portion of the same amount of Na2CO3 and NMe3·SO3 was added to the solution and stirred for 12 h at 45 °C. The reaction mixture was loaded onto a 3000-MWCO Amicon Ultra spin unit and washed with distilled H2O 3× for 10 min at 14,000 × g. The retentate containing the N-sulfonated polysaccharide was recovered and lyophilized to afford a white fluffy powder.
Characterization of HS Block Copolymer Intermediates by Polyacrylamide Gel Electrophoresis (PAGE) and NMR
Analysis of the resulting block copolymers using PAGE (56) confirmed that the polymer backbone remained intact after the de-N-trifluoroacetylation and N-sulfonation reactions. The four block co-polymers were also characterized by one-dimensional 1H nuclear magnetic resonance (NMR) spectroscopy after the chemical N-sulfonation step. All samples were dissolved in 400 μl of D2O (99.9%, Sigma) and lyophilized 3 times to remove the exchangeable protons. The samples were redissolved in 400 μl of D2O and transferred to NMR microtubes. All NMR experiments were performed at 298 K on Bruker Advance II 600 MHz with Topspin 2.1.6 software. One-dimensional 1H spectra were recorded for 32 scans.
Enzymatic O-Sulfonation
The N-sulfonated polysaccharide backbones were subjected to the modifications of C5-epimerase, 2-O-sulfotransferase, and 6-O-sulfotransferase 1 and 6-O-sulfotransferase 3 to introduce iduronic acid residues 2-O-sulfo groups and 6-O-sulfo groups, respectively. For the C5-epimerase and 2-O-sulfotransferase modifications, the reaction was carried out in a one-pot format. Briefly, the backbone polysaccharides (0.1 mg/ml) were incubated with C5-epimerase (0.2 mg/ml) in a buffer containing 1 mm CaCl2 and 50 mm MES, pH 7.0, at 37 °C. After 30 min of incubation, 2-O-sulfotransferase (0.1 mg/ml) and 3′-phosphoadenosine-5′-phosphosulfate (100 μm) was added to the reaction mixture. The reaction mixture was then incubated at 37 °C overnight. The product was purified using DEAE column chromatography as described previously (15). After 2-O-sulfonation, the product (0.1 mg/ml) was further modified with 6-O-sulfotransferase 1 (0.1 mg/ml) and 6-O-sulfotransferase 3 (0.1 mg/ml) in 50 mm MES, pH 7.0, and 3′-phosphoadenosine-5′-phosphosulfate (100 μm) at 37 °C overnight. The 6-O-sulfonated products were also purified through a DEAE column.
Disaccharide Compositional Analysis of Intermediate and Block Copolymers Products by Using Liquid Chromatography (LC)-Mass Spectrometry (MS)
The disaccharide compositions of block co-polymers were analyzed by high performance liquid chromatography-mass spectrometry (57). Briefly, the block copolymers (5 μg) were incubated with a mixture of heparin/HS lyase I, II, and III (10 milliunits each) at 37 °C for 10 h. The digested disaccharides were recovered by passing through a 30,000-MWCO Amicon Ultra spin unit at 12,000 × g for 10 min. The flow-through containing the disaccharides was lyophilized recovered. The lyophilized disaccharides were labeled with 2-aminoacridone (AMAC) by reductive amination as described previously (57). The AMAC-tagged disaccharides were subjected to LC-MS analysis. A standard curve (intensity as a function of amount injected was constructed for each AMAC-labeled disaccharide standard) was prepared and used to calculate a response factor for each from which the disaccharide compositions of the block copolymers were determined.
Cellular Proliferation
BaF3 (murine immortalized bone marrow cells) were grown in RPMI 1640 medium supplemented with 10% FBS, 5 ml of PenStrep (Invitrogen), and 50 μm β-mercaptoethanol and 400 μg/ml G418 to the solution as previously described (38, 49). In the absence of FGF and GAG combination, BaF3 cells can be grown with the addition of 1 ng/ml murine IL3 (Invitrogen) to the solution. Cells were grown under 37 °C and 5% CO2 incubating conditions and shaken at 125 rotations per minute (rpm). Cells were passaged every 3 days, with initial seeding densities of 2 × 10⁵ cells/ml.
Before experimentation, cells were centrifuged at 200 × g for 5 min, spent media were removed through vacuum aspiration, and the cell pellet was washed with 5 ml of IL3-free RPMI media. The centrifugation and washing step were repeated four times to remove any residual IL3. After the final centrifugation, the cell pellet was resuspended to 5 × 10⁶ cells/ml in RPMI media.
BaF3 Cell Assay in a 96-Well Plate
A fraction of the 5 × 10⁶ cells/ml in RPMI media was further diluted to 2.2 × 10⁵ cells/ml in RPMI media supplemented with G418. The cell suspension was added to a clear, U-bottom 96-well plate such that the initial density of cells was ∼20,000 cells per well. FGF solution and GAG solutions were added to the appropriate wells at a final concentration of 5 nm and 1 μg/ml, respectively, consistent with concentrations used for other heparan sulfate-FGF interaction studies (38, 49). Negative control contained PBS added to the well in place of GAG solution. The 96-well plates were covered with a Breathe EZ breathable membrane and incubated at 37 °C/5% CO2/125 rpm for ∼40 h.
After this period, the growth rate was quantified by the MTT method. Briefly, 50 μl of 2.5 mg/ml MTT was added to each well and incubated at 37 °C/5% CO2/125 rpm for 3 h. After the incubation period the plate was centrifuged at 200 × g for 5 min to pellet the tetrazolium crystals at the bottom of the well. MTT reagent and media were carefully removed from each well as to not disturb the tetrazolium crystal pellet. The crystal pellet was then dissolved by the addition of 150 μl DMSO to each well. The plate was gently shaken at 75 rpm for 45 min.
The 96-well plate was then read using a SpectraMax plate reader with absorbance measured at 590 and at 690 nm. Absorbance values were compared against a standard curve of absorbance values and corresponding cell counts. The cell count of the negative control conditions (without any GAG) was considered to be “zero growth” (i.e. the cell density should be equivalent to the seeding density). The cell count for wells containing both FGF and heparin under otherwise identical conditions was considered to be “100% cell growth.” The “relative cell growth” of all other GAG condition was based upon the heparin and the GAG-free controls.
Three-dimensional Chip-based Growth
The method to prepare and print three-dimensional cell-based microarray slides were similar to those previously described (58–60). Poly(styrene co-malic anhydride) (Sigma) was dissolved in toluene at 1% w/v. Once the poly(styrene co-malic anhydride) was completely dissolved, the solution was further diluted to 0.1% w/v. The poly(styrene co-malic anhydride) solution was then spin-coated onto acid-washed microscope slides using a Laurell Technologies (North Wales, PA) WS-400B spin-coater. The poly(styrene co-malic anhydride)-coated slides were dried at room temperature overnight. A freshly prepared solution of 0.1 mm BaCl2 and poly-l-lysine solution (0.1% w/v) was mixed (1:2) and microarrayed (spotted) onto the slide in a 2 × 4-block pattern, with a 6 × 8 spot array in each block, using MicrosSys 5100–4SQ microcontact microarray spotter (Digilab, Inc., Marlborough, MA). The BaCl2/poly-l-lysine arrayed slide was left to dry for ∼1 h. Next, BaF3 cells in RPMI media (supplemented with 10% FBS, penicillin-streptomycin, β-mercaptoethanol, and G418) were mixed with a 3% alginate solution in a 2:1 ratio. The cell/alginate solution was arrayed (30 nl/spot) onto the dried BaCl2/poly-l-lysine spots under humidified conditions. The spots were incubated for 2 min to allow the complete formation of the cross-linked hydrogel. An 8-well, medium chamber (Nunc Lab-Tek II) was applied to the surface of the slide to isolate each unique 6 × 8 array. RPMI media containing various growth factor/HS block copolymer combinations were gently added to appropriate chambers. The slides were incubated for 48 h at 37 °C and 5% CO2.
After complete incubation, the microarrayed slides were removed from the incubator, the 8-well chamber was removed, and each slide was washed with 20 mm CaCl2, 140 mm NaCl, pH 7.0, buffer for 5 min. This washing step was repeated an additional two times. After the washes, the slides were stained with a calcein/ethidium homodimer live/dead assay kit (Invitrogen) for 45 min. Slides were subsequently washed for two 15-min periods with the CaCl2/NaCl buffer before being left to dry overnight.
RESULTS
Block Copolymer Elongation and Formation
The identity and the placement of the various domains within the block copolymer was controlled by the choice of the UDP-hexosamine, either UDP-GlcNAc or UDP-GlcNTFA, employed in any given polymerization step with UDP-GlcA. All of the potential bipartite and tripartite combinations were prepared, namely NAc-NTFA, NTFA-NAc, NAc-NTFA-NAc, and NTFA-NAc-NTFA, where NAc = a GlcNAc-containing block, and NTFA = a GlcNTFA-containing block. The blocks were completely homogeneous with respect to the incorporated hexosamine (with the exception of reducing terminal NTFA blocks due to the contribution of the initial heparosan tetrasaccharide acceptor, an oligosaccharide with a single intact GlcNAc residue, used to prime the entire process) because after each sequential elongation step, any remaining unused UDP-sugar was removed by ultrafiltration from the polymeric product before switching UDP-hexosamine precursor (e.g. from UDP-GlcNAc to UDP-GlcNTFA) for the next step.
The length of each domain was controlled by the stoichiometry of the acceptor (at first the tetrasaccharide, then the product block) versus the UDP-sugar donors. In the current study we selected an ∼8-kDa or ∼40-saccharide unit blocks due to their ability to bind well to FGF and FGFR. The molecules are quasi-monodisperse due to the synchronization of the synthase-catalyzed polymerization reaction with acceptor as described (25).
Glucosamine De-N-trifluoracetylation/sulfonation
UDP-GlcNTFA was utilized efficiently as a donor substrate by GAG synthases. Once the block co-polymer chains were synthesized with the desired NAc-NTFA domains, the NTFA groups were deprotected and subsequently N-sulfonated. Each block co-polymer was dissolved in a mildly basic solution of Et3N, MeOH, and H2O and stirred overnight. Under these conditions the NTFA group was deprotected to release a free amino group, which was subsequently sulfonated using a sulfonating reagent (NMe3·SO3) to afford the N-sulfonated block co-polymers. The sizes of the resulting di-block and tri-block copolymer intermediates, examined using PAGE (Fig. 3A), were consistent with those expected based on their synthesis. The structure of each block copolymer is presented in Fig. 3B.
FIGURE 3.

Polyacrylamide gel electrophoresis of the final block copolymer products and their structures. A, PAGE analysis shows six lanes, a heparin decasaccharide standard, a mixture of heparin-derived oligosaccharide standards, and the SN, NS, NSN and SNS block copolymers. B, the chemical structures of the HS block copolymer final products are shown with their sulfo groups highlighted in yellow and the carboxyl groups of their iduronic acid residues highlighted in pink. The letters a, b, and c correspond to the repeat number of disaccharides in each block.
One-dimensional 1H NMR was used to evaluate the structure of each N-sulfonated block co-polymer intermediates (Fig. 4). The conversion of the GlcNTFA residue to GlcNS residue was confirmed by the change in chemical shift of the anomeric proton (H1) signal. NMR spectra of all block co-polymers show two signals in the anomeric region of 5∼6 ppm. The signal at ∼5.6 and ∼5.3 ppm corresponds to the anomeric proton of GlcNS and GlcNAc, respectively. Incomplete N-sulfonation would be indicated by a peak at ∼5.5 ppm, but such a signal cannot be seen in the spectra. The NAc group of GlcNAc remained intact as indicated by the anomeric signal and the acetyl (-CH3) peak at ∼2.0 ppm. Taken together, the NMR data indicate that the block co-polymers were successfully N-sulfonated.
FIGURE 4.
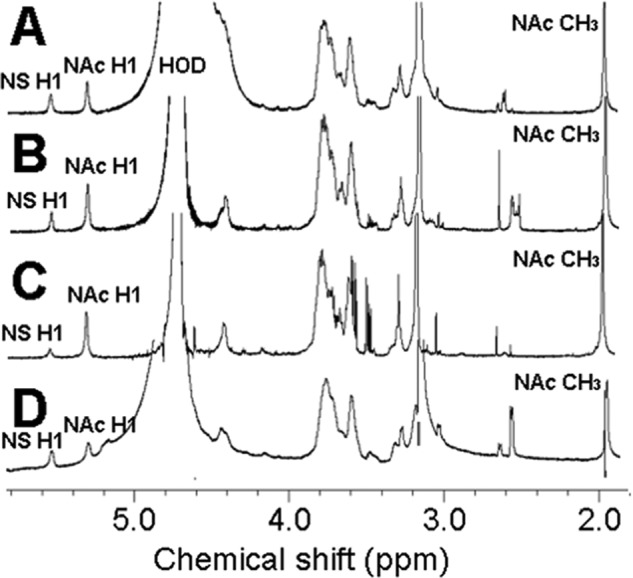
1H NMR spectra of block copolymer intermediates afforded after N-de-trifluoroacetylation and N-sulfonation. A, SN; B, NS; C, NSN; and D, SNS.
Disaccharide Composition
The disaccharide composition of each of the HS copolymer intermediates was next determined by exhaustively treating each with heparin lyases, labeling with AMAC and performing LC-MS. The resulting total ion chromatogram obtained by LC-MS analysis showed only 0S and NS disaccharides associated with each of the HS block copolymers (Fig. 5, B–E). After compensating for the different response factors for these disaccharides, the ratio of the two di-block copolymers, SN and NS, were 1:1 di0S:diNS, and the ratio of the two tri-block copolymers, NSN and SNS, were 1:2 and 2:1 di0S:diNS, respectively.
FIGURE 5.
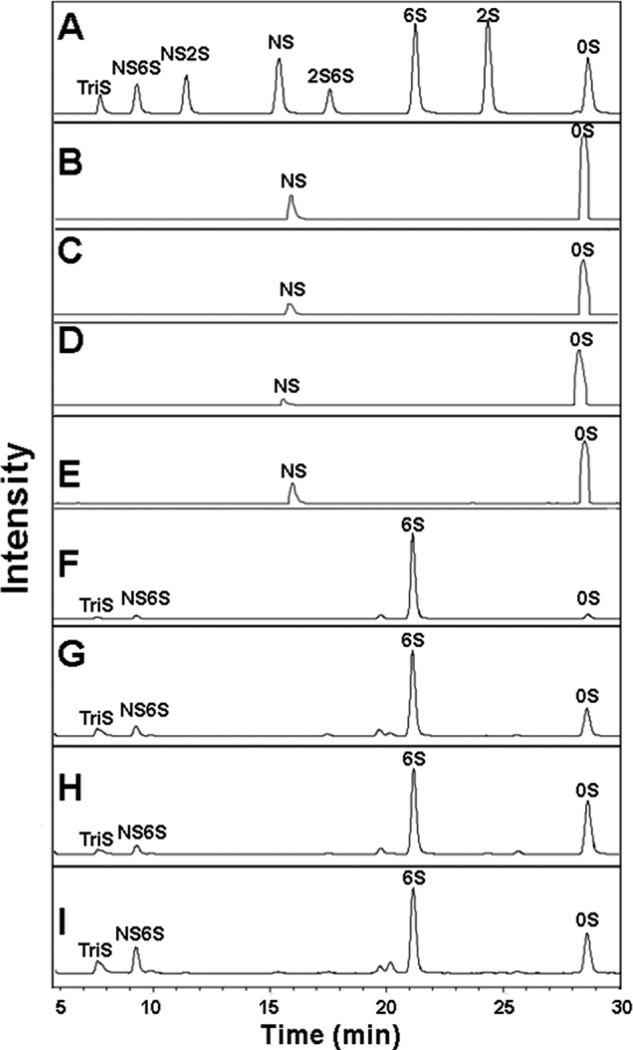
LC-MS analysis of AMAC-labeled disaccharides prepared from block copolymer intermediates (before O-sulfotransferases and C5-epimerase treatment) and final products (after O-sulfotransferases and C5-epimerase treatment) using heparin lyase digestion. Total ion chromatogram A, standard AMAC-labeled disaccharides. B, block copolymer intermediate SN. C, block copolymer intermediate NS. D, block copolymer intermediate NSN. E, block copolymer intermediate SNS. F, block copolymer final product SN. G, block copolymer final product NS. H, block copolymer final product NSN. I, block copolymer final product SNS. Different AMAC-labeled disaccharides show different response factors, thus a standard curve was constructed using each to calculate the molar ratio, presented in Table 1.
O-Sulfonation and C5-Epimerization
The HS block copolymers were treated with C5-epimerase in the presence of 2-O-sulfotransferase followed by 6-O-sulfotransferase-1 and 6-O-sulfotransferase-3. These enzymes all act in the N-sulfo domains to form fully modified high sulfo S-domains comprised of →GlcNS6S→IdoA2S→ repeating units (IdoA is iduronic acid). The 6-O-sulfotransferases could also modify the N-acetyl N-domains to a limited extent.
Characterization of HS Block Copolymers
The disaccharide composition of the final HS block copolymer products obtained after O-sulfonation and C5-epimerization were next analyzed by LC-MS (Fig. 5, F–I). All these block copolymers afforded complex mixtures containing different amounts of eight possible disaccharides (Table 1). The N domains were composed primarily of di0S and di6S with minor amounts of di2S, di6S, and di2S6S. The S domains were primarily of composed diTriS and diNS6S with minor amounts of diNS2S and diNS. The disaccharide compositions observed were consistent with the known specificities of the biosynthetic enzymes used.
TABLE 1.
Disaccharide composition calculated from LC-MS peak integration (Fig. 5) using appropriate response factors
TriS, NS6S, NS2S, and NS disaccharides arise from the S-blocks, and 2S6S, 6S, 2S, and 0S disaccharides arise from the N-blocks. From these groups of disaccharides, the NS:NAc ratio in the resulting products can be calculated for: di-block NS, 28:72; di-block SN, 44:56; tri-block NSN, 31:69; tri-block SNS, 57:43.
| TriS | NS6S | NS2S | NS | 2S6S | 6S | 2S | 0S | |
|---|---|---|---|---|---|---|---|---|
| NS | 17.4 | 10.3 | 0.2 | 0.1 | 3.6 | 60.7 | 0.4 | 7.4 |
| SN | 30.2 | 13.1 | 0.4 | 0.2 | 3.9 | 32.3 | 0.3 | 19.6 |
| NSN | 19.0 | 11.5 | 0.3 | 0.3 | 2.0 | 30.3 | 0.7 | 35.9 |
| SNS | 33.1 | 23.9 | 0.7 | 0.7 | 1.3 | 22.2 | 0.2 | 19.9 |
Block Copolymer Bioactivity/Cellular Proliferation
The HS block co-polymers were first tested for cellular proliferation with the FGFR3c-expressing cells and FGFs 1, 2, or 7 in a 96-well plate. Separate experiments were run to compare the two groups of HS block co-polymers of 30 kDa (the N,O-sulfonated SNS and NSN tri-block copolymers derived from the ∼24 kDa starting material) and ∼20 kDa (the N,O-sulfonated SN and NS di-block copolymers derived from the ∼16-kDa starting material) (Fig. 6, A–F). The increased mass of each of the HS block copolymer final products compared with the mass of the block copolymer intermediates results from the addition of sulfo groups. The initial experiments using the 96-well plate assay were utilized to set a base line for the three-dimensional-chip-based cell microarray analysis of proliferation.
FIGURE 6.

A 96-well microtiter plate based assay probing the affect of block copolymers on cellular proliferation via FGFR3c expressing BaF3 cells. In the case of the 30-kDa block copolymers (SNS and NSN), interactions with FGF1 (A) and FGF2 (B) indicated that the block copolymers with high levels of non-reducing end sulfation, SNS, appeared to be a better promoter of cellular proliferation through the FGF-HS-FGFR ternary complex than its complement, NSN. In the case of FGF7 (C) there was no clear difference between the levels of cellular proliferation promoted by SNS against NSN. These near-zero levels of proliferation were expected from FGF7 and are consistent with previously published literature (48). When comparing the 20-kDa block copolymers (SN and NS), better levels of proliferation are seen from the block copolymer with high levels of non-reducing end sulfation (SN) versus the block copolymer with high reducing end sulfation (NS). In the cases of FGF1 (D) and FGF2 (E), there are obvious differences in the levels of proliferation, similar to those seen in panel A and B. There were low-to-zero background levels of proliferation for F, the interaction with FGF7. Each of these FGF-block copolymer-FGFR combinations was tested in 8 replicates in a 96-well plate. These data were normalized against a positive control of FGF1-heparin-FGFR3c growth and a negative control of zero GAG added.
The FGF1-FGFR3c dimeric complex was first tested in the 96-well plate format with the 30-kDa block copolymers. In this experiment, the tri-block copolymers either had (a) high levels of sulfo group substitution at both the reducing and non-reducing end with low sulfo group substitution in the middle block (SNS) or (b) had low levels of sulfo groups at both ends with high sulfo group levels in the middle of the chain (NSN). In these experiments higher levels of proliferation displayed by SNS suggested that high sulfo group domains at the termini of HS were critical.
In experiments on the tri-block copolymers with FGF1 and FGF2 with FGFR3c (Fig. 6, A and B), a clear difference between the proliferation extents of SNS and NSN is demonstrated. In both cases, the SNS tri-block copolymer, having blocks with the high sulfo group substitution at both the reducing and non-reducing ends, was the better promoter of cellular proliferation, whereas the NSN tri-block copolymer was only capable of promoting cellular proliferation slightly above that of the control. In experiments involving FGF7 with FGFR3c (Fig. 6C), there was no difference in cellular proliferation shown by each of these tri-block copolymers. The result for FGF7 is consistent with previous studies (48) that indicate heparin has little ability to promote FGF7-FGFR3c cellular proliferation as compared with a positive control of FGF1-heparin-FGFR3c.
Next, we probed the 20-kDa di-block copolymers with the FGF1, FGF2, and FGF7 with FGFR3c-expressing BaF3 cells. In this set of experiments the block copolymers had high sulfo group substitution only at (a) the non-reducing end di-bock (SN) or (b) the reducing end block (NS). Based on the finding that SNS tri-block copolymer had the highest cellular proliferation activity, our expectation was that one or both di-block copolymers would be capable of promoting BaF3 cell proliferation. Any difference between cellular proliferative activity promoted by SN or NS could be used to predict which end (reducing or non-reducing) of the HS GAG chain was critical in assembling the ternary signal transduction complex.
For FGF1 (Fig. 6D) and FGF2 (Fig. 6E) interactions with FGFR3c, the experiments again showed clear preference for one of the block copolymers. In this case SN, with a block having a high sulfo group content at the non-reducing end produced the highest level of BaF3 cell proliferation. Additionally, when assayed against FGF7 (Fig. 6F), neither di-block copolymer was capable of promoting cellular proliferation, consistent with previous literature (48).
Our next target was to compare both HS tri-block and di-block copolymers on a three-dimensional cell-based bioassay platform (Fig. 7). This high cell density, alginate hydrogel printing has been previously validated by our laboratory (58), and it allows 48 replicates to be tested with the same amount of material that is required of a single replicate in a 96-well plate, permitting much greater confidence in the assay results.
FIGURE 7.

High cell density microarray-based printing allows for probing the HS block copolymer-mediated FGF-FGFR signaling allowing the direct comparison of large numbers of replicates on a single slide. On the microarray chip, 48 replicates can be assayed using the same amount of material required for 1 replicate in a 96-well microtiter plate assay. This improvement allows for increased statistical significance in experimentation while also reducing the amount of overall material needed. Shown are 16-spot snapshots of SNS-induced growth (A), NSN-induced growth (B), SN-induced growth (C), and NS-induced growth (D) with FGF2 and FGFR3c expressing cells. Within each snapshot, these fluorescent intensity images allow for the qualitative assessment of each slide before a more thorough fluorescent intensity quantification using computational software. Block copolymers probed against FGF2 and FGFR1c (E), FGFR2c (F), or FGFR3c (G) indicate that non-reducing end sulfonation is highly important to completing the FGF-HS-FGFR ternary complex. In all cases there were statistical (* = p < 0.05; ** = p < 0.01; *** = p < 0.001) differences in cellular proliferation when comparing SNS and NSN or SN and NS. The relative proliferation percentage (plotted on the y axis) was normalized against a positive control of FGF-heparin-FGFR proliferation and a negative control of no GAG added, non-growth.
For the three-dimensional chip bioassay, instead of probing several FGFs against a single FGFR on the three-dimensional cell-based bioassay platform, we instead focused on a single, well-studied FGF, basic FGF (FGF2) against three FGFRs: FGFR1c, -2c, and -3c. Our decision to probe against several different FGFRs was to test directly different receptors used to establish the symmetric (50) and asymmetric (51) models. The three-dimensional-chip bioassay utilizing FGF2-FGFR1c allows direct examination of the symmetric model and the testing of FGF2 with these block copolymers against FGFRs 2c and 3c and thus providing additional data regarding the domain specificities of these receptors.
Using the FGFRs 1c, 2c, and 3c, a clearer picture of the influence of specific highly sulfated domains becomes evident. In the case of FGF2 (Fig. 7E), the pattern that was demonstrated in the 96-well plate was closely replicated on the three-dimensional microarray chip, validating this approach. When we compare the tri-block copolymers, there was a significant difference (p < 0.01) between cellular proliferation promoted by the addition of the SNS or the addition of NSN. Additionally, there was a significant difference (p < 0.01) between the cell growth promoted by the SN and NS di-block copolymers. Based on what we had observed in the 96-well plate, this was expected. Interestingly, the data demonstrated that there was no significant difference (p > 0.05) between the copolymers with a highly sulfated block at non-reducing end. These data support the hypothesis that the non-reducing end is the domain that is preferred in the formation of the FGF-HSPG-FGFR ternary complex.
In the cases of FGFR2c and FGFR3c, the results obtained were similar to those seen with FGFR1c-FGF2 interactions, but there were some differences. For FGFR2c (Fig. 7F), the block copolymers with highly sulfated blocks at their non-reducing end promoted cellular proliferation at statistically significantly higher levels; SNS (p < 0.01) was higher than NSN, and SN (p < 0.05) was higher than NS. However, in the case of FGFR2c, statistical significance was shown between SNS and SN (p < 0.05). This observation is clear evidence that highly sulfated blocks at the non-reducing end were more active in BaF3 cell proliferation.
For FGFR3c (Fig. 7G), it was also evident that highly sulfated blocks at the non-reducing end are most active. In the case of the tri-block copolymers, there was statistical significance (p < 0.01) when comparing the cellular proliferation of SNS and NSN. Additionally, in the case of the di-block copolymers, SN was able to produce a statistically significant level (p < 0.01) of cellular proliferation as compared with NS. Similarly to the case of FGFR1c, there was no statistically significant (p > 0.05) difference between the cellular proliferation promoted by SNS and SN, further evidence that highly sulfated blocks at the non-reducing end are important in these ternary complex formations.
One of the more difficult pieces of information to resolve in these data (Fig. 6 and 7, Table 2) is the moderate ability of the NSN tri-block copolymer to promote cellular proliferation. If it was the case that non-reducing ends were a requirement for the promotion of the FGF-HSPG-FGFR ternary complex, then NSN should have very low levels of cellular proliferation similar to that of the di-block copolymer NS. However, in interactions with FGFR1c, 2c, and 3c, and FGF2, the data demonstrate that NSN is capable of promoting cellular proliferation at statistically significant levels (p < 0.05) when compared with the zero-growth control having no added HS block copolymer. We rationalize these results to be caused by the larger size of these tri-block copolymers, of ∼30 kDa, causing the dimeric FGF-FGFR complex to see the central highly sulfated block as a pseudo-non reducing end. Additionally, because of the specificity exhibited by the 6-O-sulfotransferase isoforms 1 and 3, the N domains of all of the block copolymers have some level of 6-O-sulfonation as is supported by the LC-MS data provided (Fig. 5 and Table 1).
TABLE 2.
Each synthesized block copolymer substrate promotes proliferation through FGFR signaling to different extents
The cell lines tested on the three-dimensional, high cell density platform expressed either FGFR1c. FGFR2c, or FGFR3c. These values correspond to the proliferation seen in Fig. 7 and correspond to the average of 48 replicates.
| Block copolymer | FGF2 |
||
|---|---|---|---|
| FGFR1c | FGFR2c | FGFR3c | |
| % | % | % | |
| SNS | 60 ± 8.3 | 75 ± 3.7 | 110 ± 6.7 |
| NSN | 27 ± 9.9 | 23 ± 2.7 | 40 ± 1.8 |
| SN | 57 ± 6.7 | 34 ± 3.1 | 91 ± 6.2 |
| NS | 1 ± 2.1 | 7 ± 2.2 | 7 ± 1.7 |
Finally, to further investigate the preference of the 2:2:2 symmetric model of ternary complex over the 2:1:2 asymmetric model, we evaluated the tri-block copolymers, SNS and NSN, in a concentration response experiment under conditions with FGF2 and FGFR1c. If the symmetric model were in fact the preferred model of ternary complex formation, we would expect to see higher levels of induced cellular proliferation from the SNS tri-block copolymer at lower concentrations of FGF2 than would be seen with the NSN block copolymer.
Using our high cell density microarray printing method, the concentrations of FGF2 were varied from 10−5 to 102 nm. These experiments (Fig. 8) show that the SNS tri-bock copolymer is capable of promoting cellular proliferation in combination with FGF2 and FGFR1c at concentrations below 1 nm, consistent with previous literature (38). However, the concentration of FGF2 required for the NSN tri-block copolymer to promote cellular proliferation was notably higher. These data suggest that, although the 2:1:2 asymmetric model of ternary complex is possible, there is an obvious preference for the formation of the 2:2:2 symmetric model.
FIGURE 8.
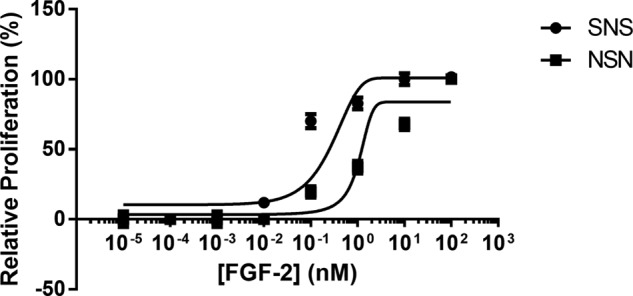
Using high cell density microarray printing, a basic dose-response curve was constructed using cells that express FGFR1c, FGF2, and the tri-block copolymers, SNS (●) and NSN (■). Based on these results, we demonstrate that SNS, the tri-block copolymer with a highly sulfated domains at both its reducing and non-reducing ends, promoted cellular proliferation at lower levels of FGF2 concentration than the NSN tri-block copolymer having under sulfated domains at both its reducing and non-reducing ends. These results suggest that a 2:2:2 model of FGF-HSPG-FGFR interaction is preferred over the formation of a 2:1:2 model.
DISCUSSION
We have developed an approach for the synthesis of four HS block co-polymers composed of S and N domains placed in various positions within the HS chains. The synthesis of these HS block co-polymers employs a heparosan tetrasaccharide acceptor at the reducing-end. Although this acceptor modifies the reducing-end of all the HS block co-polymers in this study, we believed that this was acceptable as our hypothesis focuses on the structural requirements at the non-reducing end. Domain length was controlled by reaction stoichiometry (i.e. equal moles of UDP-GlcNAc and UDP-GlcNTFA) and monitored by PAGE as shown in Fig. 1, A and B. The lengths of the N-domains and S-domains domains, however, were similar but not identical. The 1H NMR signal intensities of the NAc H1 were ∼50% higher than the NS H1 and in the di-block polymers (Fig. 4, A and B). The 1H NMR data on the tri-block also shows larger N-domains. Because accurate quantification by integration of anomeric signals close to a large HOD peak can is challenging, we next checked the S- and N-domain sizes from the disaccharide composition presented in Table 1. These data also show that the N-domains are generally larger than the S-domains. This preference for longer N-domains, despite our stoichiometric control of the reaction, is consistent with the lower reactivity of the unnatural UDP-GlcNTFA donor compared with the natural UDP-GlcNAc donor. The domain size was designed to be sufficiently larger than the decasaccharide required for interaction with FGF-FGFR, so that this variation in domain size was not expected to adversely effect subsequent evaluation by biological assay.
The disaccharide composition of these synthetic HS block copolymers also showed some unusual features. In a perfectly controlled synthesis, the S-domain should be uniformly TriS, and the N-domain should be uniformly 0S or 0S/6S. Even though all the enzymatic reactions did not proceed to completion, it is unclear why the S-domain and N-domain of the NS di-block polymer should be different than the S-domain and N-domain in the SN di-block polymer. Although it is possible that these differences are associated with differences in block size, which are not possible to perfectly control based on reaction stoichiometry, it is also possible that these differences are associated with directionality of the polymer (i.e. where the block resides with respect to the polymer's reducing end). It has been shown, for example, that although C5-epi acts on GlcA residues flanked by two GlcNS residues, if there is a more remote GlcNAc residue toward the non-reducing end, then this reaction is irreversible (31). Similarly, the domain and directional sensitivity of other biosynthetic enzymes, such as the O-sulfotransferases, have yet to be established and might be the major reason for the variations in disaccharide compositions observed in the current study.
These HS block copolymers were designed to probe the structure of the FGF-HS-FGFR signal transduction complex. There are two competing structures for this signal transduction complex, the symmetric ternary complex FGF2-HS2-FGFR2 (Fig. 2A) and the asymmetric complex FGF2-HS1-FGFR2 (Fig. 2B). These models are based on x-ray crystallographic data on two slightly different complexes (43), FGF2-decasaccharide-FGFR1 (50) and FGF-1-decasaccharide-FGRFR2 (51). A number of studies have tested these two models using a variety of biochemical methods (41, 44–47, 50, 51).
Our approach to test these models utilizes four well-defined HS block co-polymers, NS, SN, NSN, and SNS (Fig. 2C). The domain lengths in these HS block co-polymers were all ∼40 saccharide units. The symmetric FGF2-HS2-FGFR2 ternary complex (Fig. 2A) model suggests that two acidic HS chains are docked into the basic canyon located on top face of the FGF2-FGFR2 protein complex. Due to the topological constraints of the two HS chains being attached to their core protein through their reducing ends, in the native FGF2-HSPG2-FGFR2 complex the two HS chains are attached core protein through their reducing ends, the interacting S-domains must be located on the non-reducing end of each HS chain. In contrast, in the asymmetric FGF2-HS1-FGFR2 complex (Fig. 2B) the single HS chain must interact with the FGF2-FGFR2 protein complex through a single S-domain that could be localized at any position on an HS chain. The 96-well plate and micro array data on BaF3 cell proliferation show clear differences among all the HS block copolymers tested. These data support a preference for the symmetric FGF2-HS2-FGFR2 ternary complex (Fig. 2A) model for FGF22-HS2-FGFR1C2, FGF22-HS2-FGFR2C2, FGF22-HS2-FGFR3C2, and FGF12-HS2-FGFR3C2.
The BaF3 cell-based microarray screening method described in this study is a novel high throughput platform that should facilitate the screening of all 154 different FGF-FGFR signal transduction complexes (22 FGFs and 7 FGFRs). Our improved understanding of the specificity of the HS/HP chain modifying enzymes (30, 31, 61) and the availability of multiple enzyme isoforms (28) should assist in this endeavor. Future studies are also planned using this platform to screen libraries of inhibitors of signal transduction complex assembly.
The defined, chemoenzymatically synthetized GAG molecules offer promise for the development of more selective and potent biological modifiers and therapeutics. The ability to target a subset of the growth factor systems rather than all growth factor systems is predicted to yield better control by stimulating only certain cell types or tissues thus reducing chances for off-target, undesired effects.
This work was supported, in whole or in part, by National Institutes of Health Grants HL62244, GM38060, HL096972, ES 020903, and ES 018022.
- GAG
- glycosaminoglycan
- PG
- proteoglycan
- HS
- heparan sulfate
- HP
- heparin
- GlcA
- glucuronic acid
- FGFR
- fibroblast growth factor receptor
- MTT
- 3-(4,5-dimethylthiazol-2-yl)-2,5-diphenyltetrazolium bromide
- TFA
- trifluoroacetyl
- NTFA
- trifluoroacetamide
- MWCO
- molecular weight cut-off
- AMAC
- 2-aminoacridone
- RPMI
- Roswell Park Memorial Institute medium
- S
- block containing high content of sulfo groups
- N
- block containing low level (or no) sulfo groups.
REFERENCES
- 1. Ly M., Laremore T. N., Linhardt R. J. (2010) Proteoglycomics. Recent progress and future challenges. OMICS 14, 389–399 [DOI] [PMC free article] [PubMed] [Google Scholar]
- 2. Caterson B., Flannery C. R., Hughes C. E., Little C. B. (2000) Mechanisms involved in cartilage proteoglycan catabolism. Matrix Biol. 19, 333–344 [DOI] [PubMed] [Google Scholar]
- 3. Kresse H., Schönherr E. (2001) Proteoglycans of the extracellular matrix and growth control. J. Cell. Physiol. 189, 266–274 [DOI] [PubMed] [Google Scholar]
- 4. Sasisekharan R., Venkataraman G. (2000) Heparin and heparan sulfate. Biosynthesis, structure, and function. Curr. Opin. Chem. Biol. 4, 626–631 [DOI] [PubMed] [Google Scholar]
- 5. Jin L., Abrahams J. P., Skinner R., Petitou M., Pike R. N., Carrell R. W. (1997) The anticoagulant activation of antithrombin by heparin. Proc. Natl. Acad. Sci. U.S.A. 94, 14683–14688 [DOI] [PMC free article] [PubMed] [Google Scholar]
- 6. DiGabriele A. D., Lax I., Chen D. I., Svahn C. M., Jaye M., Schlessinger J., Hendrickson W. A. (1998) Structure of a heparin-linked biologically active dimer of fibroblast growth factor. Nature 393, 812–817 [DOI] [PubMed] [Google Scholar]
- 7. Saphire A. C., Bobardt M. D., Gallay P. A. (1999) Host cyclophilin A mediates HIV-1 attachment to target cells via heparans. EMBO J. 18, 6771–6785 [DOI] [PMC free article] [PubMed] [Google Scholar]
- 8. Capila I., Linhardt R. J. (2002) Heparin-protein interactions. Angew. Chem. Int. Ed. 41, 391–412 [DOI] [PubMed] [Google Scholar]
- 9. Rosenberg R. D., Armand G., Lam L. (1978) Structure-function relationship of heparin species. Proc. Natl. Acad. Sci. U.S.A. 75, 3065–3069 [DOI] [PMC free article] [PubMed] [Google Scholar]
- 10. Gallagher J. T., Turnbull J. E., Lyon M. (1992) Patterns of sulphation in heparan sulphate. Polymorphism based on a common structural theme. Int. J. Biochem. 24, 553–660 [DOI] [PubMed] [Google Scholar]
- 11. Kusche-Gullberg M., Nybakken K., Perrimon N., Lindahl U. (2012) Drosophila heparan sulfate, a novel design. J. Biol. Chem. 287, 21950–21956 [DOI] [PMC free article] [PubMed] [Google Scholar]
- 12. Puvirajesinghe T. M., Ahmed Y. A., Powell A. K., Fernig D. G., Guimond S. E., Turnbull J. E. (2012) Array-based functional screening of heparin glycans. Chem. Biol. 19, 553–558 [DOI] [PubMed] [Google Scholar]
- 13. Pervin A., Gallo C., Jandik K. A., Han X.-J., Linhardt R. J. (1995) Preparation and Structural Characterization of Large Heparin-Derived Oligosaccharides. Glycobiology 5, 83–95 [DOI] [PubMed] [Google Scholar]
- 14. Hileman R. E., Smith A. E., Toida T., Linhardt R. J. (1997) Preparation and structure of heparin lyase-derived heparan sulfate oligosaccharides. Glycobiology 7, 231–239 [DOI] [PubMed] [Google Scholar]
- 15. Liu R., Xu Y., Chen M., Weïwer M., Zhou X., Bridges A. S., DeAngelis P. L., Zhang Q., Linhardt R. J., Liu J. (2010) Chemoenzymatic design of heparan sulfate oligosaccharides. J. Biol. Chem. 285, 34240–34249 [DOI] [PMC free article] [PubMed] [Google Scholar]
- 16. Xu Y., Masuko S., Takieddin M., Xu H., Liu R., Jing J., Mousa S. A., Linhardt R. J., Liu J. (2011) Chemoenzymatic synthesis of structurally homogeneous ultra-low molecular weight heparins. Science 334, 498–501 [DOI] [PMC free article] [PubMed] [Google Scholar]
- 17. DeAngelis P. L. (2013) Methods for the Pasteurella glycosaminoglycan synthases. Enzymes that polymerize hyaluronan, chondroitin, or heparosan chains. Methods Mol. Biol. 1022, 215–227 [DOI] [PubMed] [Google Scholar]
- 18. Li J., Hagner-McWhirter A., Kjellén L., Palgi J., Jalkanen M., Lindahl U. (1997) Biosynthesis of heparin/heparan sulfate. cDNA cloning and expression of D-glucuronyl C5-epimerase from bovine lung. J. Biol. Chem. 272, 28158–28163 [DOI] [PubMed] [Google Scholar]
- 19. Habuchi H., Kobayashi M., Kimata K. (1998) Molecular characterization and expression of heparan-sulfate 6-sulfotransferase. Complete cDNA cloning in human and partial cloning in Chinese hamster ovary cells. J. Biol. Chem. 273, 9208–9213 [DOI] [PubMed] [Google Scholar]
- 20. Shworak N. W., Liu J., Fritze L. M., Schwartz J. J., Zhang L., Logeart D., Rosenberg R. D. (1997) Molecular cloning and expression of mouse and human cDNAs encoding heparan sulfate d-glucosaminyl 3-O-sulfotransferase. J. Biol. Chem. 272, 28008–28019 [DOI] [PubMed] [Google Scholar]
- 21. Chen J., Avci F. Y., Muñoz E. M., McDowell L. M., Chen M., Pedersen L. C., Zhang L., Linhardt R. J., Liu J. (2005) Enzymatic redesigning of biologically active heparan sulfate. J. Biol. Chem. 280, 42817–42825 [DOI] [PMC free article] [PubMed] [Google Scholar]
- 22. Pinhal M. A., Smith B., Olson S., Aikawa J., Kimata K., Esko J. D. (2001) Enzyme interactions in heparan sulfate biosynthesis. Uronosyl 5-epimerase and 2-O-sulfotransferase interact in vivo. Proc. Natl. Acad. Sci. U.S.A. 98, 12984–12989 [DOI] [PMC free article] [PubMed] [Google Scholar]
- 23. DeAngelis P. L., Liu J., Linhardt R. J. (2013) Chemoenzymatic synthesis of glycosaminoglycans. Re-creating, re-modeling, and re-designing nature's longest or most complex carbohydrate chains. Glycobiology 23, 764–777 [DOI] [PMC free article] [PubMed] [Google Scholar]
- 24. Masuko S., Bera S., Green D. E., Weïwer M., Liu J., DeAngelis P. L., Linhardt R. J. (2012) Chemoenzymatic synthesis of UDP-GlcNAc and UDP-GalNAc analogs for the preparation of unnatural glycosaminoglycans. J. Org. Chem. 77, 1449–1456 [DOI] [PMC free article] [PubMed] [Google Scholar]
- 25. Sismey-Ragatz A. E., Green D. E., Otto N. J., Rejzek M., Field R. A., DeAngelis P. L. (2007) Chemoenzymatic synthesis with distinct Pasteurella heparosan synthases. J. Biol. Chem. 282, 28321–28327 [DOI] [PubMed] [Google Scholar]
- 26. Williams K. J., Halkes K. M., Kamerling J. P., DeAngelis P. L. (2006) Critical elements of oligosaccharide acceptor substrates for the Pasteurella multocida hyaluronan synthase. J. Biol. Chem. 281, 5391–5397 [DOI] [PubMed] [Google Scholar]
- 27. Jing W., DeAngelis P. L. (2004) Synchronized chemoenzymatic synthesis of monodisperse hyaluronan polymers. J. Biol. Chem. 279, 42345–42349 [DOI] [PubMed] [Google Scholar]
- 28. Esko J. D., Selleck S. B. (2002) Order out of chaos. Assembly of ligand binding sites in heparan sulfate. Annu. Rev. Biochem. 71, 435–471 [DOI] [PubMed] [Google Scholar]
- 29. Peterson S., Frick A., Liu J. (2009) Design of biologically active heparan sulfate and heparin using an enzyme-based approach. Nat. Prod. Rep. 26, 610–627 [DOI] [PubMed] [Google Scholar]
- 30. Liu J., Moon A. F., Sheng J., Pedersen L. C. (2012) Understanding substrate specificity of the heparan sulfate sulfotransferases by an integrated biosynthesis and crystallographic approach. Curr. Opin. Struct. Biol. 22, 550–557 [DOI] [PMC free article] [PubMed] [Google Scholar]
- 31. Sheng J., Xu Y., Dulaney S. B., Huang X., Liu J. (2012) Uncovering biphasic catalytic mode of C5-epimerase in heparan sulfate biosynthesis. J. Biol. Chem. 287, 20996–21002 [DOI] [PMC free article] [PubMed] [Google Scholar]
- 32. Montesano R., Vassalli J.-D., Baird A., Guillemin R., Orci L. (1986) Basic fibroblast growth factor induces angiogenesis in vitro. Proc. Natl. Acad. Sci. U.S.A. 83, 7297–7301 [DOI] [PMC free article] [PubMed] [Google Scholar]
- 33. Iwabu A., Smith K., Allen F. D., Lauffenburger D. A., Wells A. (2004) Epidermal growth factor induces fibroblast contractility and motility via a protein kinase cδ-dependent pathway. J. Biol. Chem. 279, 14551–14560 [DOI] [PubMed] [Google Scholar]
- 34. Marie P. J. (2003) Fibroblast growth factor signaling controlling osteoblast differentiation. Gene 316, 23–32 [DOI] [PubMed] [Google Scholar]
- 35. Melder R. J., Koenig G. C., Witwer B. P., Safabakhsh N., Munn L. L., Jain R. K. (1996) During angiogenesis, vascular endothelial growth factor and basic fibroblast growth factor regulate natural killer cell adhesion to tumor endothelium. Nat. Med. 2, 992–997 [DOI] [PubMed] [Google Scholar]
- 36. Sanchez-Heras E., Howell F. V., Williams G., Doherty P. (2006) The fibroblast growth factor receptor acid box is essential of interactions with N-cadherin and all of the major isoforms of neural cell adhesion molecule. J. Biol. Chem. 281, 35208–35216 [DOI] [PubMed] [Google Scholar]
- 37. Ornitz D. M., Itoh N. (2001) Fibroblast growth factors. Genome Biology 2, Reviews3005 [DOI] [PMC free article] [PubMed] [Google Scholar]
- 38. Ornitz D. M., Xu J., Colvin J. S., McEwen D. G., MacArthur C. A., Coulier F., Gao G., Goldfarb M. (1996) Receptor specificity of the fibroblast growth factor family. J. Biol. Chem. 271, 15292–15297 [DOI] [PubMed] [Google Scholar]
- 39. Mohammadi M., Olsen S. K., Ibrahimi O. A. (2005) Structural basis for fibroblast growth factor receptor activation. Cytokine Growth Factor Rev. 16, 107–137 [DOI] [PubMed] [Google Scholar]
- 40. Ibrahimi O. A., Zhang F., Hrstka S. C., Mohammadi M., Linhardt R. J. (2004) Kinetic model for FGF, FGFR, and proteoglycan signal transduction complex assembly. Biochemistry 43, 4724–4730 [DOI] [PubMed] [Google Scholar]
- 41. Brown A., Robinson C. J., Gallagher J. T., Blundell T. L. (2013) Cooperative heparin-mediated oligomerization of fibroblast growth factor-1 (FGF1) precedes recruitment of FGFR2 to ternary complexes. Biophys. J. 104, 1720–1730 [DOI] [PMC free article] [PubMed] [Google Scholar]
- 42. Jaye M., Schlessinger J., Dionne C. A. (1992) Fibroblast growth factor receptor tyrosine kinases. Molecular analysis and signal transduction. Biochim. Biophys. Acta 1135, 185–199 [DOI] [PubMed] [Google Scholar]
- 43. Mulloy B., Linhardt R. J. (2001) Order out of complexity. Protein structures that interact with heparin. Curr. Opin. Struct. Biol. 11, 623–628 [DOI] [PubMed] [Google Scholar]
- 44. Powell A. K., Fernig D. G., Turnbull J. E. (2002) Fibroblast growth factors 1 and 2 interact differently with heparin/heparan sulfate. Implications for dynamic assembly of a ternary signaling complex. J. Biol. Chem. 277, 28554–28563 [DOI] [PubMed] [Google Scholar]
- 45. Rusnati M., Coltrini D., Caccia P., Dell'Era P., Zoppetti G., Oreste P., Valsasina B., Presta M. (1994) Distinct role of 2-O-, N-, and 6-O-sulfate groups of heparin in the formation of the ternary complex with basic fibroblast growth factor and soluble FGF receptor-1. Biochem. Biophys. Res. Commun. 203, 450–458 [DOI] [PubMed] [Google Scholar]
- 46. Robinson C. J., Harmer N. J., Goodger S. J., Blundell T. L., Gallagher J. T. (2005) Cooperative dimerization of fibroblast growth factor 1 (FGF1) upon a single heparin saccharide may drive the formation of 2:2:1 FGF1·FGFR2c·heparin ternary complexes. J. Biol. Chem. 280, 42274–42282 [DOI] [PubMed] [Google Scholar]
- 47. Wu Z. L., Zhang L., Yabe T., Kuberan B., Beeler D. L., Love A., Rosenberg R. D. (2003) The involvement of heparan sulfate (HS) in FGF1/HS/FGFR1 signaling complex. J. Biol. Chem. 278, 17121–17129 [DOI] [PubMed] [Google Scholar]
- 48. Zhang X., Ibrahimi O. A., Olsen S. K., Umemori H., Mohammadi M., Ornitz D. M. (2006) Receptor specificity of the fibroblast growth factor family. J. Biol. Chem. 281, 15694–16700 [DOI] [PMC free article] [PubMed] [Google Scholar]
- 49. Ornitz D. M., Leder P. (1992) Ligand specificity and heparin dependence of fibroblast growth factor receptors 1 and 3. J. Biol. Chem. 267, 16305–16311 [PubMed] [Google Scholar]
- 50. Schlessinger J., Plotnikov A. N., Ibrahimi O. A., Eliseenkova A. V., Yeh B. K., Yayon A., Linhardt R. J., Mohammadi M. (2000) Crystal structure of a ternary FGF-FGFR-heparin complex reveals a dual role for heparin in FGFR binding and dimerization. Mol. Cell 6, 743–750 [DOI] [PubMed] [Google Scholar]
- 51. Pellegrini L., Burke D. F., von Delft F., Mulloy B., Blundell T. L. (2000) Crystal structure of fibroblast growth factor receptor ectodomain bound to ligand and heparin. Nature 407, 1029–1034 [DOI] [PubMed] [Google Scholar]
- 52. Naimy H., Buczek-Thomas J. A., Nugent M. A., Leymarie N., Zaia J. (2011) Highly sulfated nonreducing end-derived heparan sulfate domains bind fibroblast growth factor-2 with high affinity and are enriched in biologically active fractions. J. Biol. Chem. 286, 19311–19319 [DOI] [PMC free article] [PubMed] [Google Scholar]
- 53. Xu Y., Pempe E. H., Liu J. (2012) Chemoenzymatic synthesis of heparin oligosaccharides with both anti-factor Xa and anti-factor IIa activities. J. Biol. Chem. 287, 29054–29061 [DOI] [PMC free article] [PubMed] [Google Scholar]
- 54. Otto N. J., Green D. E., Masuko S., Mayer A., Tanner M. E., Linhardt R. J., DeAngelis P. L. (2012) Structure/function analysis of Pasteurella multocida heparosan synthases: toward defining enzyme specificity and engineering novel catalysts. J. Biol. Chem. 287, 7203–7212 [DOI] [PMC free article] [PubMed] [Google Scholar]
- 55. Maruyama T., Toida T., Imanari T., Yu G., Linhardt R. J. (1998) Conformational changes and anticoagulant activity of chondroitin sulfate following its O-sulfonation. Carbohydr. Res. 306, 35–43 [DOI] [PubMed] [Google Scholar]
- 56. Li G., Masuko S., Green D. E., Xu Y., Li L., Zhang F., Xue C., Liu J., DeAngelis P. L., Linhardt R. J. (2013) N-sulfotestosteronan, a novel substrate for heparan sulfate 6-O-sulfotransferases and its analysis by oxidative degradation. Biopolymers 99, 675–685 [DOI] [PMC free article] [PubMed] [Google Scholar]
- 57. Yang B., Chang Y., Weyers A. M., Sterner E., Linhardt R. J. (2012) Disaccharide analysis of glycosaminoglycan mixtures by ultra-high-performance liquid-chromatography-mass spectrometry. J. Chromatogr. A. 1225, 91–98 [DOI] [PMC free article] [PubMed] [Google Scholar]
- 58. Sterner E., Meli L., Kwon S. J., Dordick J. S., Linhardt R. J. (2013) FGF-FGFR signaling mediated through glycosaminoglycans in microtiter plate and cell-based microarray platforms. Biochemistry 52, 9009–9019 [DOI] [PMC free article] [PubMed] [Google Scholar]
- 59. Fernandes T. G., Kwon S. J., Bale S. S., Lee M. Y., Diogo M. M., Clark D. S., Cabral J. M., Dordick J. S. (2010) Three-dimensional cell culture microarray for high-throughput studies of stem cell fate. Biotechnol. Bioeng. 106, 106–118 [DOI] [PMC free article] [PubMed] [Google Scholar]
- 60. Meli L., Jordan E. T., Clark D. S., Linhardt R. J., Dordick J. S. (2012) Influence of a 3D microarray environment on human cell culture in drug screening systems. Biomaterials 33, 9087–9096 [DOI] [PMC free article] [PubMed] [Google Scholar]
- 61. Linhardt R. J., Liu J. (2012) Synthetic heparin. Curr. Opin. Pharmacol. 12, 217–219 [DOI] [PMC free article] [PubMed] [Google Scholar]