

Background: Ezrin can establish a dynamic linkage between plasma membrane and cytoskeleton.
Results: The individual bond strength between ezrin and F-actin is small, but the number of attachment sites is significantly altered by phosphatidylinositol 4,5-bisphosphate (PIP2).
Conclusion: PIP2 activates ezrin to establish multiple weak ezrin/F-actin interactions.
Significance: Plasma membrane tension is maintained by ezrin/F-actin interactions.
Keywords: Actin, Atomic Force Microscopy, Ezrin, Phosphatidylinositol, Phosphorylation
Abstract
Direct linkage between the plasma membrane and the actin cytoskeleton is controlled by the protein ezrin, a member of the ezrin-radixin-moesin protein family. To function as a membrane-cytoskeleton linker, ezrin needs to be activated in a process that involves binding of ezrin to phosphatidylinositol 4,5-bisphosphate (PIP2) and phosphorylation of a conserved threonine residue. Here, we used colloidal probe microscopy to quantitatively analyze the interaction between ezrin and F-actin as a function of these activating factors. We show that the measured individual unbinding forces between ezrin and F-actin are independent of the activating parameters, in the range of approximately 50 piconewtons. However, the cumulative adhesion energy greatly increases in the presence of PIP2 demonstrating that a larger number of bonds between ezrin and F-actin has formed. In contrast, the phosphorylation state, represented by phosphor-mimetic mutants of ezrin, only plays a minor role in the activation process. These results are in line with in vivo experiments demonstrating that an increase in PIP2 concentration recruits more ezrin to the apical plasma membrane of polarized cells and significantly increases the membrane tension serving as a measure of the adhesion sites between the plasma membrane and the F-actin network.
Introduction
The interface between the cortical actin cytoskeleton and the plasma membrane is a highly dynamic and tightly controlled entity. Members of the ezrin-radixin-moesin (ERM)4 protein family provide a direct linkage between proteins and lipids of the plasma membrane and the cortical filamentous actin (F-actin) and are thus involved in the organization of structurally and functionally distinct cortical domains (1, 2). This organizing function links ezrin to many fundamental cellular processes, such as epithelial morphogenesis (3–5), cell adhesion and migration (6, 7), but there is also evidence that ezrin overexpression is linked to the metastatic behavior in different types of tumors (8, 9). From a biophysical perspective, the linkage mediated by ERM proteins significantly influences the plasma membrane tension (10, 11). Liu et al. (12) showed that overexpression of an active ezrin mutant increases membrane tension in T cells. Krieg et al. (13) demonstrated that the extraction force of plasma membrane nanotubes is lower for cells expressing a dominant negative form of ezrin compared with normal cells. This result was discussed in terms of a disrupted ezrin activity, which decreases the membrane-cortex adhesion, thereby lowering the membrane tension. A tight control of membrane tension is prerequisite for fundamental processes such as cell adhesion, motility, division, and response to external chemical and physical stimuli.
The binding site of ezrin for F-actin is located in the C-terminal ERM association domain (C-ERMAD), which is masked because of a strong interaction with the N-terminal ERM association domain (N-ERMAD) leading to a closed, dormant conformation (14). An open, active conformation requires the dissociation of the N-ERMAD/C-ERMAD to allow for F-actin binding. Two specific regions have been identified to play a pivotal role in the activation process of ezrin: (i) a conserved threonine (Thr-567) in the C-ERMAD of ezrin, which is the target for phosphorylation by Rho-kinase (15, 16), protein kinase Cθ (17), and protein kinase Cα (18); and (ii) a binding site specific for the phosphoinositide l-α-phosphatidylinositol 4,5-bisphosphate (PIP2) within the N-ERMAD of ezrin (19). Based on these and further results, a two-step activation model has been proposed comprising a recruitment of ezrin to the membrane by PIP2 and subsequent phosphorylation of the conserved threonine residue 567 (15, 20–22).
In vivo, every morphological change of an epithelial cell is expected to be accompanied by force generation on the ezrin-mediated connection between the apical plasma membrane and the underlying cytoskeleton. Thus, we asked how the phosphorylation state of ezrin as well as PIP2 binding alters the interaction forces as well as the adhesion energies of the ezrin/F-actin interface. To probe the bond strength of ezrin/F-actin contacts, we made use of colloidal probe microscopy (23, 24). As F-actin is a long filamentous protein (25) and ezrin forms protein clusters on membrane surfaces (26), it is conceivable that multiple ezrin/F-actin interactions occur in vivo and that the individual bond strength is weak. Thus, instead of probing single bond interactions by making use of a sharp functionalized tip of an AFM cantilever, we used ezrin-functionalized colloidal probes, which provide a larger contact area and thus allow for the detection of multiple bonds upon contact with an F-actin network immobilized on a planar substrate. Thereby, we were able to show that PIP2 is capable of releasing the F-actin binding site of ezrin. This results in large adhesion energies of the ezrin/F-actin interface, although the individual bond strength is only moderate. These in vitro results are supported by single cell experiments demonstrating that an increase in PIP2 concentration recruits more ezrin to the apical cortex of polarized MDCK II cells and significantly increases the membrane tension.
EXPERIMENTAL PROCEDURES
Protein Purification
All ezrin proteins harboring an N-terminal His6 tag were obtained by recombinant expression in transformed Escherichia coli cells (strain BL21(DE3)pLysS) containing the bacterial expression vector pET28a+ (Novagen) encoding ezrin WT, ezrin T567A, ezrin T567D, and N-ERMAD (27). Cells were grown to an A600 of 0.6, and protein expression was induced by 1 mm isopropyl-β-d-thiogalactopyranoside (Sigma-Aldrich). After 3 h, cells were harvested by centrifugation (4,000 × g, 20 min, 4 °C), and the pellet was resuspended in lysis buffer (40 mm HEPES, pH 7.4, 20 mm imidazole, 300 mm NaCl, 1 mm EDTA, 10 mm mercaptoethanol, protease inhibitor mixture (Complete; Roche Diagnostics)). To complete lysis, the suspension was sonicated on ice, and the bacterial lysate was clarified by centrifugation (100,000 × g, 1 h, 4 °C). The supernatant was applied to a nickel-nitrilotriacetic acid (Ni-NTA)-agarose column (Qiagen) equilibrated with lysis buffer. The column was washed twice with lysis buffer supplemented first with 30 mm and then 50 mm imidazole, respectively. Ezrin was eluted using buffer A (20 mm Tris-HCl, pH 7.4, 50 mm KCl, 0.1 mm EDTA, 0.1 mm NaN3) containing 250 mm imidazole, dialyzed against imidazole-free buffer A, and stored at 4 °C until use. Protein concentration was determined by UV-visible spectroscopy using an extinction coefficient of ϵ280 = 66,900 m−1 cm−1.
Surface Functionalization
Silicon substrates (100-nm SiO2 layer, 0.8 × 2.0 cm2) were coated with 5 nm of Cr and 60 nm of Au (Bal-Tec MCS610 evaporator), and the cantilevers were used as purchased. Before self-assembly, the Au-coated silicon substrates were cleaned for 2 min and cantilevers for 30 s in argon plasma. The Au-coated silicon substrates were immersed in 2 mm ethanolic (11-mercaptoundecyl)trimethylammonium (AUT+-thiol; Prochimia) solution and incubated overnight at room temperature, whereas cantilevers were placed into a 1:5 ethanolic mixture of NTA-thiol (Prochimia) and matrix thiol (Prochimia) for 1 h at a final thiol concentration of 2 mm. After incubation, all surfaces were rinsed with ethanol and ultrapure water. Polymerized nonmuscle F-actin was electrostatically adsorbed onto the AUT+-functionalized Au-coated substrate. Ezrin was bound via the His6 tag to the Ni-NTA-functionalized cantilevers.
F-actin Polymerization
Lyophilized nonmuscular actin (>95% pure, purified from human platelets, isotype composition: 85% β-actin, 15% γ-actin, Cytoskeleton) was dissolved in ultrapure water at a concentration of 10 mg/ml to obtain a buffer composition of 5 mm Tris-HCl, pH 8.0, 0.2 mm CaCl2, 0.2 mm ATP, 5% sucrose (w/v), 1% dextran (w/v). 10-μl aliquots were snap-frozen in liquid nitrogen and stored at −80 °C. Before use, an aliquot was diluted with cold G buffer (5 mm Tris-HCl, pH 7.4, 0.2 mm CaCl2, 0.5 mm DTT, 0.2 mm ATP, 0.8 mm NaN3) to 0.4 mg/ml and incubated on ice for 1 h. To remove remaining oligomers, the solution was clarified by centrifugation (17,000 × g, 15 min, 4 °C). The supernatant was taken, and actin polymerization was induced by adding 500 mm KCl, 20 mm MgCl2, 20 mm ATP (1:10, v/v). After 15 min, 1 mol % of Alexa Fluor 488-phalloidin (Invitrogen) was added to label the actin filaments fluorescently; after 20 min, an equimolar amount (with respect to G-actin) of phalloidin (Sigma-Aldrich) was added to stabilize the filaments (28). The solution was left on ice for at least 1 h to ensure complete binding of phalloidin. The resulting F-actin solution was added to an AUT+-functionalized Au-coated substrate immersed in buffer B (20 mm Tris-HCl, pH 7.4, 50 mm KCl, 0.2 mm MgCl2, 0.1 mm EDTA, 0.1 mm NaN3) and incubated overnight at 4 °C.
Cantilever Functionalization
Gold colloidal probes (diameter: 5.5–9.5 μm) with a nominal spring constant of 0.08 N/m (sQube) were used for colloidal probe experiments. For single molecule force spectroscopy experiments, BioLevers (Olympus) with a nominal spring constant of 0.006 N/m were applied. The spring constant was calibrated before each experiment using the thermal noise method (29). After the self-assembled monolayer was formed, the cantilever was incubated in 100 mm NiCl2, pH 8.0 (Tris) for 30 min to charge the NTA moieties. After copious rinsing with ultrapure water and buffer A, the cantilever was mounted into the standard holder (Asylum Research). Protein binding was achieved by placing the holder on top of a flow-through chamber containing 1 μm protein solution. In experiments involving PIP2, 1 μm protein solution was preincubated for 30 min with 1 μm PIP2 solution in buffer A using a rotator. After a 1-h flow-through protein incubation, the cantilever holder was removed, rinsed with buffer, and mounted onto the AFM head.
Force Measurements
Colloidal probe and single molecule force measurements were performed using a MFP-3D (Asylum Research). Before each experiment, the system was thermally equilibrated for 20 min. During force experiments, the protein-covered probe was brought into contact with the F-actin-functionalized surface in buffer B. Force-distance cycles were performed at 200-pN load force with varying pulling velocities and matching sample rates. The dwell time was set to 1 s. Colloidal probes were inspected afterward to control whether the colloid was still firmly attached. Additionally, epifluorescence microscopy images were taken to ensure that no F-actin was adhered to the colloid.
Cell Culture
MDCK II cells (Health Protection Agency) were maintained in minimal essential medium (MEM) with Earle's salts and 2.2 g/liter NaHCO3 (Biochrom) supplemented with 4 mm l-glutamine (Biochrom) and 10% fetal calf serum (FCS; PAA) at 37 °C in a 5% CO2 humidified incubator. Medium for samples prepared or measured outside the laminar flow box additionally contained penicillin (0.2 mg/ml; PAA), streptomycin (0.2 mg/ml; PAA), and amphotericin B (5 μg/ml; PAA). HEPES (PAA) was supplemented in a concentration of 15 μm. Confluent cells were released from the substrate and neighboring cells with trypsin/EDTA (0.5%/0.2%; Biochrom) and subcultured weekly.
Microinjection of PIP2 in Confluent MDCK II Cells
The microinjection system, composed of a microinjector (FemtoJet®; Eppendorf) and a micromanipulator (InjectMan® NI 2; Eppendorf) making use of commercially available glass capillaries (inner diameter: 0.5 μm, Femtotips®; Eppendorf), was part of an inverted microscope device (IX81; Olympus) equipped with two objectives (UPLFLN 10X2PH, NA = 0.3 and LUCPLFKN 40XPH, NA = 0.6) to allow for fluorescence microscopy in conjunction with phase-contrast microscopy. Cells were observed at 37 °C using a JPK PetriDishHeaterTM (JPK Instruments AG). PIP2 from pork brain (Avanti Polar Lipids) was injected together with a metabolically stabilized analog of PIP2 (PIP2 α-fluorophosphonate; Echelon Biosciences). 5 mg/ml fluorescein isothiocyanate-dextran (FITC-dextran, molecular weight = 70,000; Sigma-Aldrich) served as fluorescent co-injection substance. All three substances were mixed (cPIP2 = 25 μm) and homogenized in an ultrasonic bath (50 W, 0.4 s, 30 min). This method yielded PIP2-micelles with an average hydrodynamic radius of 13 nm as determined by dynamic light scattering (ALV/CGS-3 Goniometer System, ALV; equipped with a 22-mW He-Ne laser, λ = 632.8 nm; JDS Uniphase).
siRNA Transfection
Cells were seeded on Petri dishes (μ-Dish 35 mm; ibidi) and grown to 50% confluence. Pooled siRNA targeting ezrin sequences GCUVAAGAUAAUGCUAUGUU, GGCAACAGCUGGAAACAGAUU, GAAGAAGGCACCUGACUUUUU, and GAUCAGGUGGUAAAGACUAUU (SMART pool siGENOME EZR siRNA; Thermo Scientific) were transfected with Lipofectamine® RNAiMAX transfection reagent (Invitrogen) following the manufacturer's instructions. Cells were used after 96 h of incubation.
Immunolabeling of MDCK II Cells
Cells were grown in Petri dishes (μ-Dish 35 mm; ibidi) to confluence and afterward fixed with 4% paraformaldehyde (Sigma-Aldrich) in phosphate-buffered saline lacking Ca2+ and Mg2+ (PBS−; Biochrom) for 20 min. After fixation, cells were washed three times with PBS−. To block nonspecific binding sites and to permeabilize the membrane, cells were treated with blocking buffer (5% (w/v) bovine serum albumin (BSA; Sigma-Aldrich) and 0.3% (v/v) Triton X-100 (Sigma-Aldrich) in PBS−) for 30 min and rinsed three times with PBS−. To label PIP2 and ezrin, PIP2 and ezrin antibodies were diluted with buffer (1% (w/v) BSA and 0.3% (v/v) Triton X-100 in PBS−) to concentrations of 25 and 4 μg/ml, respectively. The primary antibody (PIP2, mouse IgG2b (Enzo Life Sciences); ezrin, mouse IgG1 (BD Biosciences)) was added for 1 h at room temperature. The secondary antibody (PIP2, Alexa Fluor 546-conjugated goat anti-mouse IgG; ezrin, Alexa Fluor 488-conjugated goat anti-mouse IgG or Alexa Fluor 546-conjugated goat anti-mouse IgG (Invitrogen)) was diluted to a concentration of 5 μg/ml and added to the cells for 45 min. F-actin was labeled with 165 nm Alexa Fluor 488-phalloidin (Invitrogen) for 45 min. ZO-1 was labeled using Alexa Fluor 488-conjugated ZO-1 monoclonal antibody at a concentration of 5 μg/ml (60-min incubation time). The cell nuclei were labeled with 4′,6-diamidino-2-phenylindole (DAPI; Invitrogen), diluted to a concentration of 50 ng/ml, and incubated for 15 min. For all labeling procedures, the cells were rinsed three times with PBS− for 5 min each on a vibratory plate between each step.
Probing Tether Forces to Determine Membrane Tension
Membrane tension tt was computed from experimentally determined plateau forces (Ftether) of a fully established membrane nanotube according to Equation 1 and Refs. 30–32.
 |
For computing tt we chose a bending module κ = 2.7·10−19 J representing a fluid lipid bilayer (33). We found that viscous contributions to the tether force could be neglected as a first approximation (13, 34). Prior to tether pulling, cantilevers (MLCT; Bruker AFM Probes) with a nominal spring constant of 0.01 N/m were plasma-cleaned for 30 s (argon) and incubated with 2.5 mg/ml concanavalin A (Sigma-Aldrich) in PBS− for 1.5 h to enhance binding of the tip to the cell membrane surface, thereby extracting membrane nanotubes upon retraction of the tip. The spring constant of the functionalized cantilever was calibrated before each experiment using the thermal noise method (35). Force curves were taken continuously using a Nanowizard® II and III AFM (JPK Instruments AG) while scanning laterally across the sample referred to as force mapping. After indentation up to a force of 1 nN the cantilever was retracted with a velocity of 2 μm/s.
RESULTS
Colloidal Probe Setup
The experimental setup is schematically depicted in Fig. 1A. The gold sphere attached to a cantilever (Fig. 1B) was functionalized with a self-assembled monolayer composed of NTA-thiol and (1-mercaptoundec-11-yl)-tri(ethylene glycol) (1:5). The NTA-thiol was charged with nickel ions to provide binding sites for His6-tagged proteins, whereas (1-mercaptoundec-11-yl)-(triethylene glycol) was used as matrix thiol to adjust the protein density on the surface and to prevent nonspecific binding and denaturation of the protein. Ezrin was expressed as a fusion protein with an N-terminal His6 tag to allow for binding in an oriented manner and positioning the protein on the surface with full access to the C-terminal F-actin binding site in the active conformation of the protein. We have shown previously that the His6 tag does not influence the binding behavior of the proteins to PIP2 and does not alter the conformational stability of the proteins as evaluated by their F-actin binding capabilities (36). The success of the functionalization strategy was monitored and confirmed by surface plasmon resonance measurements (Fig. 2) indicating that very similar amounts of protein bind to the surface via His6 tag-Ni-NTA complex formation irrespective of the protein mutant. Actin filaments were attached to a positively charged self-assembled monolayer composed of AUT+-thiol on a planar, gold-coated substrate via electrostatic interaction (Fig. 1C). Besides the wild type protein (ezrin WT), a phosphomimetic mutant of ezrin was investigated. The threonine at position 567 was replaced by an aspartate (ezrin T567D), a mutation that is frequently used in in vivo experiments (37–40) even though it does not fully represent the phosphorylated form of the protein as, for instance, it lacks one of the negative charges at pH 7.4.
FIGURE 1.
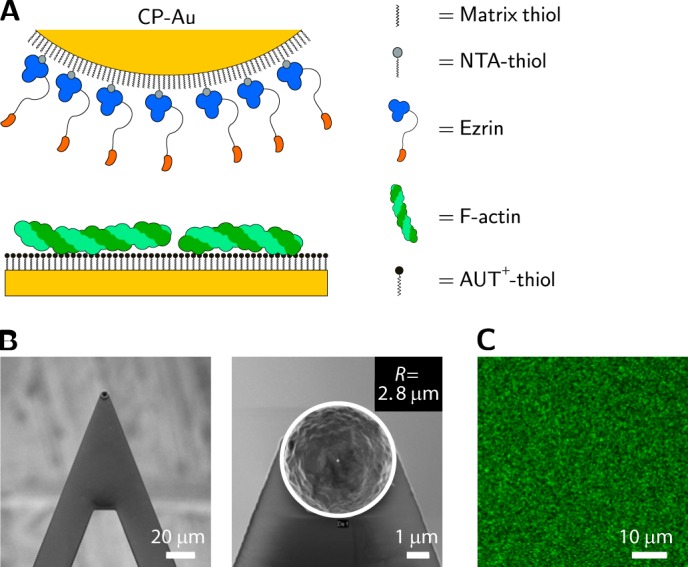
Setup for colloidal probe measurements. A, schematic drawing of a gold colloidal probe (CP-Au) coated with ezrin via His6 tag attachment to a NTA-thiol containing self-assembled monolayer. F-actin is immobilized on a positively charged AUT+ monolayer on a gold-coated silicon wafer. B, scanning electron micrographs of the cantilever (left) and the colloidal probe (right). C, confocal fluorescence image of Alexa Fluor 488-phalloidin-labeled F-actin bound to an AUT+ monolayer.
FIGURE 2.

Time-resolved adsorption of His6-tagged protein (1 μm) to NTA-thiol containing self-assembled monolayer monitored by surface plasmon resonance measurements. When indicated, the protein was preincubated in equimolar PIP2 solution. The x axis breaks correspond to imidazole induced elution of bound protein to regenerate the sensor surface as the entire measurement was performed on one chip.
One of the challenging tasks in force spectroscopy is to distinguish between specific intermolecular forces between two molecules and nonspecific forces always occurring between two surfaces. To take this into account, we have chosen to include two different control proteins. While keeping the F-actin surface unchanged, we varied the ezrin-decorated surface. Instead of using full-length ezrin, we attached only the N-ERMAD of ezrin via a His6 tag. This truncated ezrin lacks the F-actin binding domain enabling us to monitor only interactions not related to a specific protein/F-actin interaction. As a second control protein, we used an ezrin mutant (ezrin T567A), in which the threonine was replaced by an alanine. Previously, we have shown that if this protein is bound via its His6 tag to Ni-NTA, it does not significantly bind F-actin. From these results we concluded that ezrin T567A remains in the closed dormant conformation with a nonaccessible F-actin binding site (36).
Unbinding Forces and Adhesion Energies of the Ezrin/F-actin Interaction
Typical force retraction curves of all four protein-F-actin interactions are displayed in Fig. 3. The protein-covered colloidal probes were brought into contact with F-actin-covered planar surfaces and left there for a dwell time of 1 s until the cantilever was retracted from the surface. The interaction between N-ERMAD and F-actin is characterized by only few and narrow adhesion events in the range of 10–60 pN. We attribute this to a non-F-actin-specific interaction between the protein-covered probe and the F-actin surface. Slightly more events in the same order of magnitude were recorded between ezrin T567A and F-actin. In contrast, the interaction between ezrin WT and F-actin is characterized by more adhesion events over a longer distance in the range of 40–70 pN. A similar behavior was found for ezrin T567D interacting with F-actin. To provide statistically meaningful data, we extracted all observable adhesion forces as well as the cumulative surface adhesion energy, which is the integral of the force retraction curve. An example of the result of the automated data processing routine is given in Fig. 3.
FIGURE 3.
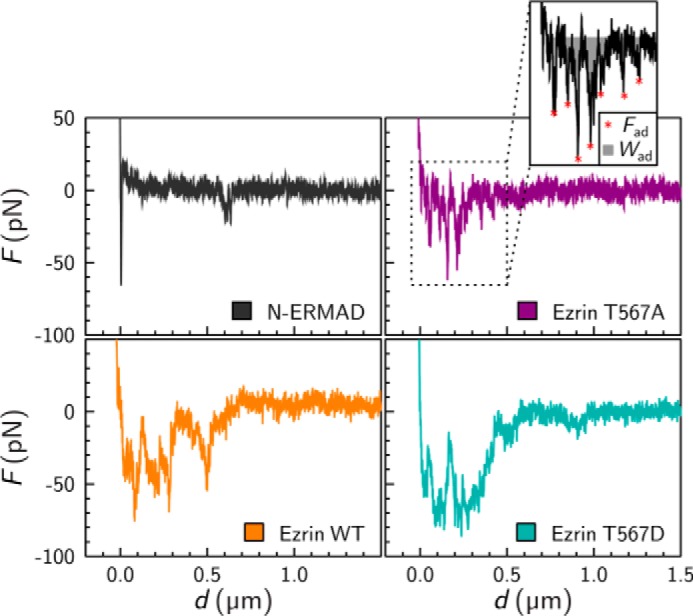
Force retraction curves obtained from a protein-coated colloidal probe and an F-actin-covered surface. Retraction velocity was 1 μm/s. For data analysis, the unbinding force peaks (red stars) and the area under the curve (gray area) were evaluated, yielding adhesion forces (Fad) and surface adhesion energies (Wad) as shown for ezrin T567A (inset).
The adhesion forces of the interaction between F-actin and N-ERMAD, which lacks the specific C-terminal interaction domain for F-actin, show a very narrow distribution ranging from 0 to 100 pN (Fig. 4). In contrast, all adhesion force distributions between the full-length proteins and F-actin were considerably broader, extending asymmetrically to larger forces. As all distributions exhibit a distribution skewed to the right, we determined the median forces Fad. For the interaction between N-ERMAD and ezrin, Fad was found to be only 28 pN, whereas it was 43 pN for the interaction of ezrin T567A and F-actin. For ezrin WT the adhesion force was determined to be Fad = 50 pN and for ezrin T567D Fad = 58 pN. The results demonstrate (i) that the unbinding forces are small, suggesting that, even though colloidal probe experiments were performed, where a larger number of bonds are expected to form simultaneously between ezrin and F-actin, apparently only single molecule interactions are probed (41); and (ii) that the differences in the median adhesion forces among the three full-length ezrin proteins are small with a tendency to larger values for ezrin WT and ezrin T567D compared with ezrin T567A. Only N-ERMAD shows a significant, 2-fold lower adhesion force than ezrin T567D, which manifests that the C-terminal domain harboring the F-actin binding site is responsible for the observed larger interaction force between ezrin and F-actin.
FIGURE 4.
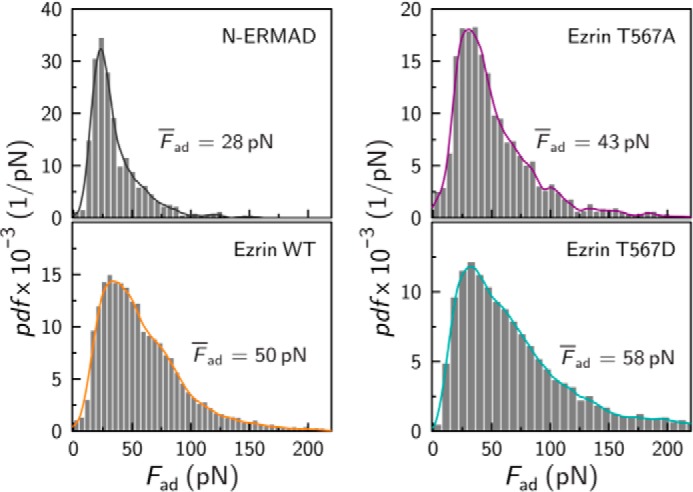
Probability density function (pdf) of adhesion forces Fad between an F-actin surface and an ezrin-covered probe. Histogram analysis (gray bars) and kernel density estimation (solid lines) for N-ERMAD (gray, n = 564, n = 3 experiments), ezrin T567A (purple, n = 2,825, n = 2 experiments), ezrin WT (orange, n = 6,128, n = 4 experiments), and ezrin T567D (dark cyan, n = 4,747, n = 4 experiments). Median values Fad are given.
For the cumulative surface adhesion energy, each data set was normalized to account for the slightly different contact areas between the colloidal spheres and the substrate. After each experiment, the colloidal probes were analyzed by scanning electron microscopy. From these images, the radius R of the sphere was estimated (see Fig. 1B). According to the Hertzian contact model (42, 43), the contact area is proportional to R2/3, which was used for normalization. The normalized cumulative surface adhesion energies were also cast into histograms (Fig. 5). The histogram analysis shows that the adhesion energy found for N-ERMAD and F-actin is rather small with a median Wad,norm = 38 fJ/m2/3. A slightly broader distribution was found for ezrin T567A with Wad,norm = 60 fJ/m2/3. However, in case of ezrin WT and ezrin T567D interacting with F-actin significantly larger adhesion energies were observed yielding a median Wad,norm = 170 fJ/m2/3 for ezrin WT being even slightly larger than that for ezrin T567D, which produces 130 fJ/m2/3. It becomes very obvious that the normalized cumulative adhesion energies are significantly smaller for N-ERMAD lacking the C-terminal F-actin binding site as well as for ezrin T567A, which is expected to remain in the closed conformation with a masked binding site for F-actin compared with those obtained for ezrin WT and ezrin T567D.
FIGURE 5.
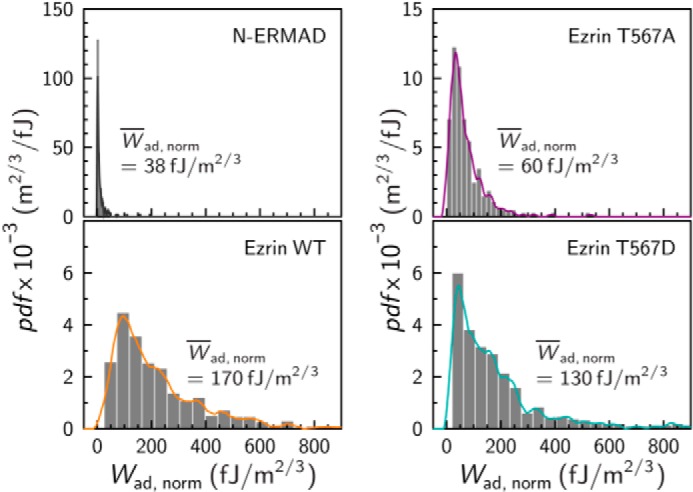
Probability density function (pdf) of normalized cumulative surface adhesion energies Wad, norm between an F-actin surface and ezrin-covered probe. Histogram analysis (gray bars) and kernel density estimation (solid lines) N-ERMAD (gray, n = 156, n = 3 experiments), ezrin T567A (purple, n = 236, n = 2 experiments), ezrin WT (orange, n = 519, n = 4 experiments), and ezrin T567D (dark cyan, n = 505, n = 4 experiments). Median values Wad,norm are given.
Influence of PIP2 on the Adhesion Forces and Adhesion Energies
PIP2 binding has been shown to be important for the activation of ezrin (36, 44–46). Thus, we asked whether the presence of PIP2 changes the unbinding forces and the cumulative adhesion energies of the interaction between ezrin and F-actin. To investigate the PIP2 influence, we incubated ezrin prior to its binding via the His6 tag to the colloidal probe with a submicellar concentration of PIP2 (45, 47). To ensure that the addition of PIP2 does not influence the binding behavior of ezrin to the Ni-NTA-moieties, its binding to the functionalized gold surface was analyzed by surface plasmon resonance measurements demonstrating that the amount of protein bound via its His6 tag is not significantly affected by the presence of PIP2 (see Fig. 2).
Again, force retraction curves were recorded for the different PIP2 preincubated ezrin proteins (Fig. 6A). All adhesion forces (Fig. 6B) as well as the cumulative adhesion energies (Fig. 6C) were extracted from the individual force retraction curves and cast into histograms. The median adhesion forces are still in the 50-pN range. For ezrin T567A preincubated with PIP2, a median adhesion force Fad = 46 pN was determined, which is similar to that found without PIP2 (Fad = 43 pN). Similarly, the median adhesion forces for ezrin WT and ezrin T567D increased only slightly to Fad = 58 pN and Fad = 64 pN, respectively, when preincubated with PIP2.
FIGURE 6.

Influence of PIP2 on the interaction between an ezrin coated colloidal probe and an F-actin covered surface. A, typical force retraction curves. B, probability density function (pdf) of normalized adhesion forces Fad (ezrin T567A, n = 3849, n = 4 experiments; ezrin WT, n = 6675, n = 5 experiments; and ezrin T567D, n = 17216, n = 7 experiments). C, probability density function of cumulative surface adhesion energies Wad, norm (ezrin T567A, n = 481, n = 4 experiments, ezrin WT n = 299, n = 5 experiments, and ezrin T567D n = 836, n = 7 experiments). Probability density functions were estimated by histogram analysis (gray bars) and kernel density estimation (solid lines). Median values Fad and Wad,norm are given.
Whereas the median adhesion forces do not considerably change upon PIP2 addition, the distribution of the cumulative adhesion energies deviates significantly in case of ezrin WT and ezrin T567D. We observed a general shift to larger adhesion energies with an extended asymmetric distribution to larger values in presence of PIP2. Notably, in case of ezrin WT two maxima appear at approximately 80 fJ/m2/3 and 310 fJ/m2/3, whereas for ezrin T567D only one maximum at 240 fJ/m2/3 is present. Calculating the median adhesion energy Wad,norm in presence of PIP2 for ezrin WT and ezrin T567D, values of 230 fJ/m2/3 (compared with 170 fJ/m2/3 in the absence of PIP2) and 310 fJ/m2/3 (compared with 130 fJ/m2/3 in the absence of PIP2), respectively, were found. These results clearly indicate that, even though the individual unbinding force for an ezrin F-actin contact is rather weak, the number of contact sites increases considerably upon PIP2 activation of ezrin WT and ezrin T567D, resulting in a substantially larger adhesion energy. This is also evident when only the large adhesion energies are taken into consideration. In the case of ezrin WT and ezrin T567D >30% of the measured adhesion energies are larger than 350 fJ/m2/3, whereas there are no adhesion energies larger than 350 fJ/m2/3 found for ezrin T567A. In this latter case, the adhesion energy shifted only from Wad,norm = 60 fJ/m2/3 to 80 fJ/m2/3 upon addition of PIP2.
Our results show that the observed unbinding forces are rather small, strongly indicating single molecule bond rupturing (41), with values that are almost independent of the phosphorylation state of ezrin and the presence of PIP2. However, the adhesion energies, i.e. the number of contacts strongly correlate with the activation state of the protein. To corroborate this finding we tried to answer the question of whether an individual unbinding force in a single molecule experiment is the same as those observed in our colloidal probe experiment thus proving the idea of many contact points rupturing individually during retraction of the ezrin-decorated colloidal probe from the F-actin surface.
Comparison of Single Molecule with Colloidal Probe Experiments
The experimental setup was identical to that of the colloidal probe experiment, with the only difference being that the colloidal probe was replaced by a gold-coated cantilever with a small tip. The tip radius was approximately 30 nm so that in the ideal case only one protein comes into contact with the F-actin-decorated surface. We used ezrin T567D for single molecule force measurements, as this interaction showed the largest median adhesion force of all three proteins. Force retraction curves were recorded showing rupture events (Fig. 7A) characterized by an unbinding force of approximately 40 pN. From a histogram analysis a median adhesion force Fad = 43 pN was obtained (Fig. 7B). This result indicates that the adhesion force of a single molecule bond rupture is in the same range as those found in our colloidal probe experiments providing strong evidence that only single bonds are probed by colloidal probe microscopy. To obtain the off-rate of the ezrin/F-actin interaction, which is the inverse of the lifetime of the bond, we performed force spectroscopy experiments (Fig. 8). Adhesion force histograms at different loading rates were gathered (Fig. 8A), from which the mean adhesion forces dependent on the loading rate were extracted (Fig. 8B). The results show a linear dependence of the mean adhesion force on the loading rate up to 30 nN/s. Applying the kinetic model derived by Evans and Ritchie (48, 49) to this regime allows to extract the off rate to be koff = 1.3 s−1 with a potential width of 0.7 nm at 294 K. The determined lifetime (koff > 1 s−1) is short compared with most common biological noncovalent bonds, suggesting that the dynamics of the bond prevails over stability.
FIGURE 7.
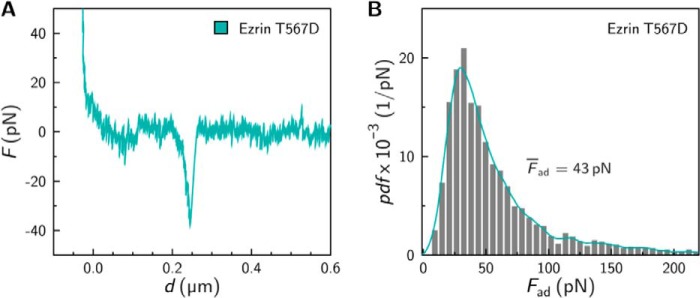
Single molecule force experiments. A, representative force retraction curve exhibiting a single molecule rupture event upon retraction of an ezrin T567D functionalized cantilever tip from an F-actin-covered surface. B, histogram showing the adhesion forces obtained from single molecule experiments (n = 5 independent experiments).
FIGURE 8.
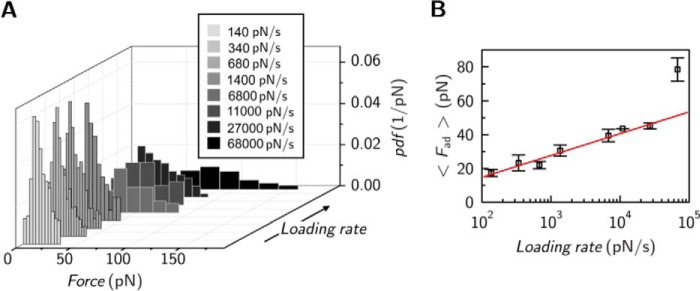
Interaction between ezrin T567D and F-actin as a function of applied loading rate in single molecule experiments. A, adhesion force histograms at different loading rates. B, loading rate dependence of mean adhesion force in single molecule experiments (n = 28 independent experiments).
Impact of PIP2 on the Ezrin/F-actin Interaction in MDCK II Cells
To investigate whether PIP2 also increases the adhesion of F-actin to ezrin in vivo, we measured the membrane tension of MDCK II cells as a function of the PIP2 level in the cell. Membrane tension is known to be primarily governed by the strength and number of cytoskeleton-membrane contact sites and is therefore an ideal measure for the adhesion strength in this composite structure (11, 50). PIP2 micelles were injected into the cytosol of individual confluent MDCK II cells using a microinjector, and membrane tension was probed by pulling membrane tethers with a modified AFM tip from the injected cell and control cells adjacent to the injected one. Tether pulling results in a plateau force, from which the membrane tension was computed (30–32). The fluorescence images depicted in Fig. 9 clearly show that the increase in PIP2 concentration results in a recruitment of ezrin to the apical part of the cell (Fig. 9, A–F, arrow) concomitant with an increased F-actin density in this area (Fig. 9G, arrow). Remarkably, the increase in ezrin at the plasma membrane is accompanied by an increase in membrane tension by 50% compared with non-PIP2-injected cells (Fig. 9H). To further elucidate to what extend ezrin is responsible for membrane tension, we suppressed ezrin expression in MDCK II cells using siRNA (Fig. 10A). Indeed, in this case the membrane tension dropped by 40% for ezrin-lacking cells compared with control cells (Fig. 10B). This result indicates the importance of ezrin for the establishment of membrane tension.
FIGURE 9.
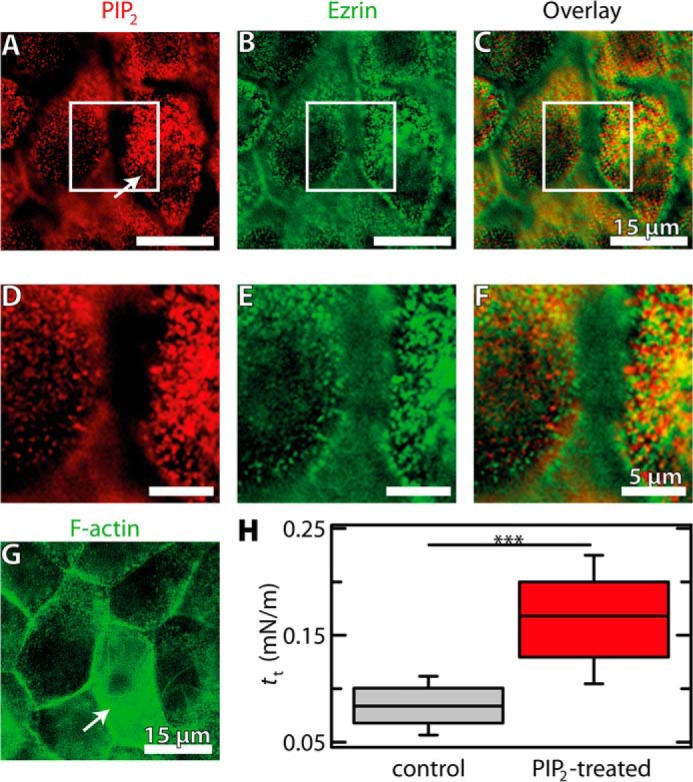
Impact of PIP2 microinjection into confluent MDCK II cells. A–G, fluorescence micrographs of MDCK II cells. The white boxes in the top row images show the regions used for zoom depicted in the middle row images. Cells were stained for PIP2 (A and D, red, Alexa Fluor 546 IgG goat anti-mouse) and ezrin (B and E, green, Alexa Fluor 488 IgG goat anti-mouse). C and F show overlay images from A/B and D/E, respectively. G, fluorescence micrograph of MDCK II cells stained for F-actin (green, Alexa Fluor 488-phalloidin). The arrow marks the PIP2-treated cell. H, box plot distribution showing membrane tension tt of PIP2-treated cells after 3 h (n = 136 retraction curves, n = 4 injected cells) and control (n = 108 retraction curves, n = 5 cells). Whiskers extend from the 20th to the 80th percentile. Asterisks indicate a statistical difference (p < 0.001, Wilcoxon rank sum test).
FIGURE 10.
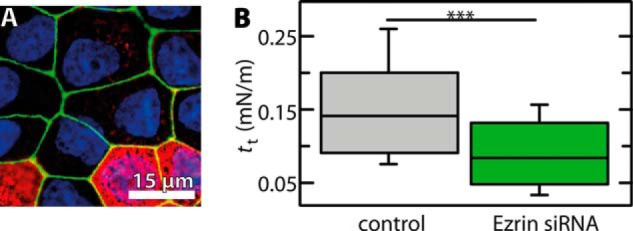
Influence of gene silencing of ezrin by siRNA in confluent MDCK II cells. A, fluorescence micrograph of cells stained for ezrin (red, Alexa Fluor 546 IgG goat anti-mouse), nucleus (blue, DAPI), and ZO-1 (green, Alexa Fluor 488-conjugated ZO-1 monoclonal antibody). B, box plot distribution showing membrane tension tt of ezrin-depleted cells (n = 85 retraction curves, n = 20 depleted cells) and control (n = 166 retraction curves, n = 13 cells). Whiskers extend from the 20th to the 80th percentile. Asterisks indicate a statistical difference (p < 0.001, Wilcoxon rank sum test).
DISCUSSION
Our data identify PIP2 as the key player in the activation of the ezrin/F-actin interaction. PIP2 binding increases the number of weak interacting bonds between ezrin and F-actin thereby increasing the adhesion energy. Colloidal probe microscopy enabled us to describe this interaction on a molecular level, dissecting the individual contributions of ezrin phosphorylation and PIP2 binding. Moreover, in vivo experiments suggest an increased interaction of F-actin with ezrin upon PIP2 injection into cells, reflected by an increased membrane tension. It is well established that the F-actin binding capability of ezrin is regulated by an intramolecular association of the N-ERMAD and C-ERMAD (14). A conformational switch between the closed, “dormant” state and the open state exposing the F-actin binding site regulates actin filament interaction (51). Two factors, namely the phosphorylation of threonine 567 and the binding of the N-ERMAD to PIP2, are discussed in terms of ezrin activation resulting in its F-actin binding capability (1, 36). The adhesion force found for the interaction of the N-ERMAD lacking the F-actin binding domain (Fad = 28 pN) is significantly smaller than those monitored for full-length ezrin (Fad > 43 pN). We attribute the smaller unbinding force to a nonspecific interaction between the protein and F-actin. The adhesion forces for all full-length ezrin variants are in the range of 50 pN with a slight tendency to larger values for ezrin WT and ezrin T567D. Even though we performed colloidal probe experiments with the principal option of multiple bond formation, the observed adhesion forces of approximately 50 pN suggested that only individual bonds between ezrin and F-actin were probed and not a larger number of parallel bonds rupturing simultaneously. This notion was supported by single molecule force measurements showing a very similar force distribution with a median adhesion force of 43 pN (Fig. 8). This finding can be explained first, by the rough surface of the gold colloid and the heterogeneous F-actin surface leading to successive bond openings rather than cooperative shared load. Second, as described by Seifert (52) and Lorenz et al. (24), the measured adhesion force is a function of the overall stiffness of the system ksys = kckb/(Nkb+kc) comprising the stiffness of the cantilever kc, the stiffness of the ezrin-F-actin bond kb, and the number of formed bonds N. Two limiting cases can be envisioned in force experiments, in which the distance instead of the force is controlled: (i) if kb ≫ kc (soft transducer), this results in a shared load among the N formed bonds, which would result in a cooperative bond rupturing; (ii) if Nkb ≪ kc (stiff transducer), a noncooperative loading is expected, resulting in the observation of single bond ruptures. To analyze which situation is more relevant in our setup, we determined ksys by fitting linear regressions to the part of the force distance curve preceding the rupture events. The values were cast into a histogram leading to a most probable ksys = 2.2 pN/nm. This value is much smaller than the stiffness of the colloidal probe cantilever, which was determined to be kc ≈ 40 pN/nm. Thus, ksys is mainly determined by Nkb resulting in a loading situation where Nkb < kc, which means that even if several bonds were formed, only single rupture events should be detected. The number of bonds N was estimated from the overall mean molecular stiffness <Nkb> and its variance σ2 assuming a Poisson distribution satisfying the identity kb = σ2/<Nkb> (24). We calculated <ksys> ≈ <Nkb> from the distribution of ksys yielding a kb = 4.6 pN/nm with N∼1. In addition, even if several bonds ruptured simultaneously, the rupture force does not yet scale linearly (24, 52, 53). These considerations not only explain why forces of individual bonds are detected but also why, even if multiple bonds were formed, only a slight shift in rupture forces to larger values should occur, which was found for ezrin WT and ezrin T567D.
Our results also demonstrate that, independent of the activation state very similar unbinding forces were measured. If we assume that the 50-pN force represents the specific interaction of C-ERMAD with F-actin, the rupture force is expected to be an independent value as only those proteins are probed that are in the active state and expose the C-ERMAD. We found that even inactive ezrin T567A proteins display some accessible F-actin binding sites. Therefore we expect that the number of accessible F-actin binding sites, i.e. the number of ezrin proteins being in the open conformation, should be decisive and depend on the activation state of the protein. Indeed, we found that the number of possible specific interactions is substantially increased upon activation of ezrin by adding PIP2 being most pronounced for ezrin WT and ezrin T567D in the presence of PIP2. In these two cases, the adhesion energies are considerably shifted to larger values reflecting the presence of several bonds that together yield appreciable adhesion energy.
The pivotal role of PIP2 in switching the protein to an open conformation, in which the F-actin binding site becomes more accessible, has been described in a number of studies. A conformational change upon PIP2 binding was discussed by Maniti et al. (54), who showed that ezrin digestion catalyzed by chymotrypsin is more pronounced in presence of PIP2. Carvalho et al. (45) reported on a PIP2-induced conformational change of ezrin WT monitored by a change of the intrinsic tryptophan fluorescence. Similar to our experimental approach, both studies employed monomeric PIP2 at submicellar concentrations, i.e. not embedded in a membrane. However, PIP2 embedded in a lipid membrane caused a similar quenching of the intrinsic tryptophan fluorescence when ezrin was bound (54). Another indication of a more accessible F-actin binding site of ezrin in the presence of PIP2 was obtained by Janke et al. (44). They reported increased cumulative adhesion energies if a colloidal probe decorated with F-actin was retracted from a surface composed of ezrin WT bound to a PIP2-containing membrane compared with ezrin WT bound via its His6 tag to a membrane doped with the lipid DOGS-NTA-Ni.
In the absence of PIP2, the number of ezrin molecules being in the open conformation appears to be less if one compares the cumulative adhesion energies for ezrin WT Wad,norm = 170 fJ/m2/3 and 130 fJ/m2/3 for ezrin T567D with those in the presence of PIP2. If one assumes that the phospho-mimicking amino acid aspartic acid is sufficient for the conformational switch to occur, one would expect to observe larger adhesion energies for ezrin T567D than for ezrin WT, which is, however not the case. Of note, the replacement of a threonine by an aspartic acid does not fully mimic a phosphorylated threonine, even though this mutation has been frequently used (37–40). There is evidence that the T567D mutation impairs the association of the C-ERMAD and N-ERMAD only to a minor extent (40, 55) which would imply that the expected conformations of ezrin WT and ezrin T567D are similar with a tendency to be in the closed conformation, in which the F-actin binding site is not readily accessible. For radixin, Hoeflich et al. (56) reported that the phospho-mimicking mutant can adopt both conformations, closed and open, resulting in an observable representing the time average of the two states. Also in in vivo experiments, there are several lines of evidence suggesting that the phosphorylation of ERM proteins is not required for establishing a plasma membrane/F-actin linkage. Yonemura et al. (46) reported that in certain cell lines neither the activation of the Rho kinase nor the phosphorylation of ERM proteins was required to activate ERM proteins. Roch et al. (22) analyzed the contribution of PIP2 binding and phosphorylation to the regulation of moesin during Drosophila development. Based on their results they proposed that PIP2 recruits ERM proteins to the membrane from a cytoplasmic pool of dormant molecules. Even nonphosphorylated ERM proteins are capable of associating with F-actin, and an open conformation can then be phosphorylated to stabilize the linkage. This idea is supported by our molecular force measurements showing that only PIP2 strongly increases the number of open conformations capable of interacting with F-actin and giving rise to large adhesion energy between the ezrin/F-actin interface, even though the individual bond is rather weak.
Following injecting PIP2 into MDCK II cells, we noted an increased level of this lipid in the plasma membrane. Golebiewska et al. (57) injected PIP2 micelles into fibroblasts and also found that the injected lipid was incorporated into the inner leaflet of the plasma membrane. These authors reported a significantly reduced diffusion coefficient for the injected lipid, which they attributed to a binding of lipids to the underlying cytoskeleton. The present study on the microinjection of PIP2 into MDCK II cells largely confirms these results and also localizes the injected PIP2 to sites of ezrin and F-actin enrichment. These observations suggest a stronger linkage between the cortex to the plasma membrane in PIP2-injected cells. Indeed, mechanical investigation of membrane tension after microinjection of PIP2 revealed a significant increase in membrane tension. Together with the finding that ezrin depletion by siRNA-mediated gene silencing results in a drop in membrane tension, we suggest that the elevated values for the membrane tension could be attributed to an increased number of activated ezrin molecules. A larger number of membrane-cytoskeleton linkages is in line with the observed increased number of attachment sites for PIP2-treated ezrin in our in vitro experiments.
We were able to show that ezrin forms rather weak bonds to F-actin with an unbinding force of approximately 50 pN. The activation process, i.e. the conformational switch leading to an exposure of the F-acting binding site, is mainly driven by PIP2 leading to an increased number of active ezrin molecules. This behavior can support a dynamic response of the cell cortex. Only if multiple weak bonds are formed between the plasma membrane and the actin cortex, can the cell dynamically control cell adhesion and migration as well as regulate its morphology.
This work was supported by Deutsche Forschungsgemeinschaft Grant STE 884/11-1, GE 514/8-1, and GE 514/9-1.
- ERM
- ezrin-radixin-moesin
- AFM
- atomic force microscope
- AUT+
- (11-mercaptoundecyl)trimethylammonium
- C-ERMAD
- C-terminal ERM association domain
- DOGS-NTA-Ni
- 1,2-dioleoyl-sn-glycero-3-[(N-(5-amino-1-carboxypentyl)iminodiacetic acid)succinyl] (nickel salt)
- matrix thiol
- (1-mercaptoundec-11-yl)tri(ethylene glycol)
- MDCK
- Madin-Darby canine kidney
- N
- newton
- N-ERMAD
- N-terminal ERM association domain
- Ni-NTA
- nickel-nitrilotriacetic acid
- NTA-thiol
- N-[5-[[[(20-mercapto-3,6,9-trioxaeicos-1-yl)oxo]carbonyl] amino]-1-carboxypentyl]iminodiacetic acid
- PIP2
- phosphatidylinositol 4,5-bisphosphate.
REFERENCES
- 1. Fehon R. G., McClatchey A. I., Bretscher A. (2010) Organizing the cell cortex: the role of ERM proteins. Nat. Rev. Mol. Cell Biol. 11, 276–287 [DOI] [PMC free article] [PubMed] [Google Scholar]
- 2. Bretscher A., Edwards K., Fehon R. G. (2002) ERM proteins and merlin: integrators at the cell cortex. Nat. Rev. Mol. Cell Biol. 3, 586–599 [DOI] [PubMed] [Google Scholar]
- 3. Zwaenepoel I., Naba A., Da Cunha M. M., Del Maestro L., Formstecher E., Louvard D., Arpin M. (2012) Ezrin regulates microvillus morphogenesis by promoting distinct activities of Eps8 proteins. Mol. Biol. Cell 23, 1080–1094 [DOI] [PMC free article] [PubMed] [Google Scholar]
- 4. Saotome I., Curto M., McClatchey A. I. (2004) Ezrin is essential for epithelial organization and villus morphogenesis in the developing intestine. Dev. Cell 6, 855–864 [DOI] [PubMed] [Google Scholar]
- 5. LaLonde D. P., Garbett D., Bretscher A. (2010) A regulated complex of the scaffolding proteins pdzk1 and ebp50 with ezrin contribute to microvillar organization. Mol. Biol. Cell 21, 1519–1529 [DOI] [PMC free article] [PubMed] [Google Scholar]
- 6. Crepaldi T., Gautreau A., Comoglio P. M., Louvard D., Arpin M. (1997) Ezrin is an effector of hepatocyte growth factor-mediated migration and morphogenesis in epithelial cells. J. Cell Biol. 138, 423–434 [DOI] [PMC free article] [PubMed] [Google Scholar]
- 7. Arpin M., Chirivino D., Naba A., Zwaenepoel I. (2011) Emerging role for ERM proteins in cell adhesion and migration. Cell Adh. Migr. 5, 199–206 [DOI] [PMC free article] [PubMed] [Google Scholar]
- 8. Ren L., Hong S. H., Cassavaugh J., Osborne T., Chou A. J., Kim S. Y., Gorlick R., Hewitt S. M., Khanna C. (2009) The actin-cytoskeleton linker protein ezrin is regulated during osteosarcoma metastasis by PKC. Oncogene 28, 792–802 [DOI] [PMC free article] [PubMed] [Google Scholar]
- 9. Brambilla D., Fais S. (2009) The Janus-faced role of ezrin in “linking” cells to either normal or metastatic phenotype. Int. J. Cancer 125, 2239–2245 [DOI] [PubMed] [Google Scholar]
- 10. Larson S. M., Lee H. J., Hung P. H., Matthews L. M., Robinson D. N., Evans J. P. (2010) Cortical mechanics and meiosis II completion in mammalian oocytes are mediated by myosin-II and ezrin-radixin-moesin (ERM) proteins. Mol. Biol. Cell 21, 3182–3192 [DOI] [PMC free article] [PubMed] [Google Scholar]
- 11. Diz-Muñoz A., Krieg M., Bergert M., Ibarlucea-Benitez I., Muller D. J., Paluch E., Heisenberg C. P. (2010) Control of directed cell migration in vivo by membrane-to-cortex attachment. PLoS Biol. 8, e1000544. [DOI] [PMC free article] [PubMed] [Google Scholar]
- 12. Liu Y., Belkina N. V., Park C., Nambiar R., Loughhead S. M., Patino-Lopez G., Ben-Aissa K., Hao J. J., Kruhlak M. J., Qi H., von Andrian U. H., Kehrl J. H., Tyska M. J., Shaw S. (2012) Constitutively active ezrin increases membrane tension, slows migration, and impedes endothelial transmigration of lymphocytes in vivo in mice. Blood 119, 445–453 [DOI] [PMC free article] [PubMed] [Google Scholar]
- 13. Krieg M., Helenius J., Heisenberg C. P., Müller D. J. (2008) A bond for a lifetime: employing membrane nanotubes from living cells to determine receptor-ligand kinetics. Angew. Chem. Int. Ed. 47, 9775–9777 [DOI] [PubMed] [Google Scholar]
- 14. Gary R., Bretscher A. (1995) Ezrin self-association involves binding of an N-terminal domain to a normally masked C-terminal domain that includes the F-actin binding site. Mol. Biol. Cell 6, 1061–1075 [DOI] [PMC free article] [PubMed] [Google Scholar]
- 15. Nakamura F., Amieva M. R., Furthmayr H. (1995) Phosphorylation of threonine 558 in the carboxyl-terminal actin-binding domain of moesin by thrombin activation of human platelets. J. Biol. Chem. 270, 31377–31385 [DOI] [PubMed] [Google Scholar]
- 16. Matsui T., Maeda M., Doi Y., Yonemura S., Amano M., Kaibuchi K., Tsukita S., Tsukita S. (1998) Rho-kinase phosphorylates COOH-terminal threonines of ezrin/radixin/moesin (ERM) proteins and regulates their head-to-tail association. J. Cell Biol. 140, 647–657 [DOI] [PMC free article] [PubMed] [Google Scholar]
- 17. Simons P. C., Pietromonaco S. F., Reczek D., Bretscher A., Elias L. (1998) C-terminal threonine phosphorylation activates ERM proteins to link the cell's cortical lipid bilayer to the cytoskeleton. Biochem. Biophys. Res. Commun. 253, 561–565 [DOI] [PubMed] [Google Scholar]
- 18. Ng T., Parsons M., Hughes W. E., Monypenny J., Zicha D., Gautreau A., Arpin M., Gschmeissner S., Verveer P. J., Bastiaens P. I., Parker P. J. (2001) Ezrin is a downstream effector of trafficking pkc-integrin complexes involved in the control of cell motility. EMBO J. 20, 2723–2741 [DOI] [PMC free article] [PubMed] [Google Scholar]
- 19. Niggli V., Andréoli C., Roy C., Mangeat P. (1995) Identification of a phosphatidylinositol 4,5-bisphosphate-binding domain in the N-terminal region of ezrin. FEBS Lett. 376, 172–176 [DOI] [PubMed] [Google Scholar]
- 20. Ben-Aissa K., Patino-Lopez G., Belkina N. V., Maniti O., Rosales T., Hao J. J., Kruhlak M. J., Knutson J. R., Picart C., Shaw S. (2012) Activation of moesin, a protein that links actin cytoskeleton to the plasma membrane, occurs by phosphatidylinositol 4,5-bisphosphate (PIP2) binding sequentially to two sites and releasing an autoinhibitory linker. J. Biol. Chem. 287, 16311–16323 [DOI] [PMC free article] [PubMed] [Google Scholar]
- 21. Fievet B. T., Gautreau A., Roy C., Del Maestro L., Mangeat P., Louvard D., Arpin M. (2004) Phosphoinositide binding and phosphorylation act sequentially in the activation mechanism of ezrin. J. Cell Biol. 164, 653–659 [DOI] [PMC free article] [PubMed] [Google Scholar]
- 22. Roch F., Polesello C., Roubinet C., Martin M., Roy C., Valenti P., Carreno S., Mangeat P., Payre F. (2010) Differential roles of PtdIns(4,5)P2 and phosphorylation in moesin activation during Drosophila development. J. Cell Sci. 123, 2058–2067 [DOI] [PubMed] [Google Scholar]
- 23. Lorenz B., Keller R., Sunnick E., Geil B., Janshoff A. (2010) Colloidal probe microscopy of membrane-membrane interactions: from ligand-receptor recognition to fusion events. Biophys. Chem. 150, 54–63 [DOI] [PubMed] [Google Scholar]
- 24. Lorenz B., Álvarez de Cienfuegos L., Oelkers M., Kriemen E., Brand C., Stephan M., Sunnick E., Yüksel D., Kalsani V., Kumar K., Werz D. B., Janshoff A. (2012) Model system for cell adhesion mediated by weak carbohydrate-carbohydrate interactions. J. Am. Chem. Soc. 134, 3326–3329 [DOI] [PMC free article] [PubMed] [Google Scholar]
- 25. Holmes K. C., Popp D., Gebhard W., Kabsch W. (1990) Atomic model of the actin filament. Nature 347, 44–49 [DOI] [PubMed] [Google Scholar]
- 26. Herrig A., Janke M., Austermann J., Gerke V., Janshoff A., Steinem C. (2006) Cooperative adsorption of ezrin on PIP2-containing membranes. Biochemistry 45, 13025–13034 [DOI] [PubMed] [Google Scholar]
- 27. Koltzscher M., Neumann C., König S., Gerke V. (2003) Ca2+-dependent binding and activation of dormant ezrin by dimeric S100P. Mol. Biol. Cell 14, 2372–2384 [DOI] [PMC free article] [PubMed] [Google Scholar]
- 28. Cooper J. (1987) Effects of cytochalasin and phalloidin on actin. J. Cell Biol. 105, 1473–1478 [DOI] [PMC free article] [PubMed] [Google Scholar]
- 29. Sader J. E., Chon J. W. M., Mulvaney P. (1999) Calibration of rectangular atomic force microscope cantilevers. Rev. Sci. Instrum. 70, 3967–3969 [Google Scholar]
- 30. Sheetz M. P. (2001) Cell control by membrane-cytoskeleton adhesion. Nat. Rev. Mol. Cell Biol. 2, 392–396 [DOI] [PubMed] [Google Scholar]
- 31. Hochmuth R. M., Marcus W. D. (2002) Membrane tethers formed from blood cells with available area and determination of their adhesion energy. Biophys. J. 82, 2964–2969 [DOI] [PMC free article] [PubMed] [Google Scholar]
- 32. Pietuch A., Brückner B. R., Fine T., Mey I., Janshoff A. (2013) Elastic properties of cells in the context of confluent cell monolayers: impact of tension and surface area regulation. Soft Matter. 9, 11490–11502 [Google Scholar]
- 33. Dai J., Sheetz M. P. (1999) Membrane tether formation from blebbing cells. Biophys. J. 77, 3363–3370 [DOI] [PMC free article] [PubMed] [Google Scholar]
- 34. Brochard-Wyart F., Borghi N., Cuvelier D., Nassoy P. (2006) Hydrodynamic narrowing of tubes extruded from cells. Proc. Natl. Acad. Sci. U.S.A. 103, 7660–7663 [DOI] [PMC free article] [PubMed] [Google Scholar]
- 35. Hutter J. L., Bechhoefer J. (1993) Calibration of atomic-force microscope tips. Rev. Sci. Instrum. 64, 1868–1873 [Google Scholar]
- 36. Bosk S., Braunger J. A., Gerke V., Steinem C. (2011) Activation of F-actin binding capacity of ezrin: synergism of PIP2 interaction and phosphorylation. Biophys. J. 100, 1708–1717 [DOI] [PMC free article] [PubMed] [Google Scholar]
- 37. Gandy K. A., Canals D., Adada M., Wada M., Roddy P., Snider A. J., Hannun Y. A., Obeid L. M. (2013) Ezrin mutants affecting dimerization and activation. Biochem. J. 449, 661–672 [DOI] [PMC free article] [PubMed] [Google Scholar]
- 38. Yonemura S., Tsukita S., Tsukita S. (1999) Direct involvement of ezrin/radixin/moesin (ERM)-binding membrane proteins in the organization of microvilli in collaboration with activated ERM proteins. J. Cell Biol. 145, 1497–1509 [DOI] [PMC free article] [PubMed] [Google Scholar]
- 39. Gautreau A., Louvard D., Arpin M. (2000) Morphogenic effects of ezrin require a phosphorylation-induced transition from oligomers to monomers at the plasma membrane. J. Cell Biol. 150, 193–203 [DOI] [PMC free article] [PubMed] [Google Scholar]
- 40. Chambers D. N., Bretscher A. (2005) Ezrin mutants affecting dimerization and activation. Biochemistry 44, 3926–3932 [DOI] [PubMed] [Google Scholar]
- 41. Bizzarri A. R., Cannistraro S. (2010) The application of atomic force spectroscopy to the study of biological complexes undergoing a biorecognition process. Chem. Soc. Rev. 39, 734–749 [DOI] [PubMed] [Google Scholar]
- 42. Hertz H. (1881) Über die Berührung fester elastischer Körper. J. Reine Angew. Math. 92, 156–171 [Google Scholar]
- 43. Butt H. J., Cappella B., Kappl M. (2005) Force measurements with the atomic force microscope: technique, interpretation and applications. Surf. Sci. Rep. 59, 1–152 [Google Scholar]
- 44. Janke M., Herrig A., Austermann J., Gerke V., Steinem C., Janshoff A. (2008) Actin binding of ezrin is activated by specific recognition of PIP2-functionalized lipid bilayers. Biochemistry 47, 3762–3769 [DOI] [PubMed] [Google Scholar]
- 45. Carvalho K., Khalifat N., Maniti O., Nicolas C., Arold S., Picart C., Ramos L. (2010) Phosphatidylinositol 4,5-bisphosphate-induced conformational change of ezrin and formation of ezrin oligomers. Biochemistry 49, 9318–9327 [DOI] [PubMed] [Google Scholar]
- 46. Yonemura S., Matsui T., Tsukita S., Tsukita S. (2002) Rho-dependent and -independent activation mechanisms of ezrin/radixin/moesin proteins: an essential role for polyphosphoinositides in vivo. J. Cell Sci. 115, 2569–2580 [DOI] [PubMed] [Google Scholar]
- 47. Moens P. D., Bagatolli L. A. (2007) Profilin binding to sub-micellar concentrations of phosphatidylinositol (4,5)bisphosphate and phosphatidylinositol (3,4,5)trisphosphate. Biochim. Biophys. Acta 1768, 439–449 [DOI] [PubMed] [Google Scholar]
- 48. Evans E., Ritchie K. (1997) Dynamic strength of molecular adhesion bonds. Biophys. J. 72, 1541–1555 [DOI] [PMC free article] [PubMed] [Google Scholar]
- 49. Evans E., Ritchie K. (1999) Strength of a weak bond connecting flexible polymer chains. Biophys. J. 76, 2439–2447 [DOI] [PMC free article] [PubMed] [Google Scholar]
- 50. Raucher D., Stauffer T., Chen W., Shen K., Guo S., York J. D., Sheetz M. P., Meyer T. (2000) Phosphatidylinositol 4,5-bisphosphate functions as a second messenger that regulates cytoskeleton-plasma membrane adhesion. Cell 100, 221–228 [DOI] [PubMed] [Google Scholar]
- 51. Bretscher A., Reczek D., Berryman M. (1997) Ezrin: a protein requiring conformational activation to link microfilaments to the plasma membrane in the assembly of cell surface structures. J. Cell Sci. 110, 3011–3018 [DOI] [PubMed] [Google Scholar]
- 52. Seifert U. (2000) Rupture of multiple parallel molecular bonds under dynamic loading. Phys. Rev. Lett. 84, 2750–2753 [DOI] [PubMed] [Google Scholar]
- 53. Erdmann T., Schwarz U. S. (2004) Stochastic dynamics of adhesion clusters under shared constant force and with rebinding. J. Chem. Phys. 121, 8997–9017 [DOI] [PubMed] [Google Scholar]
- 54. Maniti O., Khalifat N., Goggia K., Dalonneau F., Guérin C., Blanchoin L., Ramos L., Picart C. (2012) Binding of moesin and ezrin to membranes containing phophatidylinositol (4,5)bisphosphate: a comparative study of the affinity constants and conformational changes. Biochim. Biophys. Acta 1818, 2839–2849 [DOI] [PMC free article] [PubMed] [Google Scholar]
- 55. Jayasundar J. J., Ju J. H., He L., Liu D., Meilleur F., Zhao J., Callaway D. J., Bu Z. (2012) Open conformation of ezrin bound to phosphatidylinositol 4,5-bisphosphate and to F-actin revealed by neutron scattering. J. Biol. Chem. 287, 37119–37133 [DOI] [PMC free article] [PubMed] [Google Scholar]
- 56. Hoeflich K. P., Tsukita S., Hicks L., Kay C. M., Tsukita S., Ikura M. (2003) Insights into a single rod-like helix in activated radixin required for membrane-cytoskeletal cross-linking. Biochemistry 42, 11634–11641 [DOI] [PubMed] [Google Scholar]
- 57. Golebiewska U., Nyako M., Woturski W., Zaitseva I., McLaughlin S. (2008) Diffusion coefficient of fluorescent phosphatidylinositol 4,5-bisphosphate in the plasma membrane of cells. Mol. Biol. Cell 19, 1663–1669 [DOI] [PMC free article] [PubMed] [Google Scholar]