

Abstract
Interval cancers (ICs), defined as cancers detected between regular screening mammograms, have been shown to be of higher grade, larger size, and associated with lower survival, compared with screen-detected cancers (SDCs) and comprise 17% of cancers from population-based screening programs. We sought to determine the frequency of ICs in a study of locally advanced breast cancers, the I-SPY 1 TRIAL. Screening was defined as having a mammogram with 2 years, and the proportion of ICs at 1 and 2 years was calculated for screened patients. Differences in clinical characteristics for ICs versus SDCs and screened versus non-screened cancers were assessed. For the 219 evaluable women, mean tumor size was 6.8 cm. Overall, 80% of women were over 40 and eligible for screening; however, only 31% were getting screened. Among women screened, 85% were ICs, with 68% diagnosed within 1 year of a previously normal mammogram. ICs were of higher grade (49% vs. 10%) than SDCs. Among non-screened women, 28% (43/152) were younger than the recommended screening age of 40. Of the entire cohort, 12% of cancers were mammographically occult (MO); the frequency of MO cancers did not differ between screened (11%) and non-screened (15%). ICs were common in the I-SPY 1 TRIAL suggesting the potential need for new approaches beyond traditional screening to reduce mortality in women who present with larger palpable cancers.
Keywords: Screening, Neoadjuvant, Interval cancer
Introduction
Screening was designed to identify cancers at an early stage, with the goal of reducing mortality from breast cancer. Following twenty years of screening for breast cancer, we have seen a significant increase in the detection of early cancers. However, screening does not appear to have resulted in a concomitant reduction in regional or more locally advanced disease, suggesting that more aggressive disease may not be as amenable to early detection by conventional screening modalities [1]. Tumors presenting with a larger size or advanced stage may possibly have a different biology and be very difficult to detect “early” because of faster growth rates and properties that enable early dissemination.
Breast cancer is heterogeneous and is comprised of several tumor types with different growth and dissemination trajectories. Figure 1 illustrates tumor growth rates relative to screening intervals. Tumor A represents an indolent tumor that may never come to clinical attention, and may be unnecessarily treated. Tumor B will benefit most from periodic screening, as earlier detection will identify tumors prior to spread and enable a higher rate of cure [2, 3]. Tumor C has a rapid growth curve and will most likely present as a clinical mass prior to detection by routine screening.
Fig. 1.

Tumor growth rates and periodic screening. Growth rates for three tumor types are illustrated in years. Shown is the progression of cancer, beginning as an early cancer (microscopic disease), as a localized tumor that is mostly likely to be cured, as regional disease that is less likely curable, and as distant, metastatic disease resulting in death. Tumor type A is a slow-growing cancer that may never be detected in a patient’s lifetime. Type B tumors are detectable by screening and will be cured by early detection. Type C tumors grow very rapidly, becoming clinically apparent during the interval between annual screening mammography. Type C tumors do not benefit from current screening approaches
Interval cancers (ICs) are masses that present clinically during the interval between routine screening mammograms. Over the past three decades, screening programs have continued to face the problem of ICs [4–7], which are neither missed nor mammographically occult tumors. In the large screening trials in Sweden, when the screening interval was defined as 24 months [4–6], the rate of ICs is approximately 17%. IC rates vary by age and may be as high as 43% [8, 9] in younger age groups. The bulk of the data support the conclusion that ICs, compared with their screen-detected counterparts, are rapidly growing (higher grade and larger size), more aggressive (higher frequency of nodal metastases), and more frequently present in younger women [8, 10–12]. It is likely that ICs represent type C tumors in Fig. 1.
The tumor biology of ICs may be a reflection of the rapid doubling time, arising from high cellular proliferation rates and a dysregulated cell cycle, thus growing to a detectable size at shorter intervals, and may be missed by screening mammography [13, 14]. Additionally, differences in outcome may be related to a differential distribution of breast cancer subtypes, although scant data exist [15–17].
The I-SPY 1 TRIAL (CALGB 150007/150012, ACRIN 6657) (Investigation of Serial Studies to Predict Your Therapeutic Response with Imaging And moLecular analysis) was a multicenter study for women with locally advanced breast cancer of 3 cm or larger and without evidence of metastatic disease, to characterize tumor biology and response to neoadjuvant therapy by serial MRI and biomarkers. I-SPY 1 provides an opportunity to evaluate the frequency of ICs and their associated biology and explore differences between interval and screen-detected cancers (SDCs) in a population of higher-risk tumors. I-SPY 1 was a collaborative effort between the American College of Radiology Imaging Network (ACRIN), the Cancer and Leukemia Group B (CALGB), and Specialized Program of Research Excellence (SPORE). A total of 237 women were accrued from nine institutions between May 2002 and March 2006 (Table 1) [18].
Table 1.
I-SPY 1 TRIAL institutions
| Institution | N | % |
|---|---|---|
| Georgetown University | 4 | 2 |
| Memorial Sloan-Kettering Cancer Center | 17 | 8 |
| University of Alabama | 47 | 21 |
| University of California, San Francisco | 66 | 30 |
| University of Chicago | 2 | 1 |
| University of North Carolina-Chapel Hill | 30 | 14 |
| University of Pennsylvania | 36 | 16 |
| University of Texas, Southwestern | 13 | 5 |
| University of Washington | 6 | 3 |
| Total | 221 | 100 |
The purpose of the current study was to determine the frequency of ICs in a population of women with stage 2 and 3 breast cancers and to identify patient and tumor characteristics of ICs. We compared patient age and ethnicity, tumor size, tumor stage and grade, immunohisto-chemical biomarkers, and molecular subtypes.
Methods and patient accrual
Demographic and pathologic variables were prospectively collected and analyzed from the population of women enrolled in the I-SPY 1 TRIAL. The distribution of patients from the nine centers is shown in Table 1. Of the 237 patients enrolled in I-SPY 1, 221 completed the study. Data from the trial were centrally assembled using caIntegrator, a framework developed by the NCI to integrate biomedical data on a common platform [19]. Data obtained included patient age, race, menopausal status, tumor grade, tumor size, American Joint Committee on Cancer (AJCC) stage, number of lymph nodes, and receptor status. Consent obtained for the original study allowed comprehensive use of data for subsequent studies, as well as the collection of additional data that could be put into caINTEGRATOR.
Data collection on screening history
Screening history was retrospectively obtained. A standardized data collection form was distributed to all sites and used to collect data including the date the mass was detected, the method of detection (physical examination, clinical examination, or screening mammogram), and dates of all prior screening mammograms. Initial consult dictations from the breast surgeon, oncologist, and radiologist reports were included in the primary data source to ensure capture of outside imaging studies, as many women in this study were referred from outside institutions and screening facilities.
Tumors discovered either by self-examination or clinical examination were reported by patients as having been detected either on a specific day (e.g. May 31, 2002) or during a generalized period (e.g., “sometime in the past few weeks”). If reported as “sometime in the past few weeks,” the date of detection was extrapolated from the date of the clinician’s dictation and recorded as month and year. The date of detection for tumors identified on screening mammograms was collected from the radiology report.
Patient categorization by screening history
Two of 221 patients presented with breast masses and associated clinical symptoms that were indeterminate following extensive workups and were excluded from the study. The remaining 219 evaluable patients were categorized into two groups: screened (patients with a normal screening mammogram within the previous two years) or non-screened (patients with no prior history of imaging and patients with a previous screening mammogram obtained greater than two years prior to diagnosis). All screened patients were age 40 years and older. For comparability, the non-screened patients were divided by age into <40 and ≥40 years old.
The screened group was further segregated into ICs and SDCs. A cancer is classified as IC if a patient presents with clinical symptoms of a cancer within 24 months of a prior normal screening mammogram or a diagnostic mammo-gram was ordered for evaluation of a mass within 24 months of a prior normal screening mammogram. A cancer is defined as SDC if it was first identified on a routine screening mammogram.
ICs were further subdivided into either “early” or “late,” based on the length of time between date of tumor detection and last normal screening mammogram, with early ICs detected <1 year and late ICs detected within 1–2 years of a normal screening mammogram.
Mammographic assessment
Breast imaging categories were based on Breast Imaging Reporting and Data System (BI-RADS) guidelines: 0 further imaging required, 1 negative mammogram, 2 benign findings, 3 likely benign (<2% chance of malignancy) 6-month follow-up recommended, 4 suspicious abnormality (2–95% chance of malignancy) biopsy recommended, 5 highly suggestive of malignancy (>95% chance), and 6 known biopsy-proven malignancy. Mammographic screening histories were obtained from local radiology reports, which routinely include notation of the dates of prior imaging studies; if available, we used these notations for comparison. If radiology reports were unavailable, physician dictations or clinic notes were used. Designation of “screening mammogram” versus “diagnostic mammogram” (e.g., workup of an abnormal finding such as clinical mass) was noted.
Cancers were designated as mammographically occult if a patient presented with a palpable breast mass but it was not visible on mammography.
Immunohistochemical studies and molecular subtypes
Tumor markers were performed both locally (ER, PR, HER2) and centrally as described previously [18]. Of the central immunohistochemical (IHC) assays performed at UNC, Ki67 and bcl 2 were used in the present analysis. Bcl 2, erbB-2, and EGFR were classified as either positive or negative by IHC staining [18]. Percentage of cells staining for Ki67 were clustered into low (<10%), intermediate (10–25%), and high (>25%). p53 mutations were assessed by gene chip analysis [18].
Expression arrays were available for 149 of the 221 patients as previously described [18].
Expected rates
We derived the expected number of ICs by using the frequency of ICs described in the Norrbotten cohort, in which the frequency of ICs was reported by age in a screening population. We used the fraction of women in the same age groups from I-SPY and the frequency of ICs from Norr-botten to generate the expected IC rates.
Statistical analysis
Clinical and demographic characteristics between patient categories as defined by screening history were compared, and significance was assessed as listed in the “statistical test” column of Tables 2 and 3. All statistical calculations were analyzed using Stata version 11. All P values were from two-sided tests.
Table 2.
Characteristics of screened versus non-screened patients
| Characteristic | Screened (n = 67) | Non- screened (≥40 years) N = 109 | Non- screened ( < 40 years) N = 43 | P value screened versus non- screened (≥40 years) | P value non- screened ( <40 vs. ≥40) | Statistical test |
|---|---|---|---|---|---|---|
| Mean age (years) | 52.1 | 50.9 | 35.6 | 0.30 | NA | t test |
| Age range (years) | 40.6–68.8 | 40.8–68.3 | 26.7–39.7 | |||
| Menopausal status | ||||||
| Pre-menopause | 41% | 43% | 72% | |||
| Post-menopause | 47% | 40% | 5% | 0.52 | < 0.001 | Chi-square test |
| Indeterminate | 12% | 18% | 23% | |||
| Tumor grade (3) | ||||||
| I | 8% | 10% | 5% | |||
| II | 49% | 44% | 37% | |||
| III | 43% | 46% | 58% | 0.73 | 0.17 | Chi-square test: Grade 3 vs. 1&2 |
| Mean tumor size (clinical, cm) | 6.0 | 6.6 | 6.3 | 0.32 | 0.36 | Rank-sum test |
| Mean number positive lymph nodes | 3.0 | 2.0 | 2.1 | 0.11 | 0.54 | Rank-sum test |
| ER positive (%) | 62% | 54% | 55% | 0.28 | 0.91 | Chi-square test |
| Clinical stage | ||||||
| Stage I | 1% | 1% | 2% | |||
| Stage IIA | 27% | 13% | 28% | |||
| Stage IIB | 24% | 33% | 16% | |||
| Stage IIIA | 36% | 32% | 44% | 0.047 | 0.052 | Regress stage on type |
| Stage IIIB | 4% | 6% | 5% | |||
| Stage IIIC | 3% | 3% | 2% | |||
| Inflammatory | 4% | 12% | 2% | |||
| Race nonwhite (%) | 13% | 29% | 33% | 0.015 | 0.70 | Chi-square test |
| Mammogram occult (%) | 9% | 12% | 16% | 0.54 | 0.48 | Chi-square test |
Table 3.
Characteristics of interval cancers versus screen-detected cancers
| Characteristic | Screen-detected cancer
|
Interval cancer
|
P value | Statistical test | ||
|---|---|---|---|---|---|---|
| N | % | N | % | |||
| Total | 10 | 100 | 57 | 100 | ||
| Age (years) | ||||||
| < 40 | 0 | 0 | 0 | 0 | ||
| 40–49 | 4 | 40 | 19 | 33 | 0.47 | Fisher’s Exact |
| > 50 | 6 | 60 | 38 | 67 | ||
| Ethnicity | ||||||
| White | 9 | 90 | 49 | 86 | 0.6 | Fisher’s Exact |
| Nonwhite | 1 | 10 | 8 | 14 | ||
| Stage at diagnosis, AJCC | ||||||
| I | 0 | 0 | 1 | 2 | ||
| II | 6 | 60 | 28 | 49 | 0.87 | Fisher’s Exact |
| III | 4 | 40 | 25 | 44 | ||
| Inflammatory | 0 | 0 | 3 | 5 | ||
| Clinical tumor size (cm) | ||||||
| < 3 | 2 | 20 | 1 | 2 | ||
| 3–5 | 4 | 40 | 15 | 27 | 0.025 | Fisher’s Exact |
| > 5 | 4 | 40 | 40 | 71 | ||
| Histological grade | ||||||
| 1 | 1 | 10 | 4 | 7 | ||
| 2 | 8 | 80 | 24 | 44 | 0.03 | Fisher’s Exact |
| 3 | 1 | 10 | 27 | 49 | ||
| Estrogen receptor | ||||||
| Positive | 9 | 100 | 29 | 56 | 0.01 | Fisher’s Exact |
| Negative | 0 | 0 | 23 | 44 | ||
| Progesterone receptor | ||||||
| Positive | 7 | 78 | 25 | 48 | 0.01 | Fisher’s Exact |
| Negative | 2 | 22 | 27 | 52 | ||
| Molecular subtype | ||||||
| Basal like | 0 | 0 | 14 | 36 | ||
| Luminal A | 2 | 33 | 14 | 36 | ||
| Luminal B | 4 | 67 | 5 | 13 | 0.04 | Fisher’s Exact |
| Her2 +/ER− | 0 | 0 | 5 | 13 | ||
| Normal | 0 | 0 | 1 | 3 | ||
Results
Screened versus non-screened patients
Of the 219 evaluable patients, 31% were classified as screened, of which 85% were ICs (Fig. 2). The fraction of non-screened patients was high. Of the non-screened group, 28% (43/152) of women were under the age of 40 and therefore would not have been recommended to undergo screening, whereas, 72% were older than 40 and eligible for screening. From record review, we could document that 8% of patients 40 years or older had a screening mammogram within 3 years, and 13% had a screening mammogram >3 years prior. The proportion of non-screened women over the age of 40 as compared to the total study population was high across the majority of sites, ranging from 53 to 92%.
Fig. 2.

Distribution of I-SPY 1 patients. The I-SPY 1 cohort consisted of 221 patients. Two patients were excluded. Screened patients had documented screening mammograms within 2 years. Non-screened patients were either younger than 40 years old or were without a screening mammogram within the last 2 years. IC interval cancer, SDC screen-detected cancer
The screened group appears to be similar to the age-comparable non-screened group (≥40 years old). Except for race, no statistical differences were found. There were 13% nonwhite in the screened group versus 29% in the non-screened group (P = 0.015). Mean tumor size of the screened group compared with the non-screened group was 6.2 cm versus 7.5 cm (P = 0.32) (Table 2).
Characteristics of ICs versus SDCs
Table 3 shows the demographic and pathologic tumor characteristics for the 67 patients who underwent screening, classified as ICs (57) or SDCs (10). Although the number of SDCs is small, some differences emerged. ICs and SDCs differed in terms of estrogen receptor status (44% of ICs were estrogen receptor negative vs. 0% of SDC) and grade, with ICs of higher grade compared with SDCs (49% vs. 10% grade III, P = 0.04) (Fig. 2). ICs and SDCs did not differ in terms of tumor size, frequency of axillary lymphadenopathy, or percentage of Ki67 staining cells (Table 3). ICs were also not associated with differences in p53, HER2, bcl 2, or EGFR (Data not shown). Subtypes of ICs compared with SDCs are also reported in Table 3. There were no basal types among the SDCs, whereas 36% of ICs were basal type. The screened cases were primarily luminal A (33%) and luminal B (67%).
Occult cancers
We identified 26 cases of mammographically occult cancers among the 219 patients, and these cases were equally distributed over the interval and screened groups (11% vs. 13%). The frequency of ICs ranged from 11 to 16% and does not appear to be higher with younger age as shown in the non-screened cohort (Fig. 2).
ICs: early versus late
Of the 57 ICs, 68% were early ICs (detected < 1 year) and 32% were late ICs (detected within 1–2 years of a normal screening mammogram).
Expected rates of ICs in the I-SPY 1 cohort
The I-SPY TRIAL population is young, with 55% under the age of 50. Using the expected frequency of ICs as reported by the Norrbotten screening program in Sweden [9] and adjusting for age, we would expect a 32.5% interval cancer rate in the I-SPY TRIAL; however, the observed rate is much higher than expected, (57 cases observed vs. 21.7 cases expected, P < 0.001) (Table 4).
Table 4.
Expected versus actual rates of interval cancers in the I-SPY 1 TRIAL
| Age | Expected IC rate by age (Norrbotten rate) (%) | I-SPY age distribution (%) | I-SPY screened cancers (IC + SDC) | Expected IC in I-SPY 1a | Observed IC in I-SPY 1 | Chi-square |
|---|---|---|---|---|---|---|
| 40–49 | 43 | 34 | 23 | 10 | 19 | 8.4 |
| 50–59 | 29 | 53 | 35 | 10 | 32 | 47 |
| 60–69 | 18 | 13 | 9 | 2 | 6 | 11.8 |
| 70–74 | 16 | 0 | 0 | 0 | 0 | 0 |
| Total | 67 | 22 | 57 | 67.3* | ||
| Expected interval cancer rate (22/67) | 32% | |||||
| Observed interval cancer rate (57/67) | 85% |
IC interval cancer, SDC screen-detected cancer
P <0.001
Expected based on Norrbotten age group rates, e.g. 9.9 = 23 × 43%
Discussion
It is often thought that the principle cause for large tumors on initial presentation is neglect, either by the patient or by the physician, who fails to recognize the presence of cancer. However, our findings that 85% of the women undergoing screening in I-SPY 1 had ICs suggest a potential alternative hypothesis that the majority of these large tumors have high proliferation rates and rapidly become clinically evident. The tumors in the I-SPY 1 TRIAL appear to have biologically high-risk characteristics: the median tumor size was 6 cm, a large fraction was hormone receptor negative (45%), and many women were young (median age = 49 years). Of the patients profiled by gene expression microarray, 91% had a poor prognosis by the NKI 70-gene signature [18]. Of these large tumors, 67% presented in the interval between screens during the first year. The majority of these cancers would not have been detected early with annual or biannual screening mammography.
None of the tumors in this study was small or early stage, since the eligibility for I-SPY 1 required that all patients have at least 3 cm tumors or larger. Therefore, tumor size for both ICs and SDCs was high. However, Fig. 3 shows that many of the ICs tumors were substantially larger than SDCs, suggesting a higher growth luminal A or B, whereas the ICs were distributed across the subtypes with one-third being basal. Understanding who will be at risk for basal or triple negative cancers, while not yet possible today, in the future may yield an opportunity to tailor screening if such a population can be identified. Screening for this group may need to be more frequent.
Fig. 3.
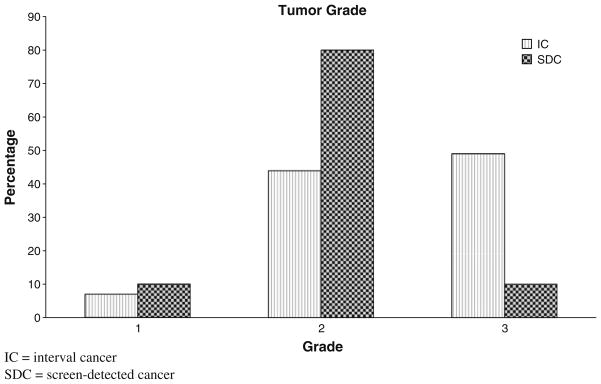
Tumor grade of ICs versus SDCs. At clinical presentation, ICs were more likely to be higher grade: grade 1 (7%), grade 2 (44%), grade 3 (49%). SDCs were grade 1 (10%), grade 2 (80%), and grade 3 (10%). IC interval cancer, SDC screen-detected cancer
Several studies have documented the more aggressive behavior of ICs [8, 10–12, 20, 21]. The rapid growth rate and higher grade of ICs have been attributed to a higher proliferation rate (Ki-67), higher cell cycle dysregulation (p53), and lower apoptotic index (bcl-2) [10, 11]. Similarly, the I-SPY 1 cancers were almost all biologically high risk as determined by the fact that 91% of the I-SPY 1 tumors were poor risk by the NKI 70-gene signature, and most cancers presented as ICs [18].
From the Malmo population-based screening program with a 2-year screening interval for women 45 years and older, the rate of ICs was 17%, with 8% presenting in less than twelve months [5, 8]. In a screened population, expected rates of ICs vary by age. The finding that younger women are most at risk for ICs has been consistent throughout the literature, even when tumor growth rate and disease prognosis have not [22, 23]. In a large, population-based study in Norrbotten, Sweden, the frequency of interval cancers based on age was calculated, demonstrating that ICs were far more frequent in the younger age group (<50 years) [9]. However, in the I-SPY 1 cohort, even after adjusting for age, the actual rate of ICs (85%) for women presenting with a large, rapidly growing tumor far exceeded the expected rate of 32%. This difference appears to be due to differences in the biology of tumors that present as palpable masses compared with screen-detected tumors [8–11, 22, 24, 25].
Our study has several limitations. This was not a population-based study. This was a study specifically for women with larger tumors. Additionally, the screening history was not prospectively collected, although we were careful to review all records, including hospital reports (reviews of films), and clinical reports from all specialists to ascertain whether or not there was a history of screening. The I-SPY 1 TRIAL was conducted at nine institutions, all of which keep very careful records. Furthermore, it is routine for radiologists to date prior films for comparison on all reports, which facilitated ascertainment of patients for the screening group. Only patients with a clearly documented screening history were included in the screened group. Even though a surprisingly high percentage of the I-SPY 1 cohort was non-screened, there was no significant difference from the screened and non-screened groups in terms of patient and tumor characteristics. Therefore, we believe the data are representative of the fraction of ICs in women who present with locally advanced breast cancers. Given this important finding, we have incorporated screening history into all data collection in future I-SPY neoadjuvant trials [26, 27].
Implications from this study suggest that a new enlarging breast mass should be treated with a high degree of suspicion, regardless of a recent normal mammogram, by both the patient and her physician. Tumors presenting at a later stage are more likely to be secondary to aggressive biology than to physician or patient neglect. Many of these tumors are ICs and may be markedly different from SDCs. In the future, efforts should focus on how to identify women at highest risk for ICs so that screening approaches can be modified. An analogy would be BRCA 1 and 2 mutation carriers, who have a high risk for cancers at a young age, and with a more aggressive phenotype. Such women are screened annually with mammography and MRI annually, staggered at 6-month intervals [28, 29].
This study underscores the importance of identifying women at increased risk for ICs, and the need to develop personalized screening prevention and treatment tools. It has long been thought that tumors are present for years prior to presenting as a clinical mass. While that may be true for low-grade tumors, it may be unlikely for high-grade tumors. When women describe rapid appearance and growth of a mass, rather than assuming neglect to bring it to clinical attention, clinicians should be suspicious of the presence of a high-grade ICs. Further research on the mechanisms that trigger such cancers may inform our treatment strategies and ultimately, our approaches to prevention.
Acknowledgments
National Cancer Institute Specialized Program of Research Excellence in Breast Cancer, American College of Radiology Imaging Network, Cancer and Leukemia Group B, National Cancer Institute Center for Bioinformatics, The Breast Cancer Research Foundation, and Bruce and Martha Atwater are acknowledged. Grant numbers: NCI SPORE: CA58207, ACRIN: U01 CA079778 & CA080098, CALGB: CA31964 & CA33601.
Contributor Information
Cheryl Lin, Carol Franc Buck Breast Cancer Center, University of California, San Francisco, 1600 Divisadero Street, 2nd Floor, Box 1710, San Francisco, CA 94115, USA.
Meredith Becker Buxton, Carol Franc Buck Breast Cancer Center, University of California, San Francisco, 1600 Divisadero Street, 2nd Floor, Box 1710, San Francisco, CA 94115, USA.
Dan Moore, Helen Diller Comprehensive Cancer Center, University of California, San Francisco, 475 Brannan Street 220, Box 1793, San Francisco, CA 94143, USA.
Helen Krontiras, UAB Medical Center, The Kirklin Clinic, University of Alabama, Birmingham, 5th Floor, 2000 6th Avenue South, Birmingham, AL, USA.
Lisa Carey, University of North Carolina, Chapel Hill, 170 Manning Drive, 3rd floor, Campus Box 7305, Chapel Hill, NC 27599, USA.
Angela DeMichele, Center for Clinical Epidemiology and Biostatistics, University of Pennsylvania, 14 Penn Tower, 3400 Spruce St., Philadelphia, PA 19104, USA.
Leslie Montgomery, Montefiore Medical Group, Albert Einstein College of Medicine, 1575 Blondell Avenue, Bronx, NY 10461, USA.
Debasish Tripathy, Norris Comprehensive Cancer Center and Hospital, University of Southern California, 1441 Eastlake Ave. #3447, Los Angeles, CA 90033, USA.
Constance Lehman, Seattle Cancer Care Alliance, University of Washington, 825 Eastlake Ave E, G2600, P.O. Box 19023, Seattle, WA 98109, USA.
Minetta Liu, Georgetown University Hospital, 3800 Reservoir Road, NW, Washington, DC 20007, USA.
Olufunmilayo Olapade, Department of Medicine and Human Genetics, University of Chicago, 5841 S. Maryland Avenue, MC-2115, Chicago, IL 60637, USA.
Christina Yau, Carol Franc Buck Breast Cancer Center, University of California, San Francisco, 1600 Divisadero Street, 2nd Floor, Box 1710, San Francisco, CA 94115, USA.
Donald Berry, MD Anderson Cancer Center, University of Texas, 1515 Holcombe Blvd., Box 0447, Houston, TX 77030, USA.
Laura J. Esserman, Email: Laura.Esserman@ucsfmedctr.org, Carol Franc Buck Breast Cancer Center, University of California, San Francisco, 1600 Divisadero Street, 2nd Floor, Box 1710, San Francisco, CA 94115, USA.
References
- 1.Esserman L, Shieh Y, Thompson I. Rethinking screening for breast cancer and prostate cancer. JAMA. 2009;302(15):1685–1692. doi: 10.1001/jama.2009.1498. [DOI] [PubMed] [Google Scholar]
- 2.Elmore JG, Armstrong K, Lehman CD, Fletcher SW. Screening for breast cancer. JAMA. 2005;293(10):1245–1256. doi: 10.1001/jama.293.10.1245. [DOI] [PMC free article] [PubMed] [Google Scholar]
- 3.Nelson HD, Tyne K, Naik A, Bougatsos C, Chan BK, Humphrey L Force USPST. Screening for breast cancer: an update for the U.S. preventive services task force. Ann Intern Med. 2009;151(10):727–737. W237–742. doi: 10.1059/0003-4819-151-10-200911170-00009. [DOI] [PMC free article] [PubMed] [Google Scholar]
- 4.Shapiro S, Venet W, Strax P, Venet L, Roeser R. Ten- to fourteen-year effect of screening on breast cancer mortality. J Natl Cancer Inst. 1982;69(2):349–355. [PubMed] [Google Scholar]
- 5.Andersson I, Aspegren K, Janzon L, Landberg T, Lindholm K, Linell F, Ljungberg O, Ranstam J, Sigfusson B. Mammographic screening and mortality from breast cancer: the Mal-mo mammographic screening trial. BMJ. 1988;297(6654):943–948. doi: 10.1136/bmj.297.6654.943. [DOI] [PMC free article] [PubMed] [Google Scholar]
- 6.Verbeek AL, Hendriks JH, Holland R, Mravunac M, Sturmans F, Day NE. Reduction of breast cancer mortality through mass screening with modern mammography. First results of the Nijmegen project, 1975–1981. Lancet. 1984;1(8388):1222–1224. doi: 10.1016/s0140-6736(84)91703-3. [DOI] [PubMed] [Google Scholar]
- 7.de Waard F, Collette HJ, Rombach JJ, Baandersvan Halewijn EA, Honing C. The DOM project for the early detection of breast cancer, Utrecht, The Netherlands. J Chronic Dis. 1984;37(1):1–44. doi: 10.1016/0021-9681(84)90123-1. [DOI] [PubMed] [Google Scholar]
- 8.Ikeda DM, Andersson I, Wattsgard C, Janzon L, Linell F. Interval carcinomas in the Malmo mammographic screening trial: radiographic appearance and prognostic considerations. AJR Am J Roentgenol. 1992;159(2):287–294. doi: 10.2214/ajr.159.2.1632342. [DOI] [PubMed] [Google Scholar]
- 9.Bordas P, Jonsson H, Nystrom L, Lenner P. Interval cancer incidence and episode sensitivity in the Norrbotten Mammography Screening Programme, Sweden. J Med Screen. 2009;16(1):39–45. doi: 10.1258/jms.2009.008098. [DOI] [PubMed] [Google Scholar]
- 10.Porter PL, El-Bastawissi AY, Mandelson MT, Lin MG, Khalid N, Watney EA, Cousens L, White D, Taplin S, White E. Breast tumor characteristics as predictors of mammographic detection: comparison of interval- and screen-detected cancers. J Natl Cancer Inst. 1999;91(23):2020–2028. doi: 10.1093/jnci/91.23.2020. [DOI] [PubMed] [Google Scholar]
- 11.Gilliland FD, Joste N, Stauber PM, Hunt WC, Rosenberg R, Redlich G, Key CR. Biologic characteristics of interval and screen-detected breast cancers. J Natl Cancer Inst. 2000;92(9):743–749. doi: 10.1093/jnci/92.9.743. [DOI] [PubMed] [Google Scholar]
- 12.DeGroote R, Rush BF, Jr, Milazzo J, Warden MJ, Rocko JM. Interval breast cancer: a more aggressive subset of breast neoplasias. Surgery. 1983;94(4):543–547. [PubMed] [Google Scholar]
- 13.Heuser L, Spratt JS, Jr, Polk HC, Jr, Buchanan J. Relation between mammary cancer growth kinetics and the intervals between screenings. Cancer. 1979;43(3):857–862. doi: 10.1002/1097-0142(197903)43:3<857::aid-cncr2820430312>3.0.co;2-y. [DOI] [PubMed] [Google Scholar]
- 14.Heuser L, Spratt JS, Polk HC., Jr Growth rates of primary breast cancers. Cancer. 1979;43(5):1888–1894. doi: 10.1002/1097-0142(197905)43:5<1888::aid-cncr2820430545>3.0.co;2-m. [DOI] [PubMed] [Google Scholar]
- 15.Perou CM, Sorlie T, Eisen MB, van de Rijn M, Jeffrey SS, Rees CA, Pollack JR, Ross DT, Johnsen H, Akslen LA, et al. Molecular portraits of human breast tumours. Nature. 2000;406(6797):747–752. doi: 10.1038/35021093. [DOI] [PubMed] [Google Scholar]
- 16.Peppercorn J, Perou CM, Carey LA. Molecular subtypes in breast cancer evaluation and management: divide and conquer. Cancer Invest. 2008;26(1):1–10. doi: 10.1080/07357900701784238. [DOI] [PubMed] [Google Scholar]
- 17.Cianfrocca M, Gradishar W. New molecular classifications of breast cancer. CA Cancer J Clin. 2009;59(5):303–313. doi: 10.3322/caac.20029. [DOI] [PubMed] [Google Scholar]
- 18.Esserman L, et al. Poster session: Breast cancer molecular profiles and tumor response of neoadjuvant doxorubicin and paclitaxel: the I-SPY TRIAL (CALGB 150007/150012, ACRIN 6657). ASCO Annual Meeting; Orlando, FL. May 29–31.2009. [Google Scholar]
- 19.Buxton ELMB. The challenge of integrating information and improving care for breast cancer: The I SPY Trial informatics effort. In: Perry MC, editor. American society of clinical oncology. Lisa Greaves; Orlando: 2005. [Google Scholar]
- 20.Klemi PJ, Joensuu H, Toikkanen S, Tuominen J, Rasanen O, Tyrkko J, Parvinen I. Aggressiveness of breast cancers found with and without screening. BMJ. 1992;304(6825):467–469. doi: 10.1136/bmj.304.6825.467. [DOI] [PMC free article] [PubMed] [Google Scholar]
- 21.Schroen AA, Wobbes T, van der Sluis RF. Interval carcinomas of the breast: a group with intermediate outcome. J Surg Oncol. 1996;63(3):141–144. doi: 10.1002/(SICI)1096-9098(199611)63:3<141::AID-JSO2>3.0.CO;2-D. [DOI] [PubMed] [Google Scholar]
- 22.Frisell J, von Rosen A, Wiege M, Nilsson B, Goldman S. Interval cancer and survival in a randomized breast cancer screening trial in Stockholm. Breast Cancer Res Treat. 1992;24(1):11–16. doi: 10.1007/BF01832353. [DOI] [PubMed] [Google Scholar]
- 23.Brekelmans CT, Peeters PH, Deurenberg JJ, Collette HJ. Survival in interval breast cancer in the DOM screening programme. Eur J Cancer. 1995;31A(11):1830–1835. doi: 10.1016/0959-8049(95)00324-c. [DOI] [PubMed] [Google Scholar]
- 24.Cowan WK, Angus B, Gray JC, Lunt LG, al-Tamimi SR. A study of interval breast cancer within the NHS breast screening programme. J Clin Pathol. 2000;53(2):140–146. doi: 10.1136/jcp.53.2.140. [DOI] [PMC free article] [PubMed] [Google Scholar]
- 25.Taylor R, Page A, Bampton D, Estoesta J, Rickard M. Age-specific interval breast cancers in New South Wales and meta-analysis of studies of women aged 40–49 years. J Med Screen. 2004;11(4):199–206. doi: 10.1258/0969141042467403. [DOI] [PubMed] [Google Scholar]
- 26.Barker AD, Sigman CC, Kelloff GJ, Hylton NM, Berry DA, Esserman LJ. I-SPY 2: an adaptive breast cancer trial design in the setting of neoadjuvant chemotherapy. Clin Pharmacol Ther. 2009;86(1):97–100. doi: 10.1038/clpt.2009.68. [DOI] [PubMed] [Google Scholar]
- 27.I-SPY 2 TRIAL. [ www.ispy2.org]
- 28.Granader EJ, Dwamena B, Carlos RC. MRI and mammography surveillance of women at increased risk for breast cancer: recommendations using an evidence-based approach. Acad Radiol. 2008;15(12):1590–1595. doi: 10.1016/j.acra.2008.06.006. [DOI] [PubMed] [Google Scholar]
- 29.Warner E, Plewes DB, Hill KA, Causer PA, Zubovits JT, Jong RA, Cutrara MR, DeBoer G, Yaffe MJ, Messner SJ, et al. Surveillance of BRCA1 and BRCA2 mutation carriers with magnetic resonance imaging, ultrasound, mammography, and clinical breast examination. JAMA. 2004;292(11):1317–1325. doi: 10.1001/jama.292.11.1317. [DOI] [PubMed] [Google Scholar]