

Abstract
Genome-wide association studies (GWAS) identified the MEIS1 locus for Restless Legs Syndrome (RLS), but causal single nucleotide polymorphisms (SNPs) and their functional relevance remain unknown. This locus contains a large number of highly conserved noncoding regions (HCNRs) potentially functioning as cis-regulatory modules. We analyzed these HCNRs for allele-dependent enhancer activity in zebrafish and mice and found that the risk allele of the lead SNP rs12469063 reduces enhancer activity in the Meis1 expression domain of the murine embryonic ganglionic eminences (GE). CREB1 binds this enhancer and rs12469063 affects its binding in vitro. In addition, MEIS1 target genes suggest a role in the specification of neuronal progenitors in the GE, and heterozygous Meis1-deficient mice exhibit hyperactivity, resembling the RLS phenotype. Thus, in vivo and in vitro analysis of a common SNP with small effect size showed allele-dependent function in the prospective basal ganglia representing the first neurodevelopmental region implicated in RLS.
With an age-dependent prevalence of up to 10% in western societies, RLS is a sensorimotor neurological disorder characterized by an urge to move the legs and uncomfortable sensations in the lower limbs. These symptoms occur exclusively during rest, in the evening, or at night, and improve only with movement (Szentkiralyi et al. 2011). Therefore, patients are forced to stand up and walk, sometimes calling themselves “nightwalkers.” Consequences are severe sleep disturbances, depression, anxiety, and increased cardiovascular risk (Winkelman et al. 2008). Severely affected patients require medication, with dopaminergic compounds being the first line treatment, but side effects such as augmentation limit their long-term use (Hornyak et al. 2012). So far, very little is known about the underlying neurobiology of this disorder.
RLS has a heritability of ∼50% and is a complex genetic disorder. GWAS identified common genetic variants within six risk loci (Winkelmann et al. 2007, 2011; Schormair et al. 2008). These convey only small effects on the phenotype; and generally, the molecular mechanism and function behind low-effect-size common genetic variants identified in complex genetic diseases provide a formidable challenge. The strongest RLS association signal identified delineates a 32-kb linkage disequilibrium (LD) block in intron 8 of MEIS1 (2p14). A common haplotype completely tagged by a pair of highly correlated intronic SNPs, rs12469063 and rs2300478 (LD r2 = 0.97), and rs6710341 in this block was shown to confer a significantly increased risk for RLS (odds ratio [OR] of 2.8) (Winkelmann et al. 2007). MEIS1 belongs to the TALE family of homeobox transcription factors and is involved in the development and homeostasis of numerous organs and diseases such as leukemia or neuroblastoma (Azcoitia et al. 2005). In the nervous system, multiple expression domains suggest essential roles for MEIS1 (Toresson et al. 2000); however, its spatial, temporal, and functional involvement in RLS pathogenesis has remained unknown. The MEIS1 locus comprises a cluster of HCNRs, and it has been shown that these indicate potential cis-regulatory elements for genes implicated in transcriptional regulation and development (Woolfe et al. 2005). Since disease-associated variants identified by means of GWAS are more likely located in regulatory DNA (Maurano et al. 2012), we aim to study the causal role of MEIS1 in RLS by analyzing the allele-dependent cis-regulatory function of the common intronic RLS-associated DNA variants of MEIS1 and differential binding of upstream factors as well as RLS-related behavioral consequences of altered Meis1 function.
Results
Identification of common candidate causal variants in the MEIS1 GWAS locus
To capture common variation found in the MEIS1 GWAS locus, we screened the entire intronic 32-kb LD block associated with RLS in 188 RLS patients for variants using high-resolution melting curve analysis (Herrmann et al. 2006). Our discovery sample consisted of carriers of the known risk haplotype in order to enrich candidate causal variants residing on this haplotype. We focused our analysis on common variants with a minor allele frequency (MAF) ≥ 0.05 due to our small sample size limiting the power for rare and low frequency variants. Of 136 variants identified, 54 were common SNPs in our data set (MAF ≥ 0.05) (Supplemental Table S1). To account for sampling bias in our discovery sample, we also included five variants reported as common in the general population (dbSNP Build 130), but with lower frequency in our data set, yielding a total of 59 variants. We genotyped these in independent 735 cases and 735 age-, sex-, and ethnicity-matched population-based controls (KORA cohort) (Wichmann et al. 2005). Based on strong LD, a total of 16 variants were assayed using tagging SNPs. We then imputed missing genotypes in additional samples, leading to a final set of high-quality genotypes of 38 variants for statistical analysis in 1302 cases and 1259 controls. Logistic regression followed by permutation-based adjustment for multiple testing revealed 27 associated SNPs (Pcorr < 0.05) (Supplemental Table S2). The two strongest signals were the known highly correlated rs12469063 (Pnom = 7.7 × 10⁻¹⁸; OR = 1.7) and rs2300478 (Pnom = 4.2 × 10⁻¹⁸; OR = 1.7) (Fig. 1B). Conditional analysis with either rs12469063 or rs2300478 as covariate did not reveal additional independent association signals within the 32-kb block after permutation-based adjustment but confirmed the known risk haplotype configuration rs12469063/rs6710341. This haplotype showed an increased effect size with an OR of 2.33 compared to all other haplotypes with a frequency ≥ 1% in our data set combined (95% confidence interval: 1.85–2.94 with an overall frequency [f] of 0.138 defined by rs6710341 − allele A [f = 0.857] and rs12469063 − allele G [f = 0.282]). Taken together, the common DNA variants rs12469063 and rs2300478 remained the lead SNP pair within the 32-kb block with the increased haplotype risk being compatible with additional small effect contributors not detectable by our approach.
Figure 1.

Association signals, sequence conservation, and epigenetic signatures in embryonic and adult stages of the MEIS1/Meis1 locus (A) RLS-associated locus on 2p14 with the lead SNP rs12469063 (violet diamond) and its genetic environment. (B) The x-axis represents the genomic position, referring to the hg18 genome annotation. The right-hand y-axis represents the recombination rate, and the negative log10 of the nominal P-values of all SNPs genotyped are given on the left-hand y-axis. The color-coded LD between SNPs is based on the lead SNP rs12469063 (violet diamond) as a reference. rs2300478, which lies in a nonconserved region, is depicted with a red circle. Recombination rate and r2 values were estimated with the CEU population from HapMap II (release 22). The LD block below is based on HapMap data, measured in r2 and visualized with Haploview. Highlighting refers to the magnitude of pairwise LD, with a white-to-black shading indicating lower to higher LD values. The lower part of Figure 1B uses mouse genome annotation mm9 and lists from top to bottom: (1) conservation between the mouse genome and the genome of the rat, human, frog, zebrafish, and Fugu; (2) corresponding localization of the human RLS-SNPs rs12469063 (violet diamond) and rs2300478 (red circle); (3) seven analyzed HCNRs in turquoise boxes; (4) the conservation in mammals (dark blue); (5) DNA binding of EP300 (ChIP-seq) in E11.5 forebrain (blue) and midbrain (gray); and (6) DNase I hypersensitivity in whole brain of E14.5 embryos and adult mice (red and orange peaks, respectively).
rs12469063 impairs enhancer activity in zebrafish
Given that cis-regulatory function is often found in HCNRs of developmental genes (Woolfe et al. 2005), we focused on variants found within these elements. Thus, we systematically examined all HCNRs in the associated LD block (Figs. 1, 2) in a zebrafish transgenic EGFP-reporter assay (i.e., 24/48 h post-fertilization [hpf]). Altogether, eight HCNRs showed high conservation in mouse, chicken, and frog, five of which were conserved also in the Fugu genome (HCNR 602, 606, 617, 628, and 629). Since one HCNR did not contain any common variants, we subjected the remaining seven HCNRs to further analysis (HCNR 602, 606, 612, 617, 622, 629, and 631) (Fig. 2). None of the examined HCNRs contained any rare variants. While SNP rs12469063 resided in one of the HCNRs (617), rs2300478 was located in a nonconserved stretch and therefore was not further examined (Fig. 1B).
Figure 2.

In vivo allele-specific enhancer function of HCNR 617 in zebrafish. (A) Results of the zebrafish enhancer screen with the expression domains for the protective and risk allele in orange and purple, respectively. (B) Representative embryos of the F1 generation with the protective ([A] adenine) and the risk allele ([G] = guanine) construct of HCNR 617 showed an allele-specific difference in reporter EGFP expression in the neural tube. The protective allele of HCNR 617 drove EGFP expression in the retina, fore-, mid-, and hindbrain and spinal cord. The risk allele significantly reduced the expression almost to background levels (bar represents 250 µm). (C) Boxplot (left) The risk allele reduced the fluorescence intensity to 70% compared to the protective allele (100%) (Wilcoxon rank sum test, P = 0.08; EGFP-brain signal measured, nprotective = 5, nrisk = 5). The bar chart (right) represents the percentage of all EGFP-positive founders in the respective area (y-axis) with respect to the protective (orange) and risk (purple) allele of HCNR 617. The risk allele leads either to a significant reduction or a complete loss of the EGFP signal.
Of all HCNRs assayed, solely HCNR 617 exhibited both a reproducible neural expression pattern and a genotype-specific expression comparing the protective and risk allele reporter constructs (Fig. 2; Supplemental Fig. S1). With the protective allele, an enhancer signal was detected in the retina, the fore-, mid-, and hindbrain, and the spinal cord. In contrast, zebrafish embryos carrying the risk allele showed highly reduced enhancer activity (Fig. 2B,C). Together, these findings indicate that rs12469063 lies within a region of high interspecies conservation with neural enhancer activity and has an allele-specific functional impact.
rs12469063 alters enhancer activity in the murine embryonic ganglionic eminences
Next, HCNR 617 was analyzed in a transgenic mouse beta-galactosidase (lacZ) enhancer assay (Pennacchio et al. 2006). We found a reproducible lacZ gene expression pattern for both alleles in the forebrain of all embryos (E12.5) within the ganglionic eminences (Fig. 3A,D; Supplemental Fig. S2), giving rise to the basal ganglia of the adult brain, in addition to parts of the amygdala and several interneuron populations (Medina and Abellán 2012). Notably, lacZ reporter activity matched the endogenous Meis1 telencephalic expression domain (Fig. 3D). In addition, transcripts of all further RLS-associated loci, Btbd9, Ptprd, Map2k5, and Tox3 (Winkelmann et al. 2011) were expressed in this telencephalic area (Fig. 3E). Given the allele-specific impaired EGFP expression in zebrafish, we looked for allele-specific differences of lacZ activity, relying on the assumption that both constructs have the same bias for copy number as suggested by the small variance of both groups. Transgenic embryos of Theiler stages 19 and 20 (Theiler 1989) were included in the evaluation of beta-galactosidase signal intensity and spatial expression measured according to Cavalieri (n = 4 for both the protective and risk allele) (Fig. 3A,B; Supplemental Figs. S2, S3). For risk allele carriers, analyses showed a significant reduction of 65% in signal intensity (P = 0.029) and of 76% in the stereological analysis (P = 0.029) (Fig. 3A,B).
Figure 3.

In vivo and in vitro identification of allele-specific HCNR 617 enhancer function in the ganglionic eminences of the mouse. (A) Representative transgenic mouse embryos after pronucleus injection of HCNR 617 protective (left) and risk allele constructs (right) at stage E12.5. Blue color indicates regions expressing the reporter gene beta-galactosidase (lacZ). Arrowhead indicates the reproducible telencephalic signal (bar represents 2.5 mm). (B) Analysis of the signal intensity in Theiler-staged embryos (stages 19 and 20; nprotective = 4, nrisk = 4) showed a reduction down to 35% (Wilcoxon rank sum test, P = 0.029). Stereological volume estimation according to Cavalieri revealed a significant volume reduction down to 24% for the risk allele (Wilcoxon rank sum test, P = 0.029). (C) Electrophoretic mobility shift assay using oligonucleotides encompassing rs12469063 showed allele-specific differences of DNA-protein complex formation using E12.5 forebrain nuclear extract (lanes 3 and 4, arrow and arrowhead). Specificity is proven by competition with unlabeled risk and protective oligonucleotide in excess (lanes 6–18). CTRL, control (no protein). (D) Frontal sections through the forebrain reveal lacZ reporter activity in the mantle zone (mz) of the ganglionic eminences, in the same region as Meis1 transcript and MEIS1 protein (arrowheads; bar represents 500 µm); no transcripts are visible in the ventricular (vz) and subventricular (svz) zones. (E) Transcripts of all additional GWAS-RLS risk loci map to the embryonic ganglionic eminences. mRNA of Ptprd, Btbd9, and Map2k5 was detected in the mantle zone (mz) of the LGE and MGE. Tox3 was expressed in the adjacent ventricular (vz) and subventricular (svz) zone (arrowheads; bar represents 500 µm).
Direct evidence for an allele-specific function of rs12469063 was further provided by electrophoretic mobility shift assays (EMSA). Incubation with nuclear protein extracts from forebrain of E12.5 mice showed differential allele-specific gel shifts (Fig. 3C). The gel shifts were specific, as competition with the unlabeled allele in excess attenuated the differential bands. Combined with the results of the transgenic animal models, where the risk allele reduces enhancer function, this implies an enhanced binding of an activator protein complex to the protective allele or a repressor protein complex to the risk allele. The lead SNP rs12469063 was the only DNA sequence variation between the two oligonucleotides examined with EMSA, and thus held responsible for the differential DNA–protein complex formation (Fig. 3C).
Since binding of the enhancer-associated epigenomic marker EP300 allows the prediction of tissue-specific enhancer activity (Visel et al. 2009), we assessed the 32-kb LD block for EP300 binding in ChIP-seq data of murine brain (E11.5). The only EP300 peak corresponding to HCNR 617 was detected in forebrain tissue (Fig. 1B). Next, we analyzed whether HCNR 617 is also an active enhancer during adulthood by using DNase I hypersensitivity maps, indicating active regulatory regions (Sabo et al. 2006). This analysis further supported the active status of HCNR 617 during development (E14.5), whereas in adult brain tissue (8 wk), no activity of HCNR 617 could be identified (Fig. 1B). Together, these observations underline the spatiotemporal enhancer specificity of HCNR 617 and strongly suggest MEIS1 regulation in RLS during development rather than in adult tissue homeostasis.
rs12469063 affects a cAMP response element-binding protein/CREB1 transcription factor binding site
To identify upstream transcription factors binding the sequence motif altered by rs12469063, we carried out affinity chromatography using allele-specific DNA oligonucleotides and nuclear protein extracted from E12.5 mouse embryonic telencephalon. Nuclear proteins bound to the affinity matrix were identified by mass spectrometry, and protein levels were quantified allowing calculation of a ratio reflecting binding preference (Fig. 4A). A total of 51 identified proteins demonstrated allele-specific differential binding (mean fold change ≥ 1.5) (Supplemental Table S3), with 33 showing consistent results across three independent experiments. Among these, CREB1 was the protein with the highest fold change, also known to bind DNA in a sequence-specific manner and of functional relevance in the CNS. We observed a strong similarity of the genomic sequence spanning rs12469063 and the consensus CREB binding site (Fig. 4B) and found Creb1/CREB1 to colocalize with Meis1/MEIS1 in the mantle zone of the ganglionic eminences at both transcript and protein levels (Fig. 4C,D). Moreover, rs12469063 influenced the predicted CREB1 transcription factor interaction based on in silico analysis (Genomatix, SNPInspector). Furthermore, supershift experiments with a CREB-specific antibody attenuated the gel shift (Fig. 4E). As the supershifted band showed a higher intensity signal for the risk allele, and mass spectrometry results showed that CREB1 binds 3.2-fold higher to the risk allele (Supplemental Table S3), we suggest that CREB1 binds more strongly to the risk allele. Finally, disruption of the entire predicted CREB1 binding site resulted in the loss of the specific gel shift (Fig. 4E). Combined, these data sets identified CREB1 as an upstream factor differentially binding rs12469063.
Figure 4.

rs12469063 alters a CREB1 transcription factor binding site. (A) Principle work flow for the identification of upstream binding factors by affinity chromatography and mass spectrometry. (B) CREB consensus sequence compared to the human sequence spanning rs12469063. (C,D) Creb/CREB and Meis1/MEIS1 were both detected in the mantle zone of the ganglionic eminences and show colocalization (bar in C represents 500 µm; bar in D represents 250 µm). (D) Magnification of rectangle in C. (E) Supershift EMSA assay with a specific antibody against CREB showed significant reduction of DNA-protein complex formation compared to unspecific IgG antibody (control) for overexpressed CREB1 in 293T nuclear cell lysate (lanes 1–6) and E12.5 forebrain nuclear extract (lanes 7–12, arrowhead). Complete abolishment of specific binding with an oligonucleotide, in which the entire CREB motif is deleted (lane 13). CREB consensus oligonucleotide shows specific binding, being absent with the mutated CREB consensus oligonucleotide (lanes 14,15). Arrow indicates additional allele-specific band.
MEIS1 downstream target genes in the E12.5 ganglionic eminences
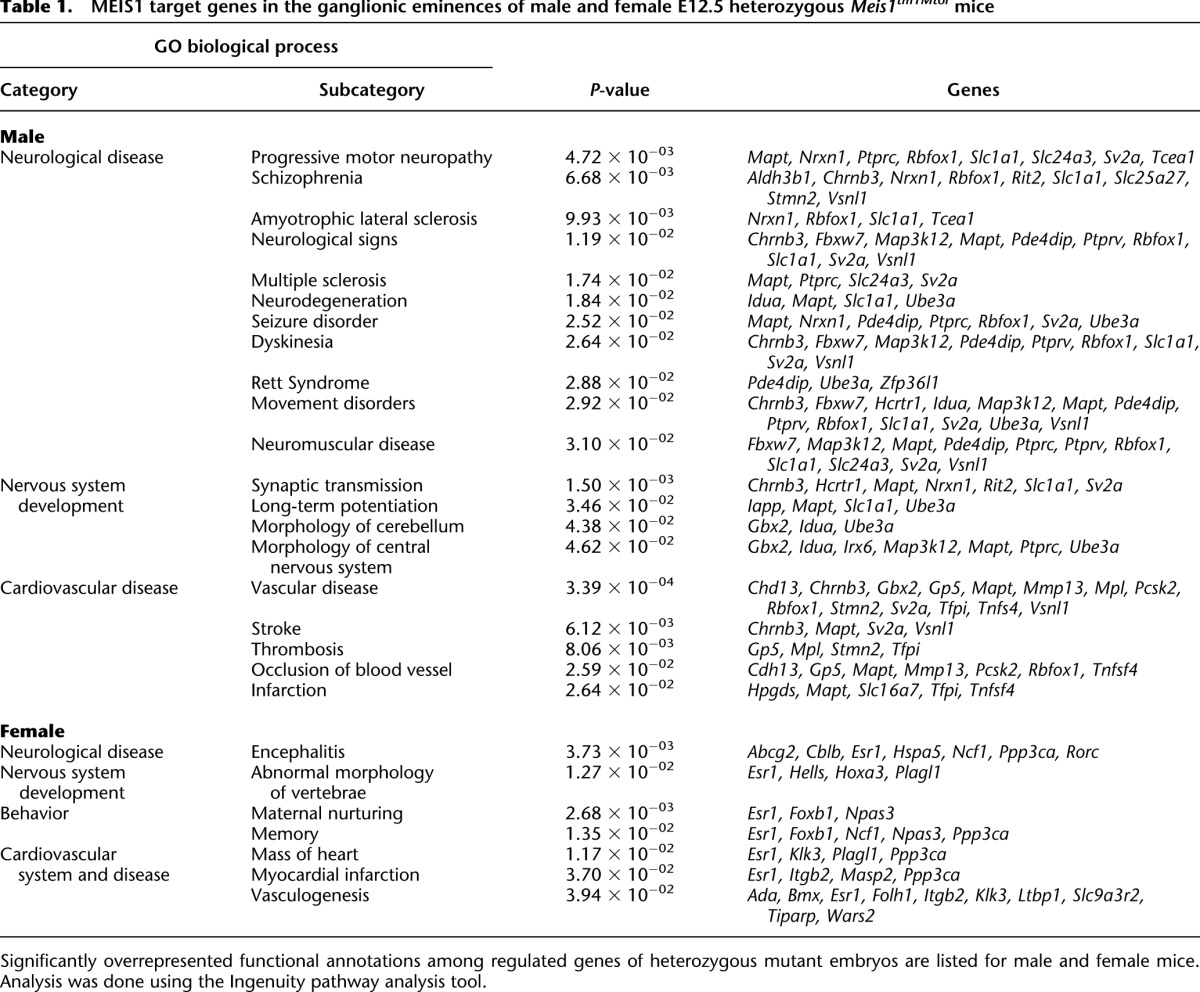
To model the reduced expression of MEIS1 in RLS, we chose mice heterozygous for the Meis1tm1Mtor allele. These mice express only one functional allele of Meis1 and should thus recapitulate reduced MEIS1 expression in RLS patients. Whereas homozygous Meis1tm1Mtor mice are embryonic lethal by E14.5, heterozygous Meis1tm1Mtor mice are viable and fertile (Azcoitia et al. 2005). To identify genes that are directly or indirectly regulated due to reduced Meis1 expression in the LGE/MGE, we performed whole genome transcriptomics of forebrains from wild-type and heterozygous Meis1tm1Mtor embryos (E12.5) (Fig. 5). Based on significance analysis of microarrays (SAM), we found 126 significantly regulated genes in male and 161 in female embryos (mean fold change > 1.5; false discovery rate [FDR] < 10%). Hierarchical cluster analysis of genes differentially regulated (unpaired two class analysis [SAM] of 285 genes; FDR < 7.9%; fold change > 1.5) revealed that the expression profiles clearly cluster according to the respective sex (Fig. 5; Supplemental Table S4). Using pathway analysis software (Ingenuity), we identified significantly overrepresented functional annotations in male and female embryos. Despite the differences, we found that in both sexes the functional categories “neurological disease” and “nervous system development” were among the most significant overrepresented biological processes (Table 1). In addition, the occurrence of the “cardiovascular disease” category was in agreement with the reported function of Meis1 during vasculogenesis (Azcoitia et al. 2005). Of note, no transcripts of the currently known RLS-associated risk loci, Btbd9, Ptprd, Map2k5, and Tox3, were regulated, although transcripts belonging to homologous genes, such as Ptprv, Ptprc, and Map3k12, were differentially expressed. Interestingly, the homeobox gene Gbx2, which is essential for the proper development of cholinergic interneurons in the striatum (Chen et al. 2010), was found to be down-regulated (Table 1; Supplemental Table S4). Altogether, these data correlate with known MEIS1 function regulating transcription of developmental genes rather than housekeeping genes (Penkov et al. 2013).
Figure 5.

MEIS1 transcriptional target genes in the E12.5 ganglionic eminences. Summarized heat map from unpaired two class analysis (SAM) of genes regulated between heterozygous Meis1tm1Mtor and wild-type forebrain tissues at E12.5. Expression profiles of male and female embryos clearly separate. Similar gene profiles are grouped together (rows) and color code gives the mean fold changes of the respective genes for each mutant embryo. Yellow represents up-regulation and blue represents down-regulation in comparison to the respective wild-type control group. The number of genes that are included in each group (A–G) with similar patterns is given. Individual genes are listed in Supplemental Table S4.
Table 1.
MEIS1 target genes in the ganglionic eminences of male and female E12.5 heterozygous Meis1tm1Mtor mice
Motor restlessness/hyperactivity in heterozygous Meis1tm1Mtor mice
Given the reduced reporter gene activity in the endogenous Meis1 telencephalic expression domain, we also aimed to model the functional effect of reduced Meis1 expression on behavior and analyzed adult heterozygous Meis1tm1Mtor mice (Azcoitia et al. 2005). In the open field test measured over 20 min, we found a significantly increased total distance traveled and average speed of forward locomotion in heterozygous compared to wild-type mice (P = 0.003 and P = 0.004) (Fig. 6A,B). No changes were observed with respect to anxiety-related behavior (Supplemental Fig. S4). Moreover, we found a consistent trend of elevated average distance traveled measured over a period of 21 h (up to 16.3%, P = 0.06) (Fig. 6D) with corresponding enhanced energy metabolism in the mutants measured by indirect calorimetry (Fig. 6C; Supplemental Table S5). The oxygen consumption adjusted to the body mass differences was significantly increased in the mutants (adjusted mean VO2: males plus 8.5%, females plus 5.5%, Pgenotype = 0.007; adjusted minimum VO2: males plus 7.8%, females plus 4.3%, Pgenotype = 0.04; adjusted maximum VO2: males plus 6.5%, females plus 10.7%, Pgenotype = 0.003) (Fig. 6C). Taken together, we consider these findings as an in vivo demonstration that reduced expression of Meis1 is leading to an alteration of the behavior toward hyperactive locomotion.
Figure 6.

Motor restlessness/hyperactivity in adult heterozygous Meis1tm1Mtor mice. Heterozygous Meis1tm1Mtor (het) traveled a higher total distance (P = 0.003, two-tailed t-tests, n = 29) (A) and moved with a higher speed on average (P = 0.004, two-tailed t-tests, n = 30) (B) in a 20-min open field test for spontaneous locomotor activity in a novel environment. (C) Oxygen consumption (mL/h) plotted versus body mass (g). Scatterplot with regression lines split by sex and genotype to adjust for body mass variation. The shift in regression lines indicates higher energy turnover in heterozygous Meis1tm1Mtor mice (linear regression model, P = 0.0005). (D) Mean distance traveled (cm/20 min) monitored by infrared light beams during the indirect calorimetry trial. Heterozygous Meis1tm1Mtor mice tended to show increased locomotor activity under home cage conditions (two-way ANOVA, P = 0.06).
Discussion
In the present study, we demonstrated the allele-specific impairment of an intronic cis-regulatory element by the common, RLS-associated SNP rs12469063 in two independent in vivo experimental systems. In mice, the risk allele led to a significant reduction of the enhancer activity in the LGE and MGE, suggesting this brain area as RLS-relevant. We concentrated on genetic variation in highly conserved noncoding regions assuming subsequent alteration in gene expression contributing to complex disease (Maurano et al. 2012). Noncoding sequence conservation has been shown to be capable of identifying human cis-regulatory elements (Prabhakar et al. 2006). Therefore, we might have missed functional effects of SNPs mediated through other mechanisms such as microRNA regulation, coding SNPs as well as noncoding regulatory elements lacking conservation.
Meis1 expression corresponding to the region of lacZ reporter activity strongly points to Meis1 being regulated by the identified enhancer. Moreover, a bioinformatic approach for delineating enhancer–gene interactions (“PreSTIGE”) (Corradin et al. 2014) and Poll II ChIA-PET and Hi-C experiments in two human cell lines (MCF7 and IMR-90) (Dixon et al. 2012; Li et al. 2012) demonstrated an exclusive interaction of the RLS-associated intronic region with the regulatory landscape of MEIS1 (Supplemental Table S6; Supplemental Fig. S5; Supplemental Methods).
The LGE/MGE give rise to the prospective basal ganglia, i.e., pallidum and striatum with several projection neuron and interneuron populations, selected parts of the amygdala, cortical, and olfactory interneurons (Medina and Abellán 2012). Concerning RLS, numerous neuroanatomical regions have been suggested to be involved (Dauvilliers and Winkelmann 2013). The functional relevance of the RLS-SNP rs12469063 in the LGE/MGE suggests that RLS can be regarded as a “basal ganglia disorder,” although further neural structures and pathways might be involved.
The activity of the enhancer during development, indicated by the loss of DNase I hypersensitivity signal in HCNR 617 in adult brain, argues for a role restricted to embryonic development. Our data emphasizes a new focus for RLS research and suggests that the pathophysiology of RLS includes aspects of a neurodevelopmental disorder. As aging is the strongest risk factor for RLS, it is possible that early neurodevelopmental alterations in the LGE/MGE might not be compensated later in life (Somel et al. 2010). The reduced Meis1 expression might lead to altered neuronal pathway formation, including either striatal projections or interneurons, as suggested by down-regulation of Gbx2 in heterozygous Meis1tm1Mtor mice. Gbx2 is required for the development of cholinergic interneurons in the striatum (Chen et al. 2010). Transcriptome profiling identified further MEIS1 downstream targets involved in specification of progenitor cells in the ganglionic eminences (Tucker et al. 2008), as well as protein tyrosine phosphatases (Ptprv, Ptprc), which might have redundant functions next to the RLS-associated PTPRD on 9p23–24 (Schormair et al. 2008).
By affinity chromatography and mass spectrometry, we identified the transcription factor CREB1 as a potential upstream factor, binding stronger to the risk allele of rs12469063 in in vitro assays. Since sensitivity of mass spectrometry-based detection of differentially binding proteins is limited due to low protein abundances, it is possible that our analysis did not cover all differential binding proteins. Along this line, an additional specific gel shift in the EMSA (Fig. 5E) provides evidence for a further protein complex with increased binding to the protective allele. CREB1 either activates or inactivates the transcription of downstream target genes (Bartsch et al. 1998). Here, we observed an enrichment of CREB1 binding and a reduction of the enhancer’s activity for the risk allele, implying a function of CREB1 as a transcriptional repressor affecting rs12469063.
Based on the zebrafish reporter screen, EP300 ChIP-seq, DNase I hypersensitivity data, and the association study, we focused on HCNR 617. Both animal models showed allele-dependent altered enhancer function, but the domain in the teleost central nervous system covered additional caudal structures such as the spinal cord. It has been shown that orthologous sequences with a high evolutionary distance do not necessarily retain the same activity in their respective species (Schmidt et al. 2010). Besides HCNR 617, additional cis-regulatory elements might be involved in the regulation of MEIS1 in relation to RLS. Thus, our HCNR zebrafish screen identified two additional transcriptionally active enhancers (HCNR 629 and 631) showing neural allele-dependent, but spatially not reproducible reporter activity, previously referred to as booster activity (Fig. 2; Supplemental Fig. S1; Royo et al. 2012), as well as one HCNR with general, yet allele-independent booster activity (HCNR 602). Moreover, the DNase I hypersensitivity data provided evidence for potential cis-regulatory activity of further HCNRs (HCNR 602, 606, and 622), two of which comprise RLS-associated variants (HCNR 602 and 622). It has been shown that genetic variants in strong LD map to clusters of enhancers, which cooperatively affect gene expression and thus confer concerted susceptibility to disease (Corradin et al. 2014). Given our results, such modular organization with multiple enhancers next to the identified enhancer HCNR 617 might play a role in the pathophysiology of RLS. This concept is in line with the identified higher-risk haplotype for RLS, defined by rs12469063 and rs6710341. For all associated common SNPs in all seven HCNRs, this haplotype carries the respective risk alleles, suggesting a possible functional role of these variants next to rs12469063 within the MEIS1 locus.
Setting the focus of our study on common variants within HCNRs increased its power but also entailed some limitations. We focused strictly on the 32-kb block of strong LD identified in the initial RLS GWAS (Winkelmann et al. 2007), which is embedded in a larger 64-kb block of weaker LD, and consequently have not considered variants in long-distance LD with the lead SNPs. In addition, rare and low-frequency variants as well as other types of genetic variation have not been analyzed. However, our functional zebrafish screen clearly identified HCNR 617 containing the RLS-associated SNP rs12469063 as the only allele-dependent enhancer, highlighting its functional importance in RLS.
Behavioral consequences of reduced Meis1 expression showed hyperactivity and increased energy expenditure in mutant mice. Assessing however, a murine phenotype for alterations of a behavioral pattern is challenging. Here, the observed behavior of mutant mice correlates well with the human phenotype hallmarked by an enhanced activity and motor restlessness. We cannot exclude that additional factors modify the observed phenotype as MEIS1 is a pleiotropic protein and also expressed in other movement-related CNS regions. Yet, our findings support a loss-of-function model as a disease mechanism. This is in line with loss-of-function models in mouse and Drosophila for the RLS-associated locus BTBD9, also demonstrating hyperactive behavior (DeAndrade et al. 2012; Freeman et al. 2012).
Recently, thousands of common variants have been identified for common traits causing a big debate about the underlying biology of common genetic variants conveying only small effect sizes. The greatest challenge in the “post-GWAS” era is to understand the functional consequences of these loci. Here, we showed a SNP-dependent enhancer impairment, suggesting RLS-relevant differences in the regulation of downstream target genes in the embryonic ganglionic eminences, the prospective basal ganglia. This supports the concept of RLS having elements of a neurodevelopmental disorder. Now, for the first time, we are getting closer to a better understanding of the neuronal pathways involved in RLS, enabling us to explore new drugs and treatment strategies in the future.
Methods
Mutational screening, SNP discovery panel
One hundred eighty-eight unrelated RLS-affected individuals (72.8% female, mean age 60.0 ± 11.2 yr) were screened for variants; 94 patients were homozygote for the risk allele of rs12469063 (G/G), and 94 patients were heterozygote (G/A). We used high-resolution melting curve analysis with LightScanner (IDAHO Technology, Inc.). The targeted region was the 32-kb LD block (hg18; chr2: 66,601,989–66,635,212) as defined by the fine-mapping of the original GWAS signal using tagging-SNPs of the MEIS1 gene and ± 10 kb 5′ and 3′ of sequence in 903 cases and 891 controls of European ancestry (Winkelmann et al. 2007). Oligonucleotide sequences for 145 amplicons are available in Supplemental Table S7. DNA was analyzed in doublets to prevent false-positive signals. Samples with aberrant melting patterns were Sanger sequenced.
Association study: case/control population, imputation, and statistical analysis
Genotyping was performed in 735 unrelated RLS-affected individuals (70.8% female, mean age 61.5 ± 14.2 yr) from Germany, and 735 age-, sex-, and ethnicity-matched population-based controls of the KORA cohort (74.5% female, mean age 59.8 ± 11.3 yr) using the MassARRAY system and Sequenom iPLEX Gold technology (Sequenom, Inc.). Oligonucleotide sequences are available in Supplemental Table S8. A total of 59 variants were selected for genotyping (Supplemental Table S1; Supplemental Methods).
SNPs were imputed in a larger RLS case/control (1302/1259) set using MACH 1.0 (http://www.sph.umich.edu/csg/abecasis/MACH/index.html) and standard settings. Post-imputation quality control exclusion criterion was an Rsq score < 0.3. Statistical analysis was performed as logistic regression with disease status as the dependent and allele dosage as the independent variable using gender as a covariate. All calculations were done using R 3.0.1. For the conditional analysis, either rs2300478 or rs12469063 together with rs6710341 was entered as an additional covariate. Westfall-Young minimal-P method was used to correct for multiple testing with n = 10,000 permutations, and the significance level was set at 0.05 (Westfall and Young 1993). The plot for Figure 1 was generated using the UCSC Genome Browser (http://genome.ucsc.edu/), LocusZoom v1.1 (Pruim et al. 2010), and Haploview 4.2 based on HapMap data (CEU) (The International HapMap Consortium 2003). Haplotype analysis was performed in the genotyped data set only, using both Haploview 4.2 (Barrett et al. 2005) (http://www.broadinstitute.org/scientific-community/science/programs/medical-and-population-genetics/haploview/haploview) and UNPHASED 3.1.7 (Dudbridge 2008) (https://sites.google.com/site/fdudbridge/software/unphased-3-1). Haploview 4.2 using the method by Gabriel et al. (2002) showed that there was one risk haplotype significantly enriched (or depleted) (assessed at a 5% level after 20,000 permutations) in these cases. This haplotype was perfectly tagged by rs2300478/ rs12469063 and rs6710341. For statistical testing and estimation of ORs, we used UNPHASED 3.1.7 including gender as a covariate.
Genomatix software
MatInspector and SNPInspector software (Cartharius et al. 2005) were employed to predict putative transcription factor binding sites and to analyze in silico SNP dependent differences, respectively. GeneRanker software (Berriz et al. 2003) was used for characterization of large sets of genes using annotation data from various sources, such as Gene Ontology or Genomatix proprietary annotation.
EP300 ChIP-seq and DNase I hypersensitivity profile
EP300 ChIP-seq data for forebrain of E11.5 murine embryos was mapped to all HCNRs of the LD block examined (Visel et al. 2009). We used the ENCODE/University of Washington “UW DNase I HS track,” available online in the UCSC Genome Browser (http://genome.ucsc.edu/) (Sabo et al. 2006).
HCNR selection and cloning of HCNR reporter vectors
For determination of HCNRs, we used the VISTA Genome Browser v2.0 (http://pipeline.lbl.gov/cgi-bin/gateway2) (Dubchak et al. 2000). HCNR selection settings are given in the Supplemental Methods. HCNRs were amplified from human DNA. For each HCNR, two constructs with the protective and risk alleles of the associated SNPs were cloned. For common SNPs located in HCNRs, but not genotyped successfully, the respective construct included either the allele enriched in the discovery sample (rs113851554, allele T) or the allele correlated with the risk allele of a tagging SNP (rs11897119, allele T) as risk allele. All vectors were Sanger sequenced and did not include any additional rare variants. Primer sequences and vectors are detailed in the Supplemental Methods.
Generation and analysis of transgenic animals
In zebrafish, microinjections and screening was performed as previously reported (Royo et al. 2011). Transgenic mouse lines (C57BL/6, Harlan) were generated by pronucleus injection of linearized vectors. Primer sequences used for genotyping are detailed in the Supplemental Methods. Intensity of beta-galactosidase staining was measured using ImageJ software (http://rsbweb.nih.gov/ij/index.html) on pictures of entire embryos (nprotective = 4; nrisk = 4). High-precision design-based stereology was used to quantify the volume of the stained area of the ganglionic eminences (nprotective = 4; nrisk = 4). Volume was determined on 8-µm sections on a stereology workstation (Stereo Investigator, MicroBrightField). On every fourth section, the area of interest was counted using the Cavalieri estimator probe (scan grid size = 20 µm; height of the unbiased virtual counting spaces = 12 µm).
Histological methods
Embryos were immersion-fixed in 4% paraformaldehyde/PBS. Radioactive in situ hybridization was performed on 8-µm paraffin sections as previously described (Giesert et al. 2013). Immunohistochemistry on paraffin sections was performed according to standard procedures. Templates for in vitro transcription of riboprobes and antibodies used are detailed in the Supplemental Methods.
Electrophoretic mobility shift assay (EMSA) and overexpression of CREB1 in 293T cells
For EMSA experiments, forebrain nuclear extracts of E12.5 mouse embryos and CREB1 protein overexpressed in 293T cells were used. Experimental details and 5′-Cy5-labeled oligonucleotides are given in the Supplemental Methods.
Affinity chromatography and mass spectrometry
Nuclear protein extracts from forebrain of E12.5 mouse embryos were incubated with double-stranded biotinylated oligonucleotide probes. The sequence of the double-stranded biotin-labeled oligomers used was the same as in EMSA, replacing Cy5 with biotin labeling. Proteins were eluted with an ascending salt concentration (200–1250 mM NaCl). The affinity chromatography was performed three times, and the differential elution fractions were analyzed with mass spectrometry. Proteins were proteolysed with trypsin, and LC-MS/MS analysis was performed with an HPLC system (Ultimate3000, Dionex), directly coupled to an LTQ Orbitrap XL (ThermoFisher Scientific) as described previously (Merl et al. 2012). For quantitative analyses, spectra were loaded into the Progenesis LC-MS software (version 4.0, Nonlinear) and analyzed as previously described (Hauck et al. 2010). Peptide identifications were performed using Mascot (Matrix Science, version 2.3) and the Ensembl mouse database (Release 62; 54,576 sequences) with one missed cleavage allowed, a parent ion tolerance of 10 parts per million (ppm), and a fragment ion mass tolerance of 0.6 Da. Carbamidomethylation was set as fixed; methionine oxidation, and asparagine or glutamine deamidations were allowed as variable modifications. A Mascot-integrated decoy database search calculated an average peptide FDR of < 2%. Peptide assignments were reimported into Progenesis LC-MS. Normalized abundances of all unique peptides were summed up and allocated to the respective protein, comparing the protective (NR) with the risk (R) condition.
RNA isolation and transcriptome analysis
Total mRNA was extracted from forebrains of E12.5 mouse embryos (wild-type and Meis1tm1Mtor/- mice), and transcriptomes were analyzed using MouseRef-8v2 Expression BeadChips (Illumina). Details of statistical, cluster, and pathway analyses are given in the Supplemental Methods.
Behavioral and metabolic phenotyping of Meis1tm1Mtor/- mice
Previously described Meis1tm1Mtor mice were phenotyped at the German Mouse Clinic (Azcoitia et al. 2005; Gailus-Durner et al. 2009). Experimental settings of reported findings are detailed in the Supplemental Methods.
Ethics
The KORA study was reviewed and approved by the local ethical committee (Bayerische Landesärztekammer). All animal work was performed in accordance with the German Animal Welfare Act and the Spanish Ethical Committee for Animal Research from Consejo Superior de Investigaciones (CSIC). Approval for the generation of the transgenic mice was obtained from the Landesdirektion Dresden (Az. 24-9168.11-9/2005-1).
Data access
The complete cRNA array data set from this study has been submitted to the NCBI Gene Omnibus (GEO; http://www.ncbi.nlm.nih.gov/geo/) under accession number GSE44592. All novel variants have been submitted to NCBI dbSNP (https://www.ncbi.nlm.nih.gov/SNP/). Their ss-numbers are given in Supplemental Table S1.
Acknowledgments
We thank Len A. Pennacchio for the Hsp68-lacZ-plasmid and Irmgard Zaus, Jelena Golic, Silvia Naranjo, Rocio Morales, Xabier Ruiz, Bettina Sperling, Jan Einicke, Ann-Elisabeth Schwarz, Anke Bettenbrock, and the TCF Dresden team for technical assistance. The project was supported by Fritz-Thyssen-Stiftung, Cologne, Germany (10.09.2.146; 10.12.2.183), KKF-TUM (8766156), DAAD (0811963), and COST (“HOX and TALE homeoproteins in Development and Disease”). B.S. was partially supported by DFG grants (WI 1820/4-1; WI 1820/5-1) and a TUM-Excellence stipend. The KORA study was financed by the Helmholtz Zentrum München, which is funded by the German Federal Ministry of Education and Research (BMBF) and by the State of Bavaria. KORA research was supported within the Munich Center of Health Sciences (MC Health), Ludwig-Maximilians-Universität, as part of LMUinnovativ. J.L.G.-S. and F.C. acknowledge funding of the Spanish and the Andalusian Governments and the Feder program for grants (BFU2010-14839, BFU2009-07044, CSD2007-00008, and Proyectos de Excelencia CVI-3488 and CVI 2658). This work was funded in part by a grant from the German Federal Ministry of Education and Research (BMBF) to the German Center for Diabetes Research (DZD), to the German Mouse Clinic (Infrafrontier: 01KX1012), to the German Center for Neurodegenerative Diseases (DZNE), Germany; by the Initiative and Networking Fund of the Helmholtz Association in the framework of the Helmholtz Alliance for Mental Research in an Ageing Society (HA-215); and the Munich Cluster for Systems Neurology (EXC 1010 SyNergy) and its Collaborative Research Center (CRC) 870/2 “Assembly and Function of Neuronal Circuits.”
Author contributions: D.S. and J.W. conceived and designed the study. Wet-lab experiments were performed by D.S., M. Kaffe, F.K., J. Bessa, J.J.T., F.G., H. Lee, and M.C., and supervised by T.M., H. Laumen, W.W., F.C., J.L.G.-S., and J.W. Mutation screen and sequencing was performed by F.K. and supervised by P.L. and J.W. SNP data was imputed by B.M.-M., and B.M.-M., B.S., D.C., and N.K. performed the statistical analysis. D.S. performed the ChIP-seq and DNase I hypersensitivity data analysis. F.K. performed the stereological volume estimation. M. Kaffe, C.v.T., and S.M. Hauck conceived, designed, and performed the mass spectrometry experiments; C.v.T. and S.M. Hauck analyzed and quantified the mass spectrometry data. R.N. performed the pronucleus injections. E.T. performed the PreSTIGE analysis. M.T. generated the Meis1-deficient mice. L.G., J.R., M. Klingenspor, and S.M. Hölter conceived, designed, and performed the phenotyping experiments; and J.R., L.G., and S.M. Hölter analyzed and interpreted the phenotyping data. The study design of the GMC (German Mouse Clinic) was conceived by V.G.-D., H.F., and M.H.A. KORA cohort design was conceived by C.G.; M.W. provided the population-based controls. Transcriptome data was obtained by M.H. and analyzed by M.H. and J. Beckers. The manuscript was written by D.S., M. Kaffe, F.K., B.S., and J.W. All authors took part in the revision of the manuscript and approved the final version.
Footnotes
[Supplemental material is available for this article.]
Article published online before print. Article, supplemental material, and publication date are at http://www.genome.org/cgi/doi/10.1101/gr.166751.113.
Freely available online through the Genome Research Open Access option.
References
- Azcoitia V, Aracil M, Martinez AC, Torres M 2005. The homeodomain protein Meis1 is essential for definitive hematopoiesis and vascular patterning in the mouse embryo. Dev Biol 280: 307–320 [DOI] [PubMed] [Google Scholar]
- Barrett JC, Fry B, Maller J, Daly MJ 2005. Haploview: analysis and visualization of LD and haplotype maps. Bioinformatics 21: 263–265 [DOI] [PubMed] [Google Scholar]
- Bartsch D, Casadio A, Karl KA, Serodio P, Kandel ER 1998. CREB1 encodes a nuclear activator, a repressor, and a cytoplasmic modulator that form a regulatory unit critical for long-term facilitation. Cell 95: 211–223 [DOI] [PubMed] [Google Scholar]
- Berriz GF, King OD, Bryant B, Sander C, Roth FP 2003. Characterizing gene sets with FuncAssociate. Bioinformatics 19: 2502–2504 [DOI] [PubMed] [Google Scholar]
- Cartharius K, Frech K, Grote K, Klocke B, Haltmeier M, Klingenhoff A, Frisch M, Bayerlein M, Werner T 2005. MatInspector and beyond: promoter analysis based on transcription factor binding sites. Bioinformatics 21: 2933–2942 [DOI] [PubMed] [Google Scholar]
- Chen L, Chatterjee M, Li JY 2010. The mouse homeobox gene Gbx2 is required for the development of cholinergic interneurons in the striatum. J Neurosci 30: 14824–14834 [DOI] [PMC free article] [PubMed] [Google Scholar]
- Corradin O, Saiakhova A, Akhtar-Zaidi B, Myeroff L, Willis J, Cowper-Sal Lari R, Lupien M, Markowitz S, Scacheri PC 2014. Combinatorial effects of multiple enhancer variants in linkage disequilibrium dictate levels of gene expression to confer susceptibility to common traits. Genome Res 24: 1–13 [DOI] [PMC free article] [PubMed] [Google Scholar]
- Dauvilliers Y, Winkelmann J 2013. Restless legs syndrome: update on pathogenesis. Curr Opin Pulm Med 19: 594–600 [DOI] [PubMed] [Google Scholar]
- DeAndrade MP, Johnson RL Jr, Unger EL, Zhang L, van Groen T, Gamble KL, Li Y 2012. Motor restlessness, sleep disturbances, thermal sensory alterations and elevated serum iron levels in Btbd9 mutant mice. Hum Mol Genet 21: 3984–3992 [DOI] [PMC free article] [PubMed] [Google Scholar]
- Dixon JR, Selvaraj S, Yue F, Kim A, Li Y, Shen Y, Hu M, Liu JS, Ren B 2012. Topological domains in mammalian genomes identified by analysis of chromatin interactions. Nature 485: 376–380 [DOI] [PMC free article] [PubMed] [Google Scholar]
- Dubchak I, Brudno M, Loots GG, Pachter L, Mayor C, Rubin EM, Frazer KA 2000. Active conservation of noncoding sequences revealed by three-way species comparisons. Genome Res 10: 1304–1306 [DOI] [PMC free article] [PubMed] [Google Scholar]
- Dudbridge F 2008. Likelihood-based association analysis for nuclear families and unrelated subjects with missing genotype data. Hum Hered 66: 87–98 [DOI] [PMC free article] [PubMed] [Google Scholar]
- Freeman A, Pranski E, Miller RD, Radmard S, Bernhard D, Jinnah HA, Betarbet R, Rye DB, Sanyal S 2012. Sleep fragmentation and motor restlessness in a Drosophila model of Restless Legs Syndrome. Curr Biol 22: 1142–1148 [DOI] [PMC free article] [PubMed] [Google Scholar]
- Gabriel SB, Schaffner SF, Nguyen H, Moore JM, Roy J, Blumenstiel B, Higgins J, DeFelice M, Lochner A, Faggart M, et al. 2002. The structure of haplotype blocks in the human genome. Science 296: 2225–2229 [DOI] [PubMed] [Google Scholar]
- Gailus-Durner V, Fuchs H, Adler T, Aguilar Pimentel A, Becker L, Bolle I, Calzada-Wack J, Dalke C, Ehrhardt N, Ferwagner B, et al. 2009. Systemic first-line phenotyping. Methods Mol Biol 530: 463–509 [DOI] [PubMed] [Google Scholar]
- Giesert F, Hofmann A, Bürger A, Zerle J, Kloos K, Hafen U, Ernst L, Zhang J, Vogt-Weisenhorn DM, Wurst W 2013. Expression analysis of Lrrk1, Lrrk2 and Lrrk2 splice variants in mice. PLoS ONE 8: e63778. [DOI] [PMC free article] [PubMed] [Google Scholar]
- Hauck SM, Dietter J, Kramer RL, Hofmaier F, Zipplies JK, Amann B, Feuchtinger A, Deeg CA, Ueffing M 2010. Deciphering membrane-associated molecular processes in target tissue of autoimmune uveitis by label-free quantitative mass spectrometry. Mol Cell Proteomics 9: 2292–2305 [DOI] [PMC free article] [PubMed] [Google Scholar]
- Herrmann MG, Durtschi JD, Bromley LK, Wittwer CT, Voelkerding KV 2006. Amplicon DNA melting analysis for mutation scanning and genotyping: cross-platform comparison of instruments and dyes. Clin Chem 52: 494–503 [DOI] [PubMed] [Google Scholar]
- Hornyak M, Trenkwalder C, Kohnen R, Scholz H 2012. Efficacy and safety of dopamine agonists in restless legs syndrome. Sleep Med 13: 228–236 [DOI] [PubMed] [Google Scholar]
- The International HapMap Consortium 2003. The International HapMap Project. Nature 426: 789–796 [DOI] [PubMed] [Google Scholar]
- Li G, Ruan X, Auerbach RK, Sandhu KS, Zheng M, Wang P, Poh HM, Goh Y, Lim J, Zhang J, et al. 2012. Extensive promoter-centered chromatin interactions provide a topological basis for transcription regulation. Cell 148: 84–98 [DOI] [PMC free article] [PubMed] [Google Scholar]
- Maurano MT, Humbert R, Rynes E, Thurman RE, Haugen E, Wang H, Reynolds AP, Sandstrom R, Qu H, Brody J, et al. 2012. Systematic localization of common disease-associated variation in regulatory DNA. Science 337: 1190–1195 [DOI] [PMC free article] [PubMed] [Google Scholar]
- Medina L, Abellán A 2012. Subpallial structures. In The mouse nervous system (ed. Watson C, Paxinos G, Puelles L), pp. 173–219. Elsevier, London; Waltham, San Diego [Google Scholar]
- Merl J, Ueffing M, Hauck SM, von Toerne C 2012. Direct comparison of MS-based label-free and SILAC quantitative proteome profiling strategies in primary retinal Müller cells. Proteomics 12: 1902–1911 [DOI] [PubMed] [Google Scholar]
- Penkov D, Mateos San Martín D, Fernandez-Díaz LC, Rosselló CA, Torroja C, Sánchez-Cabo F, Warnatz HJ, Sultan M, Yaspo ML, Gabrieli A, et al. 2013. Analysis of the DNA-binding profile and function of TALE homeoproteins reveals their specialization and specific interactions with Hox genes/proteins. Cell Rep 3: 1321–1333 [DOI] [PubMed] [Google Scholar]
- Pennacchio LA, Ahituv N, Moses AM, Prabhakar S, Nobrega MA, Shoukry M, Minovitsky S, Dubchak I, Holt A, Lewis KD, et al. 2006. In vivo enhancer analysis of human conserved non-coding sequences. Nature 444: 499–502 [DOI] [PubMed] [Google Scholar]
- Prabhakar S, Poulin F, Shoukry M, Afzal V, Rubin EM, Couronne O, Pennacchio LA 2006. Close sequence comparisons are sufficient to identify human cis-regulatory elements. Genome Res 16: 855–863 [DOI] [PMC free article] [PubMed] [Google Scholar]
- Pruim RJ, Welch RP, Sanna S, Teslovich TM, Chines PS, Gliedt TP, Boehnke M, Abecasis GR, Willer CJ 2010. LocusZoom: regional visualization of genome-wide association scan results. Bioinformatics 26: 2336–2337 [DOI] [PMC free article] [PubMed] [Google Scholar]
- Royo JL, Maeso I, Irimia M, Gao F, Peter IS, Lopes CS, D’Aniello S, Casares F, Davidson EH, Garcia-Fernández J, et al. 2011. Transphyletic conservation of developmental regulatory state in animal evolution. Proc Natl Acad Sci 108: 14186–14191 [DOI] [PMC free article] [PubMed] [Google Scholar]
- Royo JL, Bessa J, Hidalgo C, Fernández-Miñán A, Tena JJ, Roncero Y, Gómez-Skarmeta JL, Casares F 2012. Identification and analysis of conserved cis-regulatory regions of the MEIS1 gene. PLoS ONE 7: e33617. [DOI] [PMC free article] [PubMed] [Google Scholar]
- Sabo PJ, Kuehn MS, Thurman R, Johnson BE, Johnson EM, Cao H, Yu M, Rosenzweig E, Goldy J, Haydock A, et al. 2006. Genome-scale mapping of DNase I sensitivity in vivo using tiling DNA microarrays. Nat Methods 3: 511–518 [DOI] [PubMed] [Google Scholar]
- Schmidt D, Wilson MD, Ballester B, Schwalie PC, Brown GD, Marshall A, Kutter C, Watt S, Martinez-Jimenez CP, Mackay S, et al. 2010. Five-vertebrate ChIP-seq reveals the evolutionary dynamics of transcription factor binding. Science 328: 1036–1040 [DOI] [PMC free article] [PubMed] [Google Scholar]
- Schormair B, Kemlink D, Roeske D, Eckstein G, Xiong L, Lichtner P, Ripke S, Trenkwalder C, Zimprich A, Stiasny-Kolster K, et al. 2008. PTPRD (protein tyrosine phosphatase receptor type δ) is associated with restless legs syndrome. Nat Genet 40: 946–948 [DOI] [PubMed] [Google Scholar]
- Somel M, Guo S, Fu N, Yan Z, Hu HY, Xu Y, Yuan Y, Ning Z, Hu Y, Menzel C, et al. 2010. MicroRNA, mRNA, and protein expression link development and aging in human and macaque brain. Genome Res 20: 1207–1218 [DOI] [PMC free article] [PubMed] [Google Scholar]
- Szentkiralyi A, Fendrich K, Hoffmann W, Happe S, Berger K 2011. Incidence of restless legs syndrome in two population-based cohort studies in Germany. Sleep Med 12: 815–820 [DOI] [PubMed] [Google Scholar]
- Theiler K. 1989. The house mouse, atlas of embryonic development. Springer, New York. [Google Scholar]
- Toresson H, Parmar M, Campbell K 2000. Expression of Meis and Pbx genes and their protein products in the developing telencephalon: implications for regional differentiation. Mech Dev 94: 183–187 [DOI] [PubMed] [Google Scholar]
- Tucker ES, Segall S, Gopalakrishna D, Wu Y, Vernon M, Polleux F, Lamantia AS 2008. Molecular specification and patterning of progenitor cells in the lateral and medial ganglionic eminences. J Neurosci 28: 9504–9518 [DOI] [PMC free article] [PubMed] [Google Scholar]
- Visel A, Blow MJ, Li Z, Zhang T, Akiyama JA, Holt A, Plajzer-Frick I, Shoukry M, Wright C, Chen F, et al. 2009. ChIP-seq accurately predicts tissue-specific activity of enhancers. Nature 457: 854–858 [DOI] [PMC free article] [PubMed] [Google Scholar]
- Westfall PH, Young SS 1993. Resampling-based multiple testing: Examples and methods for p-value adjustment. Wiley, New York [Google Scholar]
- Wichmann HE, Gieger C, Illig T, Group MKS 2005. KORA-gen–resource for population genetics, controls and a broad spectrum of disease phenotypes. Gesundheitswesen (Suppl 1) 67: S26–S30 [DOI] [PubMed] [Google Scholar]
- Winkelmann J, Schormair B, Lichtner P, Ripke S, Xiong L, Jalilzadeh S, Fulda S, Pütz B, Eckstein G, Hauck S, et al. 2007. Genome-wide association study of restless legs syndrome identifies common variants in three genomic regions. Nat Genet 39: 1000–1006 [DOI] [PubMed] [Google Scholar]
- Winkelman JW, Shahar E, Sharief I, Gottlieb DJ 2008. Association of restless legs syndrome and cardiovascular disease in the Sleep Heart Health Study. Neurology 70: 35–42 [DOI] [PubMed] [Google Scholar]
- Winkelmann J, Czamara D, Schormair B, Knauf F, Schulte EC, Trenkwalder C, Dauvilliers Y, Polo O, Högl B, Berger K, et al. 2011. Genome-wide association study identifies novel restless legs syndrome susceptibility loci on 2p14 and 16q12.1. PLoS Genet 7: e1002171. [DOI] [PMC free article] [PubMed] [Google Scholar]
- Woolfe A, Goodson M, Goode DK, Snell P, McEwen GK, Vavouri T, Smith SF, North P, Callaway H, Kelly K, et al. 2005. Highly conserved non-coding sequences are associated with vertebrate development. PLoS Biol 3: e7. [DOI] [PMC free article] [PubMed] [Google Scholar]