

Abstract
Objective
To assess a county population's exposure to different types of food sources reported to affect both diet quality and obesity rates.
Design
Food permit records obtained from the local health department served to establish the full census of food stores and restaurants. Employing prior categorization schemes which classified the relative healthfulness of food sources based on establishment type (i.e. supermarkets v. convenience stores, or full-service v. fast-food restaurants), food establishments were assigned to the healthy, unhealthy or undetermined groups.
Setting
King County, WA, USA.
Subjects
Full census of food sources.
Results
According to all categorization schemes, most food establishments in King County fell into the unhealthy and undetermined groups. Use of the food permit data showed that large stores, which included supermarkets as healthy food establishments, contained a sizeable number of bakery/delis, fish/meat, ethnic and standard quick-service restaurants and coffee shops, all food sources that, when housed in a separate venue or owned by a different business establishment, were classified as either unhealthy or of undetermined value to health.
Conclusions
To fully assess the potential health effects of exposure to the extant food environment, future research would need to establish the health value of foods in many such common establishments as individually owned grocery stores and ethnic food stores and restaurants. Within-venue exposure to foods should also be investigated.
Keywords: Census of food sources, Health value, Exposure
An individual's exposure to different types of food has become important in public health research because it is believed to influence both diet quality and obesity rates( 1 – 3 ). For example, living in an environment lacking healthy food sources has been linked to a lower-quality diet and to higher obesity rates, especially in lower-income populations( 4 – 10 ). Supermarkets are typically thought to have a broad selection of fresh fruits and vegetables and to offer healthy foods( 11 – 14 ), whereas convenience stores and fast-food restaurants are seen as carrying mainly unhealthy, energy-dense foods with a high content of saturated fats, added sugars and sodium( 15 – 20 ). Such a dichotomy may not do justice to the diversity of the food retail environment. To assess actual exposure to different types of food sources, a full census of food stores and restaurants in a given area may be required. The present study used food permits to inventory all food establishments in King County, WA, USA. The establishments were then classified by the healthfulness of the foods offered into healthy, unhealthy or undetermined groups to assess the utility of three categorization schemes used in prior studies. The implications of this work are discussed in terms of how the food environment might influence both diet quality and health.
Methods
Public Health-Seattle & King County (PHSKC) is the local health agency responsible for licensing all food vendors in King County, WA, and for the surveillance of food-borne disease. PHSKC food business permits identify food vendors by the name and the address of unique business establishments. They are allocated by the relative health risk of the types of foods offered (to include grocery, bakery/deli and fish/meat) and of the range of food preparation involved (e.g. pre-packaged sandwiches, baking/toasting, full food preparation). Restaurants have one food permit corresponding to the highest health risk related to how they prepare food, while large stores offering diverse types of foods and using a range of food preparations have multiple permits.
Food permits for the year 2008 were first grouped by type of publicly accessible food establishments, using a three-level classification system commonly found in business registers such as the North American Industry Classification System (NAICS)( 21 , 22 ). There were 9835 out of 10 254 permits associated with publicly accessible business establishments which had a unique address and corresponded to unique stores or restaurants. At level 1, food stores were separated from restaurants, corresponding to NAICS three-digit classification. At level 2, food stores were divided into broad- and limited-selection categories, and restaurants into full- and limited-service categories (NAICS four-digit classification). At level 3, stores and restaurants were categorized by eighteen common names used in business directories (NAICS five and six digits; Fig. 1)( 23 ). For stores with multiple permits, permits for bakery/deli, fish/meat, ethnic and standard quick service and coffee shops were inventoried because these permits corresponded to food types and sources that were also offered in the eighteen types of individual business establishments at level 3.
Fig. 1.
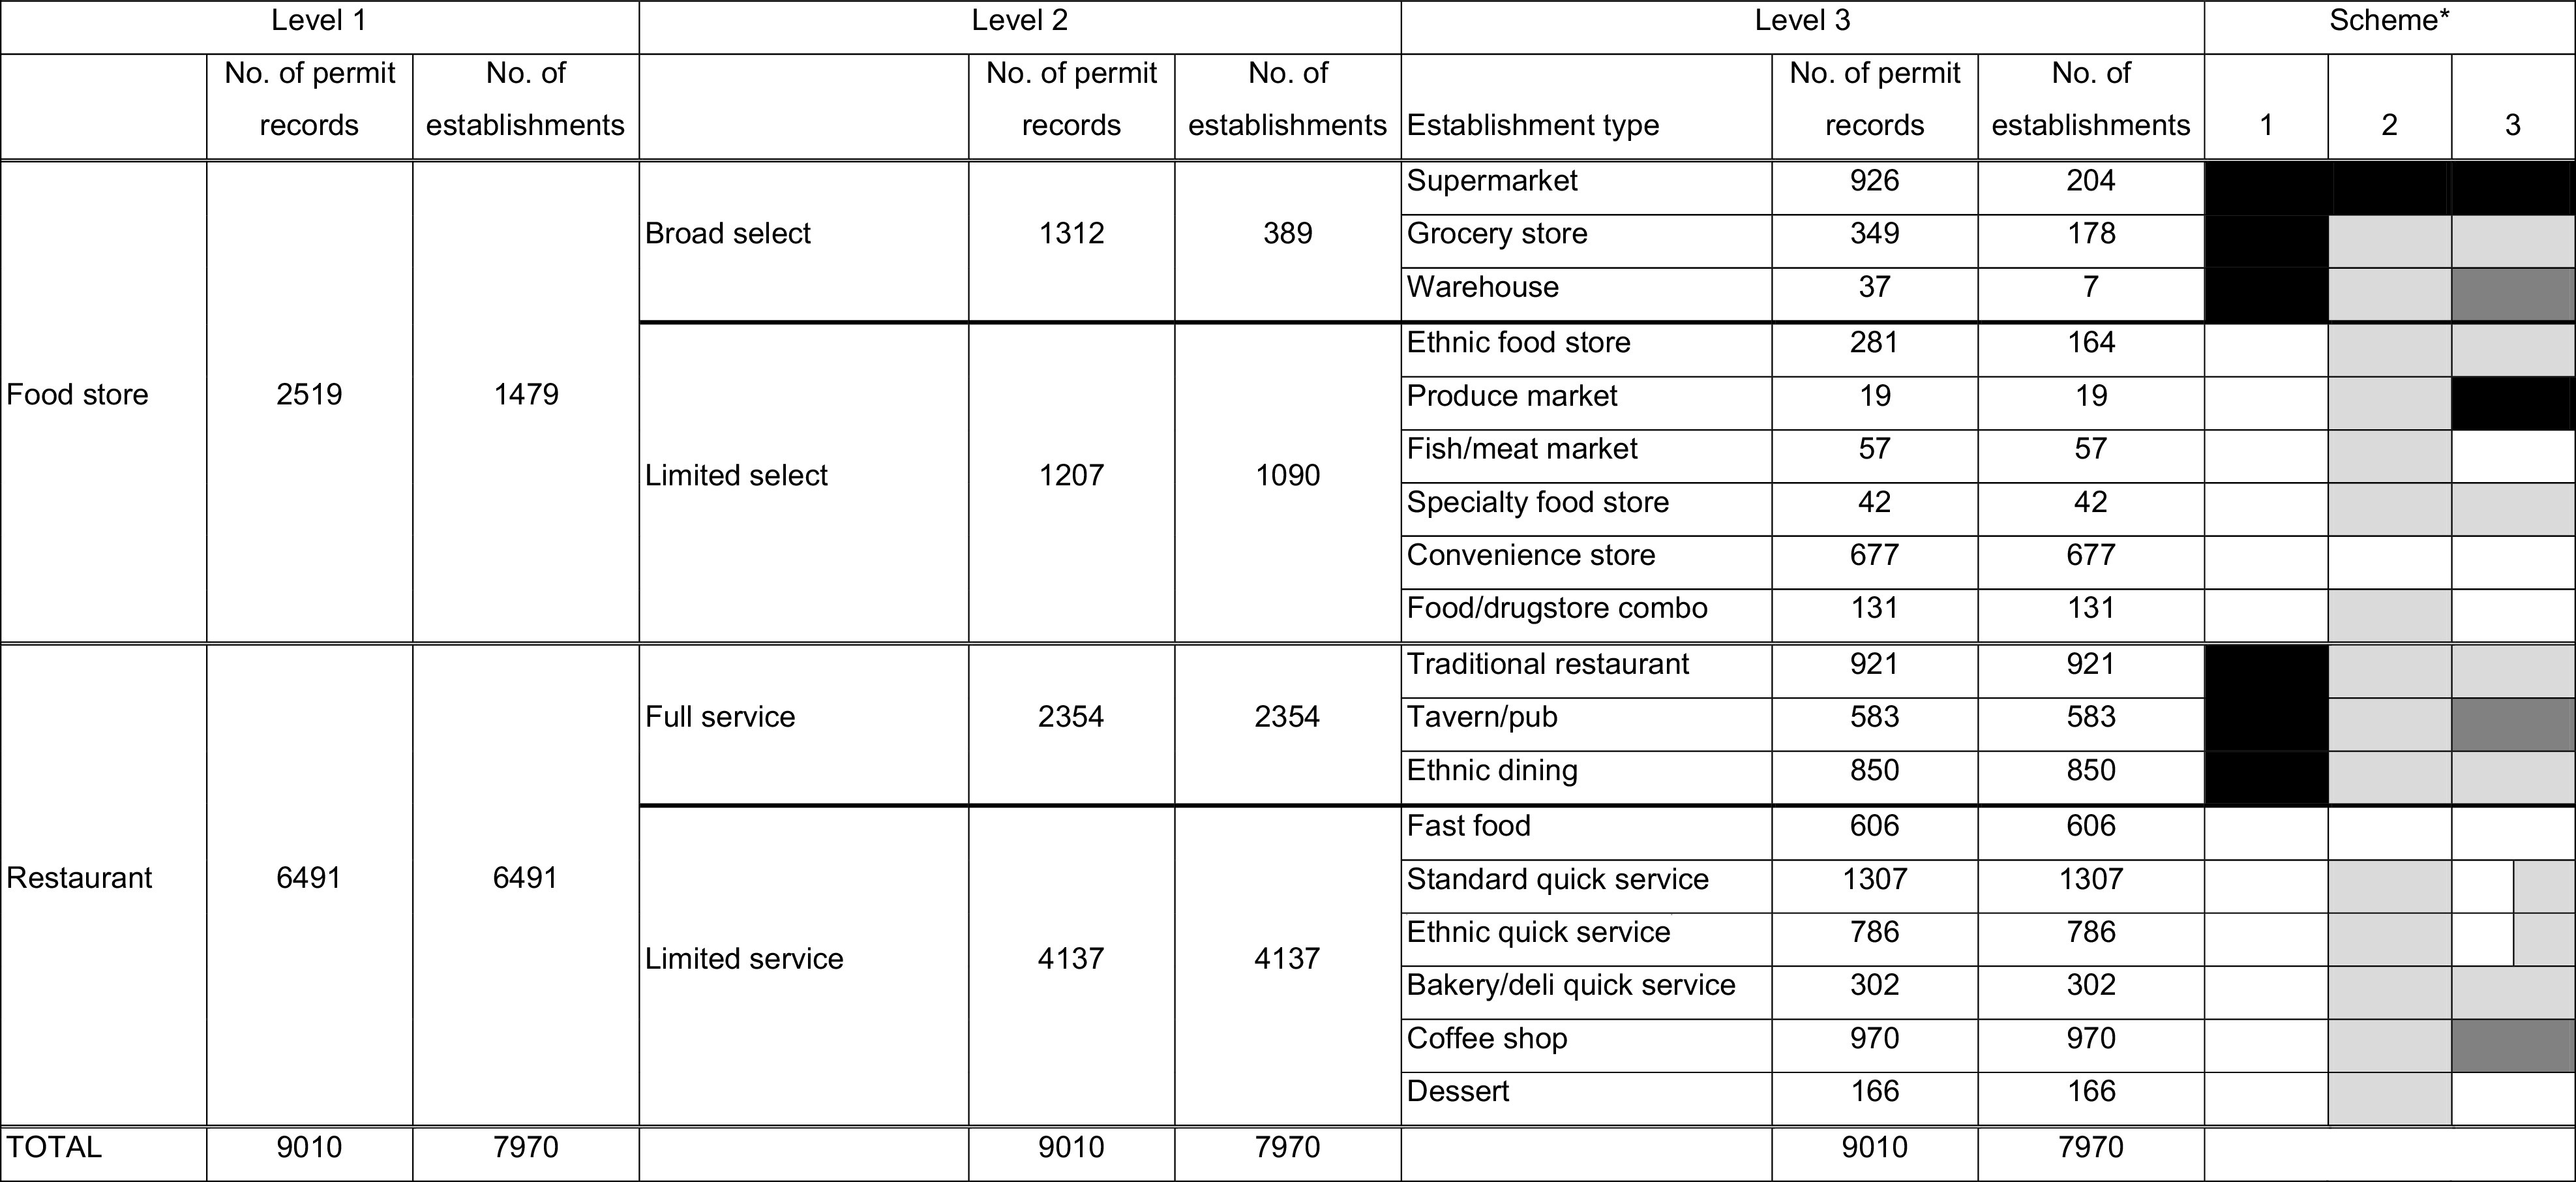
Three-level classification of food establishments and three schemes to classify the healthfulness of the foods offered. Relative healthfulness:
 , healthy;
 , unhealthy;
 , undetermined;
 , unclassified. *Scheme 1: broad-selection store/full-service restaurant = healthy, limited-selection store/service restaurant = undetermined; scheme 2: supermarket = healthy, convenience store and fast food = unhealthy; scheme 3: per Rundle et al.(
13
)
, unclassified. *Scheme 1: broad-selection store/full-service restaurant = healthy, limited-selection store/service restaurant = undetermined; scheme 2: supermarket = healthy, convenience store and fast food = unhealthy; scheme 3: per Rundle et al.(
13
)
About 38 % of the permits could be coded automatically into level 3 establishment types using the business establishment name and address information provided in the PHSKC data. Two researchers independently coded the remainder of the permits using Internet searches.
Food stores and restaurants were then categorized by the likely healthfulness of the foods offered. Based on prior categorization schemes, these food establishments were assigned to the healthy, unhealthy or undetermined groups. In a first scheme, broad-selection stores and full-service restaurants were assigned to the healthful group, and all other food establishments were allocated to the unhealthy category. Studies using this scheme hypothesized that customers seeking healthy foods were more likely to find them in stores offering a full range of food products including dry goods and fresh fruits and vegetables. Similarly, full-service restaurants were more likely to offer balanced meals than limited-service restaurants( 24 – 29 ). In a second scheme, supermarkets were identified as healthy food venues, convenience stores and fast-food restaurants as unhealthy venues, and all other food establishments were in the undetermined group. This scheme is found in a large number of studies that have focused on supermarkets as more likely to offer healthy foods than individual grocery stores; and on fast-food restaurants as the main source of unhealthy prepared food( 30 – 33 ). The third scheme followed the classification of food establishments in New York City developed by Rundle et al. ( 13 ). From Rundle's class of BMI-healthy food outlets, supermarkets and fruit and vegetable markets were included in the healthy category; however, natural/health food stores could not be classified because these stores were not identified in the King County inventory. Of Rundle's outlets in the BMI-unhealthy category, fast-food restaurants, convenience stores, bakeries and meat markets were classified in the unhealthy category; candy and nut stores could not be classified according to the King County inventory, although King County's dessert establishments, which were not part of Rundle's list of outlets, were deemed to be similar enough to bakeries to be classified as unhealthy. Of Rundle's outlets in the BMI-intermediate category, medium-sized grocery stores, fish markets and specialty stores were classified as having undetermined health value. In the same BMI-intermediate category, bodegas were considered as ethnic food stores and other (non-fast-food) restaurants were considered as full-service traditional and ethnic restaurants in the King County inventory; both were classified as of undetermined health value. Of King County's inventory of standard and ethnic quick-service restaurants, half were classified as undetermined and the other half as unhealthy because they included pizza restaurants, which Rundle classified as unhealthy. King County's warehouse stores, taverns/pubs and coffee shops were not part of Rundle's outlet list and could be not classified. On the other hand, food/drug combo stores, which were absent from Rundle's list, were included in the same unhealthy category as convenience stores.
Results
There were 1479 food stores and 6491 restaurants in King County, for a total of 7970 food establishments (Fig. 1, level 1). Most food stores (73·7 %) and more than half of the restaurants (63·7 %) were in the limited-selection or limited-service category (Fig. 1, level 2). Food stores in the broad-selection category were supermarkets, grocery stores and warehouse stores; the limited-selection category included ethnic food stores, produce markets, fish/meat stores, specialty foods, convenience stores and food/drug combos( 23 ) (Fig. 1, level 3). Supermarkets accounted for 14 % of all food stores, while convenience stores comprised 46 % and food/drug combos 9 % of the food stores.
Full-service restaurants were traditional and ethnic restaurants and taverns/pubs; the limited-service category was comprised of fast-food, standard and ethnic quick-service restaurants and bakery/deli, coffee shops and dessert establishments (Fig. 1, level 3). Fast-food restaurants accounted for 9 % of all the restaurants, whereas full-service restaurants comprised 36 %. Also, 25 % of the restaurants offered ethnic foods.
Based on the definition of healthful food establishments as including stores in the broad-selection category and full-service restaurants (scheme 1), one in three venues (34 %) qualified as healthy food stores in King County, leaving 66 % in the unhealthy category (Fig. 1, Fig. 2). Based on scheme 2, supermarkets were the only healthful venues, constituting 3 % of the full census; convenience stores and fast-food restaurants as unhealthful establishments were 16 % of the census, leaving the majority of the establishments (81 %) in the undetermined category. Based on the New York City classification (scheme 3), only 3 % of the establishments were healthful, 37 % were unhealthful and 40 % were of undetermined value to health. Another 21 % could not be classified because establishments such as warehouses, taverns/pubs and coffee shops were not included in the New York research.
Fig. 2.

Distribution of the relative healthfulness (
 , healthy;
 , unhealthy;
 , undetermined;
 , unclassified) of food sources according to three classification schemes for food establishments (scheme 1: broad-selection store/full-service restaurant = healthy, limited-selection store/service restaurant = undetermined; scheme 2: supermarket (supermt) = healthy, convenience store (conv) and fast food = unhealthy; scheme 3: per Rundle et al.(
13
)); King County, WA, USA, 2008
, unclassified) of food sources according to three classification schemes for food establishments (scheme 1: broad-selection store/full-service restaurant = healthy, limited-selection store/service restaurant = undetermined; scheme 2: supermarket (supermt) = healthy, convenience store (conv) and fast food = unhealthy; scheme 3: per Rundle et al.(
13
)); King County, WA, USA, 2008
There was one food permit record per restaurant and an average of 1·7 permits per food store; expectedly, broad-selection stores had three times the number of food permits (3·4) than limited-selection stores (1·1). Stores with multiple permits, which included supermarkets and grocery, warehouse and ethnic food stores, added 516 bakery/delis, 376 fish/meat, forty-eight ethnic and eleven standard quick-service restaurants, and ninety coffee shops to the census, for a total of 1035 within-venue outlets, or 13 % of the full census (Fig. 3).
Fig. 3.

Number of establishments with a single building permit for bakery/deli, fish/meat, ethnic and standard quick service, and coffee shops (
 ) and total number of permit records (
 ) including those in food stores (supermarkets, grocery, warehouse and ethnic food stores) with multiple permits; King County, WA, USA, 2008
Discussion
An important new finding from this methodological research is the dearth of healthful establishments in all three classification schemes, which suggests a potentially serious imbalance in exposure to healthy foods in King County. The findings also raise questions about the limitation of classification systems that point to a small number of ‘healthy’ supermarkets (14 % of the food stores), relative to many ‘unhealthy’ convenience stores (46 % of the stores) and to few ‘unhealthy’ fast-food restaurants (9 % of the restaurants). Furthermore, aside from classification scheme 1, which placed all establishments not considered healthy into the unhealthy category, a sizeable proportion of food sources available to King County residents fell into the undetermined category (81 % and 39 % in schemes 2 and 3, respectively). The large number of food establishments classified as undetermined makes it difficult to assess the potential health effects of exposure to the extant food environment. Perhaps future studies should establish the healthfulness of a broader range of food sources( 2 ). For example, more could be learned about the health value of foods found in the many smaller, often individually owned, grocery stores that fall outside the definition of a supermarket or a convenience store( 34 – 38 ), or in full- and limited-service restaurants( 39 ). For restaurants, the limited-service category, alternatively classified in the three schemes as unhealthy or undetermined, contained more than half of King County's restaurants. Of those, only 15 % were the well-studied fast-food restaurants; but 32 % were the lesser understood quick-service restaurants, many of which provide the same cheap, high-energy foods as fast-food restaurants. Finally, 25 % of the restaurants and 11 % of the food stores offered ethnic foods, yet few studies have examined the food environment for culturally appropriate foods( 17 , 37 , 40 , 41 ).
The use of the food permit data showed that large stores, and specifically supermarkets, contained a sizeable number of bakery/delis, fish/meat, ethnic and standard quick-service restaurants and coffee shops. These food sources corresponded to an additional 892 food stores and 149 restaurants in the census of food sources. Had these been housed in a separate establishment or owned by a different business, they would have been classified not as the healthy establishments that supermarkets were deemed to be, but as being of either unhealthy or undetermined value to health. This suggests that differences between venue-based and within-venue exposure should be explored, recognizing that venue-specific assessments address only a first level of exposure to food, while a second exposure level occurs within the venue, before food selection takes place( 42 ). Within-venue exposure would be important to consider given large stores’ significant share of the grocery market( 43 ). It also would begin to confront the complex relationship between exposure and behaviour: in so far as exposure to the food environment affects diet and health, it ultimately does so through such behaviours as food selection, acquisition and consumption( 44 – 49 ). Measures of the likelihood of individuals purchasing healthy foods from different types of establishments will eventually be needed, because access to healthy foods does not imply ultimate purchase and consumption patterns.
Food permit data provided more detail about the types of foods sold in and within food establishments than commercial databases. However, inconsistencies in the permit descriptions required manual coding for the majority of the businesses. For example, 175 establishments that manual checking indicated sold groceries did not have a grocery permit. The principal value of the permit data lay in its completeness. There were 1000 more restaurants in the permit data than in InfoUSA (data not shown); also, InfoUSA provided fewer supermarkets and fewer fast-food restaurants than were classified from the permit data. These differences are in great part due to the mandatory nature of inspections associated with food permits compared with the discretionary self-reports assembled in commercial databases. While the shortcomings of commercial data have been documented( 50 – 52 ), the advantages of permit data in supporting research on health and food exposure would need to be further investigated as the access to and the accuracy and completeness of the data might be linked to a county's wealth and related public institutional support.
The present study was limited to environmental exposures measured by the counts of establishments, which did not reflect the actual use of the establishments considered. Nationwide sales figures demonstrate that the twenty largest food retailers combined had 64 % of sales in 2009, while convenience stores accounted for 6 %( 43 ). The study was also limited to King County, WA, USA. A census of food venues, and hence exposure to the food environment, might vary by region based on a region's density of development( 1 , 49 , 53 ), its demographic and socio-economic characteristics( 44 ) and food costs( 54 – 56 ). For example, the ratio of restaurants to stores might vary by regional purchasing power( 57 ): Erie County, NY, had a ratio of one food store to 2·5 restaurants with about 2·6 food establishments per 1000 population, whereas King County had 4·2 food establishments per 1000 population( 37 ).
Conclusions
The King County census of food establishments indicated that existing classification systems of the presumed healthfulness of available foods might not fully reflect the many choices available to County residents. The majority of the 7970 food establishments fell into the undetermined category, making it difficult to assess the impact of the food environment on diet quality and health. Future research would need to establish the health value of foods in the many individually owned grocery stores and ethnic food stores and restaurants. The food permit data also suggested the need to examine how within-venue exposure to food in large stores might constrain or enhance exposure to diet quality and health.
Acknowledgements
Sources of funding: This work was carried out under grants R01AG042176, TWINStudy of environment, lifestyle behaviors, and health; R01DK076608, Food environment, diet quality, and disparities in obesity; and R01HL091881, The effect of light rail transit on physical activity: a natural experiment. Conflicts of interest: The authors have no conflicts of interest in the presented research. Ethics: Ethical approval was not required. Authors’ contributions: All authors contributed to the conceptual structure and the writing of the manuscript. A.V.M. led the research design and the development of the manuscript. A.D., G.E.D., P.M.H. and B.E.S. contributed to the research method. E.S. carried out the classification of the food permits and establishments.
References
- 1. Forsyth A, Lytle L & Van Riper D (2010) Finding food: issues and challenges in using geographic information systems to measure food access. J Transport Land Use 3, 43–65. [DOI] [PMC free article] [PubMed] [Google Scholar]
- 2. Lytle LA (2009) Measuring the food environment: state of the science. Am J Prev Med 36, 4 Suppl., S134–S144. [DOI] [PMC free article] [PubMed] [Google Scholar]
- 3. McKinnon RA, Reedy J, Morrissette MA et al. (2009) Measures of the food environment: a compilation of the literature, 1990–2007. Am J Prev Med 36, 4 Suppl., S124–S133. [DOI] [PubMed] [Google Scholar]
- 4. Brown A, Vargas R, Ang A et al. (2008) The neighborhood food resource environment and the health of residents with chronic conditions: the food resource environment and the health of residents. J Gen Intern Med 23, 1137–1144. [DOI] [PMC free article] [PubMed] [Google Scholar]
- 5. Franco M, Diez Roux AV, Glass TA et al. (2008) Neighborhood characteristics and availability of healthy foods in Baltimore. Am J Prev Med 35, 561–567. [DOI] [PMC free article] [PubMed] [Google Scholar]
- 6. Larson N & Story M (2009) A review of environmental influences on food choices. Ann Behav Med 38, Suppl. 1, S56–S73. [DOI] [PubMed] [Google Scholar]
- 7. Lovasi GS, Hutson MA, Guerra M et al. (2009) Built environments and obesity in disadvantaged populations. Epidemiol Rev 31, 7–20. [DOI] [PubMed] [Google Scholar]
- 8. Walker RE, Keane CR & Burke JG (2010) Disparities and access to healthy food in the United States: a review of food deserts literature. Health Place 16, 876–884. [DOI] [PubMed] [Google Scholar]
- 9. Wrigley N, Warm D & Margetts B (2003) Deprivation, diet, and food-retail access: findings from the Leeds ‘food deserts’ study. Environ Plan A 35, 151–188. [Google Scholar]
- 10. Zenk SN, Schulz AJ, Israel BA et al. (2005) Neighborhood racial composition, neighborhood poverty, and the spatial accessibility of supermarkets in metropolitan Detroit. Am J Public Health 95, 660–667. [DOI] [PMC free article] [PubMed] [Google Scholar]
- 11. Apparicio P, Cloutier MS & Shearmur R (2007) The case of Montreal's missing food deserts: evaluation of accessibility to food supermarkets. Int J Health Geogr 6, 4. [DOI] [PMC free article] [PubMed] [Google Scholar]
- 12. Laraia BA, Siega-Riz AM, Kaufman JS et al. (2004) Proximity of supermarkets is positively associated with diet quality index for pregnancy. Prev Med 39, 869–875. [DOI] [PubMed] [Google Scholar]
- 13. Rundle A, Neckerman KM, Freeman L et al. (2009) Neighborhood food environment and walkability predict obesity in New York City. Environ Health Perspect 117, 442–447. [DOI] [PMC free article] [PubMed] [Google Scholar]
- 14. Ver Ploeg M, Breneman V, Farrigan T et al. (2009) Access to Affordable and Nutritious Food – Measuring and Understanding Food Deserts and Their Consequences: Report to Congress. Washington, DC: US Department of Agriculture, Economic Research Service; available at http://www.ers.usda.gov/Publications/AP/AP036/
- 15. Bodor J, Rice J, Farley T et al. (2010) The association between obesity and urban food environments. J Urban Health 87, 771–781. [DOI] [PMC free article] [PubMed] [Google Scholar]
- 16. Cummins SC, McKay L & MacIntyre S (2005) McDonald's restaurants and neighborhood deprivation in Scotland and England. Am J Prev Med 29, 308–310. [DOI] [PubMed] [Google Scholar]
- 17. Duerksen SC, Elder JP, Arredondo EM et al. (2007) Family restaurant choices are associated with child and adult overweight status in Mexican-American families. J Am Diet Assoc 107, 849–853. [DOI] [PubMed] [Google Scholar]
- 18. Kipke MD, Iverson E, Moore D et al. (2007) Food and park environments: neighborhood-level risks for childhood obesity in east Los Angeles. J Adolesc Health 40, 325–333. [DOI] [PubMed] [Google Scholar]
- 19. Sharkey JR, Johnson CM, Dean WR et al. (2011) Association between proximity to and coverage of traditional fast-food restaurants and non-traditional fast-food outlets and fast-food consumption among rural adults. Int J Health Geogr 10, 37. [DOI] [PMC free article] [PubMed] [Google Scholar]
- 20. Simon PA, Kwan D, Angelescu A et al. (2008) Proximity of fast food restaurants to schools: do neighborhood income and type of school matter? Prev Med 47, 284–288. [DOI] [PubMed] [Google Scholar]
- 21. US Census Bureau (2007) North American Industry Classification System. 2007 NAICS Definition. Sector 72 – Accommodation and Food Services. 722 Food Services and Drinking Places. http://www.census.gov/cgi-bin/sssd/naics/naicsrch?code=722&search=2007%20NAICS%20Search (accessed March 2013).
- 22. US Census Bureau (2007) North American Industry Classification System. 2007 NAICS Definition. Sector 44–45 – Retail Trade. 445 Food and Beverage Stores. http://www.census.gov/cgi-bin/sssd/naics/naicsrch?code=445&search=2007%20NAICS%20Search (accessed March 2013).
- 23. Food Marketing Institute (2013) Supermarket Facts. Industry Overview 2011. http://www.fmi.org/research-resources/supermarket-facts (accessed March 2013).
- 24. Boone-Heinonen J, Gordon-Larsen P, Kiefe CI et al. (2011) Fast food restaurants and food stores: longitudinal associations with diet in young to middle-aged adults: the CARDIA study. Arch Intern Med 171, 1162–1170. [DOI] [PMC free article] [PubMed] [Google Scholar]
- 25. He M, Tucker P, Irwin JD et al. (2012) Obesogenic neighbourhoods: the impact of neighbourhood restaurants and convenience stores on adolescents’ food consumption behaviours. Public Health Nutr 15, 2331–2339. [DOI] [PMC free article] [PubMed] [Google Scholar]
- 26. Casey AA, Elliott M, Glanz K et al. (2008) Impact of the food environment and physical activity environment on behaviors and weight status in rural US communities. Prev Med 47, 600–604. [DOI] [PMC free article] [PubMed] [Google Scholar]
- 27. Galvez MP, Morland K, Raines C et al. (2008) Race and food store availability in an inner-city neighbourhood. Public Health Nutr 11, 624–631. [DOI] [PubMed] [Google Scholar]
- 28. Latham J & Moffat T (2007) Determinants of variation in food cost and availability in two socioeconomically contrasting neighbourhoods of Hamilton, Ontario, Canada. Health Place 13, 273–287. [DOI] [PubMed] [Google Scholar]
- 29. Moore LV & Diez Roux AV (2006) Associations of neighborhood characteristics with the location and type of food stores. Am J Public Health 96, 325–331. [DOI] [PMC free article] [PubMed] [Google Scholar]
- 30. Fleischhacker SE, Evenson KR, Rodriguez DA et al. (2011) A systematic review of fast food access studies. Obes Rev 15, e460–e471. [DOI] [PubMed] [Google Scholar]
- 31. Glanz K (2009) Measuring food environments: a historical perspective. Am J Prev Med 36, 4 Suppl., S93–S98. [DOI] [PubMed] [Google Scholar]
- 32. Holsten JE (2009) Obesity and the community food environment: a systematic review. Public Health Nutr 12, 397–405. [DOI] [PubMed] [Google Scholar]
- 33. Sturm R (2008) Disparities in the food environment surrounding US middle and high schools. Public Health 122, 681–690. [DOI] [PMC free article] [PubMed] [Google Scholar]
- 34. Gibson DM (2011) The neighborhood food environment and adult weight status: estimates from longitudinal data. Am J Public Health 101, 71–78. [DOI] [PMC free article] [PubMed] [Google Scholar]
- 35. Glanz K, Sallis JF, Saelens BE et al. (2007) Nutrition Environment Measures Survey in stores (NEMS-S): development and evaluation. Am J Prev Med 32, 282–289. [DOI] [PubMed] [Google Scholar]
- 36. Morland K, Wing S, Diez Roux A et al. (2002) Neighborhood characteristics associated with the location of food stores and food service places. Am J Prev Med 22, 23–29. [DOI] [PubMed] [Google Scholar]
- 37. Raja S, Ma C & Yadav P (2008) Beyond food deserts: measuring and mapping racial disparities in neighborhood food environments. J Plan Educ Res 27, 469–482. [Google Scholar]
- 38. Zenk SN, Schulz AJ, Israel BA et al. (2006) Fruit and vegetable access differs by community racial composition and socioeconomic position in Detroit, Michigan. Ethn Dis 16, 275–280. [PubMed] [Google Scholar]
- 39. Saelens BE, Glanz K, Sallis JF et al. (2007) Nutrition Environment Measures Study in restaurants (NEMS-R): development and evaluation. Am J Prev Med 32, 273–281. [DOI] [PubMed] [Google Scholar]
- 40. Wang MC, Cubbin C, Ahn D et al. (2008) Changes in neighbourhood food store environment, food behaviour and body mass index, 1981–1990. Public Health Nutr 11, 963–970. [DOI] [PMC free article] [PubMed] [Google Scholar]
- 41. Wang MC, Kim S, Gonzalez AA et al. (2007) Socioeconomic and food-related physical characteristics of the neighbourhood environment are associated with body mass index. J Epidemiol Community Health 61, 491–498. [DOI] [PMC free article] [PubMed] [Google Scholar]
- 42. Kelly B, Flood VM & Yeatman H (2011) Measuring local food environments: an overview of available methods and measures. Health Place 17, 1284–1293. [DOI] [PubMed] [Google Scholar]
- 43. US Department of Agriculture (2010) Food marketing system in the US: food retailing http://www.ers.usda.gov/Briefing/FoodMarketingSystem/foodretailing.htm (accessed July 2012).
- 44. Ayala GX, Mueller K, Lopez-Madurga E et al. (2005) Restaurant and food shopping selections among Latino women in Southern California. J Am Diet Assoc 105, 38–45. [DOI] [PubMed] [Google Scholar]
- 45. Dennisuk LA, Coutinho AJ, Suratkar S et al. (2011) Food expenditures and food purchasing among low-income, urban, African-American youth. Am J Prev Med 40, 625–628. [DOI] [PubMed] [Google Scholar]
- 46. Frank L, Kerr J, Saelens B et al. (2009) Food outlet visits, physical activity and body weight: variations by gender and race ethnicity. Br J Sports Med 43, 124–131. [DOI] [PubMed] [Google Scholar]
- 47. Giskes K, Van Lenthe FJ, Brug J et al. (2007) Socioeconomic inequalities in food purchasing: the contribution of respondent-perceived and actual (objectively measured) price and availability of foods. Prev Med 45, 41–48. [DOI] [PubMed] [Google Scholar]
- 48. Hackett A, Boddy L, Boothby J et al. (2008) Mapping dietary habits may provide clues about the factors that determine food choice. J Hum Nutr Diet 21, 428–437. [DOI] [PubMed] [Google Scholar]
- 49. Sharkey JR, Horel S, Han D et al. (2009) Association between neighborhood need and spatial access to food stores and fast food restaurants in neighborhoods of Colonias. Int J Health Geogr 8, 9. [DOI] [PMC free article] [PubMed] [Google Scholar]
- 50. Powell LM, Han E, Zenk SN et al. (2011) Field validation of secondary commercial data sources on the retail food outlet environment in the US. Health Place 17, 1122–1131. [DOI] [PubMed] [Google Scholar]
- 51. Ohri-Vachaspati P, Martinez D, Yedidia MJ et al. (2011) Improving data accuracy of commercial food outlet databases. Am J Health Promot 26, 116–122. [DOI] [PubMed] [Google Scholar]
- 52. Han E, Powell LM, Zenk SN et al. (2012) Classification bias in commercial business lists for retail food stores in the US. Int J Behav Nutr Phys Act 9, 46. [DOI] [PMC free article] [PubMed] [Google Scholar]
- 53. Zenk SN, Schulz AJ, Hollis-Neely T et al. (2005) Fruit and vegetable intake in African Americans: income and store characteristics. Am J Prev Med 29, 1–9. [DOI] [PubMed] [Google Scholar]
- 54. Andrews M, Kantor LS, Lino M et al. (2001) Using USDA's thrifty food plan to assess food availability and affordability. Food Access 24, 45–53. [Google Scholar]
- 55. Chung C & Myers SL (1999) Do the poor pay more for food? An analysis of grocery store availability and food price disparities. J Consum Aff 33, 276–296. [Google Scholar]
- 56. Jetter KM & Cassady DL (2006) The availability and cost of healthier food alternatives. Am J Prev Med 30, 38–44. [DOI] [PubMed] [Google Scholar]
- 57. Economic Research Service (2011) Briefing rooms, food consumer price index and expenditures. http://www.ers.usda.gov/Briefing/CPIFoodAndExpenditures/ (accessed July 2012).