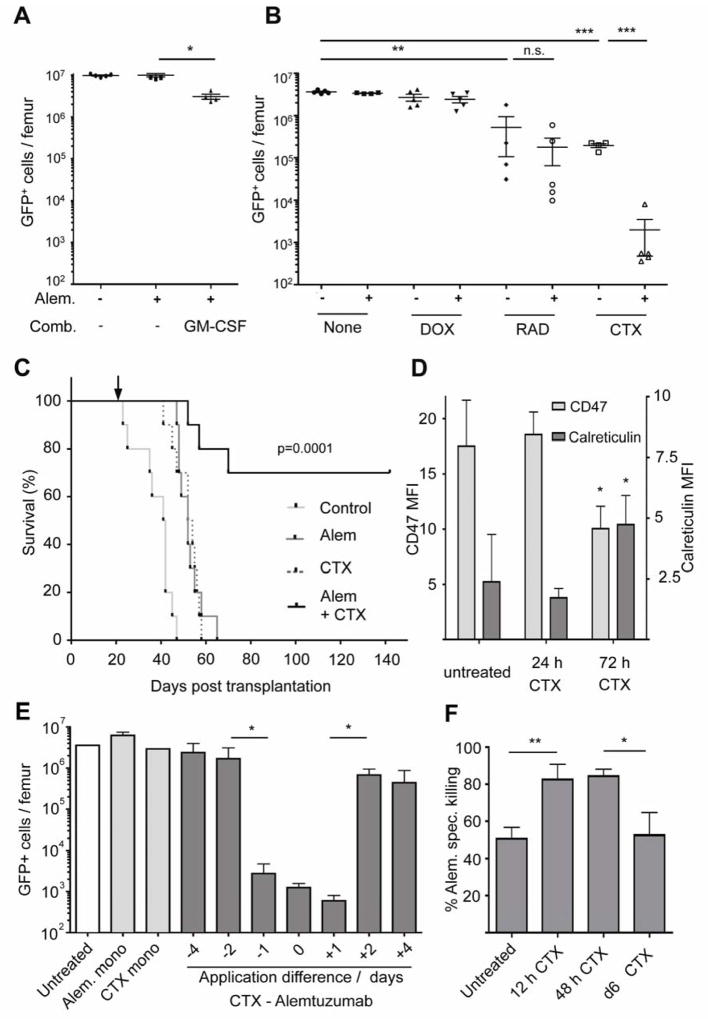
Figure 3. Combination therapy with alemtuzumab and CTX cures pre-B-ALL in the hMB model.
A graph showing the number of live tumor cells in the bone marrow of mice treated with alemtuzumab alone or in combination with (A) GM-CSF (2×100ng/dose s.c. for 6 days) or (B) doxorubicin (5 mg/kg)(DOX), CTX (100 mg/kg)(CTX), or whole body irradiation (5 Gy)(RAD). Organs were harvested 8 days after treatment initiation. Each symbol represents one mouse. (C) Kaplan-Meier analysis comparing the survival of secondary hMB recipient mice receiving different anti-tumor treatments as indicated by arrow (n=10 per treatment arm). (D) A graph displaying CD47 and calreticulin expression on leukemia cells prior to CTX treatment and 24 and 72 hours post treatment post treatment. (E) A graph showing the number of surviving GFP+ cells following treatment of mice with alemtuzumab at distinct intervals relative to CTX. (F) A graph showing susceptibility to macrophage-mediated killing of hMB cells ex vivo following CTX chemotherapy. Data are shown at 12 h, 48 h and after 6 days. For all bar graphs, average and SEM are shown (* = p<0.05, ** = p<0.01, and *** = p<0.001). See also Figures S3 and S4.

