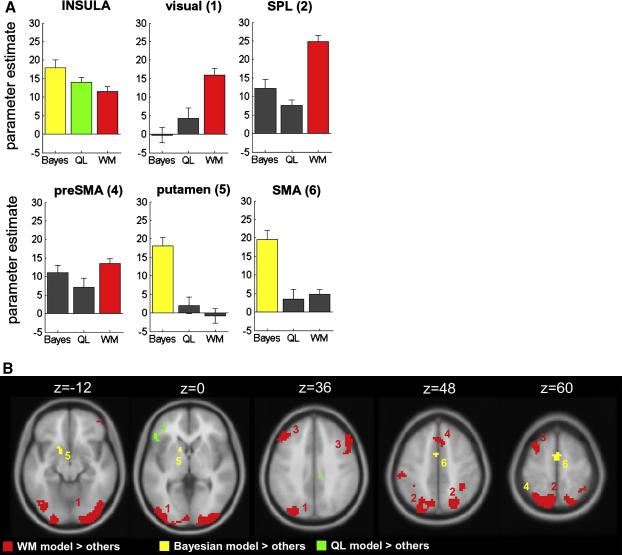
Figure 5.
A. Mean parameter estimates for the correlation with decision entropy predicted by the Bayesian (left panel), Q-learning (middle panel) and working memory (right panel) models, averaged over voxels falling within independent regions of interest. Bars are coloured when parameter estimates are significantly greater than zero at a threshold of p < 0.001. Numbers in the titles correspond to clusters shown in B. B. Voxels that correlate with decision entropy for the Bayesian model alone (yellow), the QL model alone (green) and the WM model alone (red), rendered onto axial slices of a template brain. Voxels were deemed to respond to one model alone if the voxel was positive-going for decision entropy, and the relevant t-value was greater than that for the other two models by at least 3.29 (p < 0.001). Numbers refer to brain regions referred to in the text: 1, extrastriate visual regions; 2, superior parietal lobule; 3, dorsolateral prefrontal cortex; 4, pre-SMA; 5, striatum; 6, SMA.

