

Abstract
Stable isotope labeling may provide a novel method for tracking stem cells once they have been injected into a human or animal host. Here we present a simple pilot study to determine the potential for using ToF-SIMS to detect and localize 15N labeled cells in tissue biopsies for use in cell therapy studies. For this pilot study, 3T3 fibroblasts were grown in normal media and in two different media containing 15N labeled amino acids. Samples containing a mixture of 15N labeled and unlabeled cells were prepared, fixed and dried for analysis and were then imaged using a bunched Bi3+ primary ion source. The cells containing 15N labeled amino acids could be readily distinguished using nitrogen containing peaks which have been previously associated with the labeled amino acids. Contrast was sufficient to allow easy identification of labeled cells in both sparsely and densely plated cultures. Multivariate analysis showed that the image contrast could be improved by including peaks originating from characteristic fragments of the labeled amino acids as well as lower mass NH4+ and CH4N+ peaks. Additional work is being pursued to determine and improve the longevity of the label.
Introduction
Stem cell therapy offers promise for the treatment of a wide variety of degenerative diseases including: heart disease, liver disease, rheumatoid arthritis, type I diabetes, muscular dystrophy, Parkinson’s disease and spinal cord injury. In order to implement effective cell therapies, researchers and medical professionals need to efficiently and effectively deliver cells to the correct tissues and control their growth and differentiation in those tissues. Methods to track injected cells in vivo over a period of days to weeks are badly needed to study the efficiency of cell delivery, mechanisms of stem cell homing, and to determine stem cell fate. However, many of the established techniques used for tracking cells in animal models are ill-suited for use in humans. Thus standard immunohistochemical methods employed for xenotransplantation studies are unavailable for allogenic or autologous grafts. Direct labeling with fluorophores, halogenated nucleotide analogs or nanoparticles is subject to concerns of toxicity, immunogenicity and label drift. In vivo imaging methods do not generally provide cellular resolution. Further SPECT and PET reporters pose challenges of complex radiochemical synthesis, and radiation dose; and gene reporter strategies bring concerns of immunogenicity and use of viral transfection agents1, 2.
On the other hand, stable isotopes have been used safely to label and trace biomolecules in humans for over half a century, since the pioneering work of Schoenheimer and Rittenberg3-5. The use of SIMS microscopy to image cells in culture and in tissue has been shown by several groups 6-9 and the intracellular detection of 15N labeled molecules demonstrated. 7, 10 Recently Lechene and coworkers have demonstrated the analysis and imaging of 15N compounds in cells in culture, in tissue, and in organisms using the Nano-SIMS™ (Cameca) 11-14. There are, however, severe limitations to the use of the Nano-SIMS™ in cell tracking studies, including complex sample preparation requirements, low throughput, the inability to image large areas and the severely limited availability of instruments. In this paper, we present a simple in vitro pilot study designed to explore the feasibility of using imaging ToF-SIMS for detecting and localizing stable isotope labeled cells with the ultimate goal to detect labeled cells in biopsied tissue samples. Although static ToF-SIMS has both lower spatial resolution and mass resolution than the Nano-SIMS™, Belu et al15 have demonstrated the feasibility of using ToF-SIMS to measure patterned 15N labeled proteins, suggesting that ToF-SIMS may be suitable for the tracking of stable isotope labeled cells. The advantages ToF-SIMS offers in terms of sample preparation, sample throughput, parallel mass detection and wider instrument availability may make it preferable for cell tracking studies. The goals of this research were to assess the potential for using a modern conventional ToF-SIMS instrument with a Bismuth LMIG for identifying stable isotope labeled cells as well as to determine suitable methods for cell labeling, SIMS analysis and data reduction.
Methods
Cell Preparation
Two sets of samples were prepared, differing primarily in the labeled amino acids included in the growth media. For the first culture (set 1), NIH/3T3 fibroblasts (ATCC # CRL-1658) were cultured for 27 to 29 days in either “normal media” (DMEM (Invitrogen), supplemented with: 10% fetal bovine serum, 4 mM L-glutamine, 100 μg/ml penicillin, 100 μg/ml streptomycin, 0.25 μg/ml amphotericin B, 1 mM sodium pyruvate) or ‘heavy media 1’ which consisted of SILAC-DMEM (Thermo-Fisher/Pierce), supplemented with: 10% dialyzed fetal bovine serum (Thermo-Fisher), 100 U/ml penicillin, 100 μg/ml streptomycin, 0.25 μg/ml amphotericin B, 1 mM sodium pyruvate, 15N-L-lysine (0.798 mM, Cambridge Isotope Labs # NLM-631-0), 15N-L-arginine (0.398 mM, CIL # NLM-395-0) . For the second culture (set 2), fibroblasts were cultured for 3 days in either normal media as described above or “heavy media 2” which consisted of normal DMEM (Invitrogen) supplemented with 4 mM 15N-L-glycine (Cambridge Isotope Labs # NLM-202-1), 1 mM Na pyruvate, 100 μg/ml penicillin, 100 μg/ml streptomycin, and 10% fetal bovine serum. For both sets, we refer to cells grown in normal media as “unlabeled” and those grown in heavy media as “labeled”.
After the specified culture period, cells were plated onto glass cover slips and allowed to attach and spread for 24 hours. Samples were prepared containing either 100% 15N labeled cells (set 1A), a 1 to 2 mixture of labeled and unlabeled cells (set 1B) or a 1 to 1 mixture of labeled and unlabeled cells (set 1C and set 2). Mixed cell samples were incubated in normal media during the attachment period. Cells in set 1A and set 1B were densely plated and formed a continuous cell sheet whereas samples sets 1C and set 2 were sparsely plated. Cells on these samples were well separated and glass substrate was visible between the cells.
Following cell attachment, the samples were rinsed with phosphate buffered saline (PBS), fixed with 4% formaldehyde (in PBS), rinsed again with PBS and finally rinsed with de-ionized H2O. The samples were then dehydrated in a graded series of ethanol: H2O, at 50, 75 and 100% for 5 min. each. The ethanol was aspirated and the samples were allowed to dry at ambient conditions in a fume hood.
ToF-SIMS Analysis
The samples were analyzed at ambient temperature in an ION-TOF 5 instrument using a 20 keV Bi3+ primary ion source. Images were collected in bunched mode which provided a spatial resolution of ~2 μm and a mass resolution > 5000 m/Δm.
The raw data files were saved and the data were analyzed using software developed in-house. Images from 973 selected peaks covering the mass range from 12 to 600 were chosen for detailed analysis. This hyperspectral image data set was then reduced using Maximum Autocorrelation Factors (MAF), a multivariate technique which has proven effective for analysis of ToF-SIMS images16, 17. These multivariate analysis results were compared with ion images from selected peaks.
Results
Analysis of the images with MAF highlighted seven 15N labeled ions and their seven 14N counterparts that showed strong contrast between the labeled and unlabeled cells. These peaks associated with the 15N label are listed in Table 1. The 14N analogs of these peaks (also listed in Table 1) have been previously associated with specific amino acids 18 as indicated in the table. The 15N ion peaks associated with lysine and arginine are consistent with the culture media used as were the lower mass peaks that arise from all amino acids. A 15N labeled peak indicative of the non-essential amino acid serine was also observed although no 15N labeled serine was added to the media. This observation is consistent with normal amino acid catabolism and synthesis within the cell. Although these peaks are clearly identifiable in the spectra taken from samples in Set 1A, where all cells were grown in heavy media, only the NH4+ peak is cleanly resolved at baseline from other ions with the same nominal mass. The overlap with other species becomes increasingly severe at higher masses.
Table 1.
Sample Identification
| 15 N Label | all labeled confluent | labeled & unlabeled, confluent | labeled & unlabeled, sparse |
|---|---|---|---|
| argenine & lysine | Set 1A | Set 1B | Set 1C |
| glycine | Set 2 |
Figure 1 shows images from typical regions on samples from set 1C. Correlative light microscopy (data not shown), showed a sparse layer of cells, all of which can be readily observed using the sum of 14N peaks shown in Table 2. The 15N labeled cells can be clearly distinguishable from their unlabeled neighbors using only the CH415N+ ion (figure 1, upper right) however better contrast is achieved using either sum of 15N labeled peaks from Table 1 or MAF. Similar results were observed for samples from set 1B.
Figure 1.
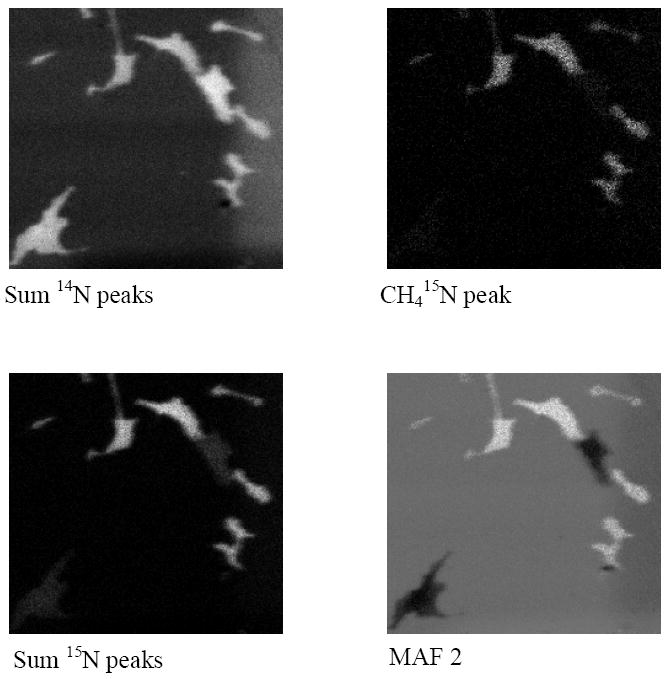
200 × 200 μm ion images of a region from Set 1C. The image from the CH415N+ ion peak is shown at the top right. Top left shows the image for the sum of 14N peaks shown in Table 1 and bottom left shows the image for the sum of the corresponding 15N peaks. The image at the bottom right was calculated using MAF of the 973 peak image stack.
Table 2.
Key ion peaks associated with 15N label in Set 1
| 15N peak | exact mass | 14N peak | exact mass | Amino Acid |
|---|---|---|---|---|
| 15NH4+ | 19.031 | 14NH4+ | 18.034 | All |
| CH415N+ | 31.032 | CH414N+ | 30.034 | All |
| CH314N15N+ | 44.026 | CH314N2+ | 43.029 | arg |
| CH315N2+ | 45.024 | CH314N2+ | 43.029 | arg |
| C2H615NO+ | 61.042 | C2H614NO+ | 60.045 | ser |
| C2H714N15N2+ | 75.058 | C2H714N3+ | 73.064 | arg |
| C5H1015N+ | 85.078 | C5H1014N+ | 84.081 | lys |
| C4H1014N15N2+ | 102.082 | C4H1014N3+ | 100.088 | arg |
The ratio of counts from 15N ion species to counts from 14N ion species for labeled and unlabeled cells in these samples is given in Table 3. Images were segmented using MAF of the 973 peak image stack and a mixture model16, 19 to identify pixels in labeled and unlabeled cells. The numbers presented are averages for 3 to 5 200 × 200 μm regions in each set. The incorporation of the 15N label in set 1A is surprisingly high considering that only 2 of the 20 amino acids were labeled with 15N in the heavy media. The ratio of 15N species to 14N species is highest for the C2H6NO+ serine peak and the C2H7N3+ arginine peak because these peaks arise more exclusively from the labeled amino acids and are better resolved from neighboring peaks. The ratio is lower for the other lysine and arginine peaks most likely because of greater overlap with neighboring ion peaks. The 15N/14N ratio in the labeled cells averages 63% lower than 1B samples and 75% lower in set 1C samples than was observed on the samples containing only labeled cells (set 1A). Although further investigation of this is needed, the lower amount of the label in the mixed samples may be because the cells were allowed to metabolize in normal media for 24 hours. It is also interesting that the 15N/14N ratio in the unlabeled cells observed in sample 1B and 1C is significantly higher than would be expected from natural abundance (0.0037) and higher than the ratio observed in unlabeled cells from sample 2. It seems possible that there may have been some exchange of 15N between the labeled and unlabeled cells during the incubation period.
Table 3.
Ratio of 15N/14N peaks for key ions
| species | amino acid | set 1A labeled | set 1B labeled | set 1B unlabeled | set 1C labeled | set 1C unlabeled | set 2 labeled | set 2 unlabeled |
|---|---|---|---|---|---|---|---|---|
| NH4+ | all | 0.65±0.04 | 0.24±0.03 | 0.009±0.001 | 0.15±0.02 | 0.013±0.001 | 0.016±0.003 | 0.0058±0.0001 |
| CH4N+ | all | 0.25±0.01 | 0.14±0.01 | 0.012±0.0007 | 0.087 ±0.01 | 0.0132±0.001 | 0.054±0.01 | 0.0081±0.0001 |
| * CH3N2+ | arg | 2.12±0.13 | 0.80±0.09 | 0.12±0.05 | 0.51±0.06 | 0.14±0.03 | 0.035±0.003 | 0.028±0.001 |
| C2H6NO+ | ser | 3.76±0.12 | 0.89±0.12 | 0.045±0.009 | 0.58±0.08 | 0.051±0.008 | 0.047±0.006 | 0.0304±0.001 |
| C2H7N3+ | arg | 4.63±0.18 | 0.79±0.11 | 0.064±0.002 | 0.51±0.07 | 0.085 ±0.02 | 0.053±0.008 | 0.052±0.006 |
| C5H10N+ | lys | 1.20±0.05 | 0.63±0.04 | 0.21±0.006 | 0.44±0.03 | 0.24 ±0.05 | 0.20±0.01 | 0.21±0.002 |
| C4H10N3+ | arg | 0.61±0.12 | 0.26±0.02 | 0.15±0.007 | 0.21±0.02 | 0.18 ±0.03 | 0.15±0.01 | 0.15±0.001 |
this ratio uses the sum of the CH314N15N and CH315N2 intensities since both will arise from the 15N labeled arginine.
Table 2 also gives the 15N/14N ratios for cells in set 2. These cells have incorporated far less 15N, likely because only one heavy amino acid (glycine) was included in the media, the incubation time was much shorter, and the media had not been depleted of 14N glycine. Additionally, glycine has no characteristic ion peaks larger than CH4N+. In this sample, only the NH4+ ion, the CH4N+ glycine ion and C2H6NO+ serine ion show significantly higher levels of 15N in the labeled cells and the 15N/14N ratio of these peaks averages only 20% of the levels observed in sets 1B and 1C. Even using multivariate analysis we were unable to identify any additional peaks that showed clear differences between the labeled and unlabeled cells. Despite these drawbacks, labeled and unlabeled cells could still be distinguished in the ion images. Figure 2 shows ion images from a region on a sample from set 2. The labeled cells can be readily distinguished in the CH415N+ glycine image despite the lower levels of the label. Unlike the samples in set 1, using multiple peaks and MAF analysis did not significantly improve the contrast between the labeled and unlabeled cells because of the very simple fragmentation pattern for glycine.
Figure 2.
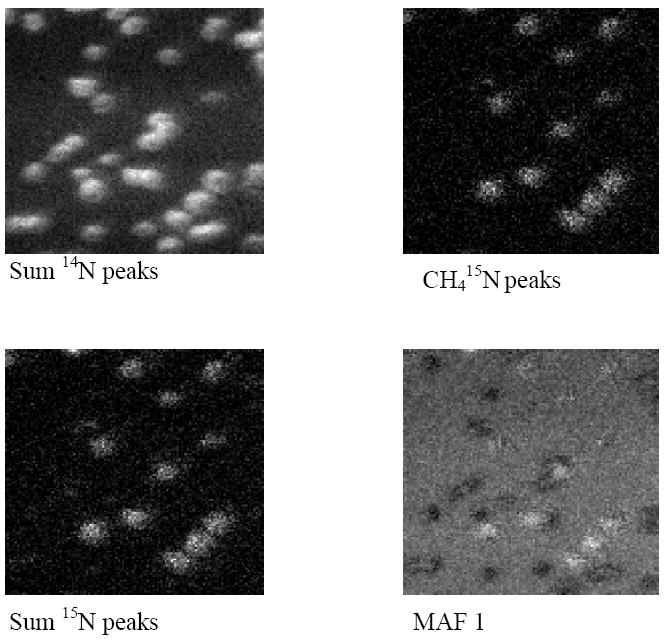
200 × 200 μm ion images of a region from Set 2. The image from the CH415N+ ion peak is shown at the top right. Bottom left shows the image for the sum of the 3 identified 15N peaks and top left shows the image for the sum of the corresponding 14N peaks. The image at the bottom right was calculated using MAF of the 973 peak image stack.
Discussion and Conclusions
Both sets of 15N labeled cells used in this study could be readily distinguished from unlabeled cells using the positive ToF-SIMS images, as is evident in both the images and tabulated data we have presented. Sample preparation was simple and would be appropriate for future tissue samples. Better image contrast was obtained when cells were grown in media containing 15N labeled arginine and lysine than when cells were grown in 15N labeled glycine. This was due in part to the fact that arginine and lysine have both more characteristic ions and more specific characteristic ions than does glycine. Multivariate analysis was useful for identifying peaks that differed significantly between labeled and unlabeled cells and helped improve contrast between the cells. A significant drop in the amount of label was observed when the cells were incubated for 24 hours in normal media. This raises the issue of label longevity; however, clear identification of the more weakly labeled cells in set 2 suggests the labeled cells will still be identifiable after further depletion of the 15N label. Further studies are needed to determine how long the cells will remain detectable with ToF-SIMS after they are removed from the heavy media. Additional ways of labeling the cells, including other amino acids and 15N labeled nucleotides, will be investigated to maximize retention of the label once they have been injected into a host.
Overall, it was observed that the mass and spatial resolution available with ToF-SIMS were adequate for detecting and localizing 15N labeled cells. Parallel detection of all ions, when combined with multivariate analysis, improved contrast between labeled and unlabeled cells. The technique does not require complex sample preparation and shows promise for use in analysis of cell cultures, tissue biopsies and cell tracking experiments. Further study in this area is clearly warranted.
Acknowledgments
Many thanks to Dr. Jeremy Brison, who assisted with the ToF-SIMS analysis.
Generous support for this work was received from NIH grants EB-002027 and HL-64387
References
- 1.Lau JF, Anderson SA, Adler E, Frank JA. Imaging approaches for the study of cell-based cardiac therapies. Nat Rev Cardiol. 7(2):97–105. doi: 10.1038/nrcardio.2009.227. [DOI] [PMC free article] [PubMed] [Google Scholar]
- 2.Wei H, Ooi TH, Tan G, Lim SY, Qian L, Wong P, Shim W. Cell delivery and tracking in post-myocardial infarction cardiac stem cell therapy: an introduction for clinical researchers. Heart Fail Rev. 15(1):1–14. doi: 10.1007/s10741-009-9134-1. [DOI] [PubMed] [Google Scholar]
- 3.Rittenberg D, Keston A, Rosebury F, Schoenheimer R. Studies in Protein Metabolism II. The Determination of Nitrogen Isotopes in Organic Compounds. Journal of Biologic Chemistry. 1939;127:291–299. [Google Scholar]
- 4.Sprinson D, Rittenberg D. The Rate of Interaction of the Amino Acids of the Diet with the Tissue Proteins. Journal of Biologic Chemistry. 1949;180:715–726. [PubMed] [Google Scholar]
- 5.Young VR, Ajami A. The Rudolf Schoenheimer Centenary Lecture. Isotopes in nutrition research. Proc Nutr Soc. 1999;58(1):15–32. doi: 10.1079/pns19990004. [DOI] [PubMed] [Google Scholar]
- 6.Breitenstein D, Rommel CE, Mollers R, Wegener J, Hagenhoff B. The chemical composition of animal cells and their intracellular compartments reconstructed from 3D mass spectrometry. Angew Chem Int Ed Engl. 2007;46(28):5332–5. doi: 10.1002/anie.200604468. [DOI] [PubMed] [Google Scholar]
- 7.Hindie E, Coulomb B, Beaupain R, Galle P. Mapping the cellular distribution of labelled molecules by SIMS microscopy. Biol Cell. 1992;74(1):81–8. doi: 10.1016/0248-4900(92)90011-o. [DOI] [PubMed] [Google Scholar]
- 8.Pacholski ML, Winograd N. Imaging with mass spectrometry. Chem Rev. 1999;99(10):2977–3006. doi: 10.1021/cr980137w. [DOI] [PubMed] [Google Scholar]
- 9.Fletcher JS, Lockyer NP, Vickerman JC. Developments in molecular SIMS depth profiling and 3D imaging of biological systems using polyatomic primary ions. Mass Spectrom Rev. doi: 10.1002/mas. [DOI] [PubMed] [Google Scholar]
- 10.Grignon N, Halpern S, Fragu P. 14N and 15N imaging by SIMS Microscopy in soybean leaves. Biol Cell. 1992;74:143–146. [Google Scholar]
- 11.Lechene C, Hillion F, McMahon G, Benson D, Kleinfeld AM, Kampf JP, Distel D, Luyten Y, Bonventre J, Hentschel D, Park KM, Ito S, Schwartz M, Benichou G, Slodzian G. High-resolution quantitative imaging of mammalian and bacterial cells using stable isotope mass spectrometry. J Biol. 2006;5(6):20. doi: 10.1186/jbiol42. [DOI] [PMC free article] [PubMed] [Google Scholar]
- 12.Lechene CP, Luyten Y, McMahon G, Distel DL. Quantitative imaging of nitrogen fixation by individual bacteria within animal cells. Science. 2007;317(5844):1563–6. doi: 10.1126/science.1145557. [DOI] [PubMed] [Google Scholar]
- 13.McMahon G, Glassner B, Lechene C. Quantitative imaging of cells with multi2 isotope imaging mass spectrometry (MIMS) -Nanoautography with stable isotope tracers. Applied Surface Science. 2006;252:6895–6906. [Google Scholar]
- 14.Peteranderl R, Lechene C. Measure of carbon and nitrogen stable isotope ratios in cultured cells. J Am Soc Mass Spectrom. 2004;15(4):478–85. doi: 10.1016/j.jasms.2003.11.019. [DOI] [PubMed] [Google Scholar]
- 15.Belu AM, Yang Z, Aslami R, Chilkoti A. Enhanced TOF-SIMS imaging of a micropatterned protein by stable isotope protein labeling. Anal Chem. 2001;73(2):143–50. doi: 10.1021/ac000771l. [DOI] [PubMed] [Google Scholar]
- 16.Tyler BJ. Multivariate statistical image processing for molecular specific imaging in organic and bio-systems. Applied Surface Science. 2006;252(19):6875–6882. [Google Scholar]
- 17.Tyler BJ, Rayal G, Castner DG. Multivariate analysis strategies for processing ToF-SIMS images of biomaterials. Biomaterials. 2007;28(15):2412–2423. doi: 10.1016/j.biomaterials.2007.02.002. [DOI] [PMC free article] [PubMed] [Google Scholar]
- 18.Lhoest JB, Wagner MS, Tidwell CD, Castner DG. Characterization of adsorbed protein films by time of flight secondary ion mass spectrometry. J Biomed Mater Res. 2001;57(3):432–40. doi: 10.1002/1097-4636(20011205)57:3<432::aid-jbm1186>3.0.co;2-g. [DOI] [PubMed] [Google Scholar]
- 19.Willse A, Tyler B. Poisson and multinomial mixture models for multivariate SIMS image segmentation. Anal Chem. 2002;74(24):6314–22. doi: 10.1021/ac025561i. [DOI] [PubMed] [Google Scholar]