Abstract
Objectives
The purpose of this study was to evaluate the changes of left stellate ganglionic nerve activity (SGNA) and left thoracic vagal nerve activity (VNA) after acute myocardial infarction (MI).
Background
Whether MI results in remodeling of extracardiac nerve activity remains unclear.
Methods
We implanted radiotransmitters to record the SGNA, VNA, and electrocardiogram in 9 ambulatory dogs. After baseline monitoring, MI was created by 1-h balloon occlusion of the coronary arteries. The dogs were then continuously monitored for 2 months. Both stellate ganglia were stained for growth-associated protein 43 and synaptophysin. The stellate ganglia from 5 normal dogs were used as control.
Results
MI increased 24-h integrated SGNA from 7.44 ± 7.19 Ln(Vs)/day at baseline to 8.09 ± 7.75 Ln(Vs)/day after the MI (p < 0.05). The 24-h integrated VNA before and after the MI was 5.29 ± 5.04 Ln(Vs)/day and 5.58 ± 5.15 Ln(Vs)/day, respectively (p < 0.05). A significant 24-h circadian variation was noted for the SGNA (p < 0.05) but not the VNA. The SGNA/VNA ratio also showed significant circadian variation. The nerve densities from the left SG were 63,218 ± 34,719 μm2/mm2 and 20,623 ± 4,926 μm2/mm2 for growth-associated protein 43 (p < 0.05) and were 32,116 ± 8,190 μm2/mm2 and 16,326 ± 4,679 μm2/mm2 for synaptophysin (p < 0.05) in MI and control groups, respectively. The right SG also showed increased nerve density after MI (p < 0.05).
Conclusions
MI results in persistent increase in the synaptic density of bilateral stellate ganglia and is associated with increased SGNA and VNA. There is a circadian variation of the SGNA/VNA ratio. These data indicate significant remodeling of the extracardiac autonomic nerve activity and structures after MI.
Keywords: acute myocardial infarction, autonomic nervous system, nerve recordings
Acute myocardial infarction (MI) results in neural remodeling, including nerve sprouting and sympathetic hyperinnervation of the myocardium (1,2). Neural remodeling, along with the structural and electrophysiologic remodeling of the myocardium, may form the conceptual framework for the understanding the pathophysiology of an MI (3). Zhou et al. (4) studied the mechanisms of cardiac nerve sprouting after MI created by coronary artery ligation or intracoronary balloon occlusion. The authors found a significantly increased cardiac nerve density along with increased messenger ribonucleic acid levels of the nerve growth factor and growth-associated protein 43 (GAP43) in the left stellate ganglion (LSG). The authors hypothesized that retrograde axonal transport of the nerve growth factor from infarcted myocardium to the LSG underlies the mechanism of nerve sprouting in the myocardium. A pathophysiologic implication of this hypothesis is that MI may induce LSG nerve sprouting, leading to increased sympathetic outflow. To test this hypothesis, we developed a method for continuous recording of the stellate ganglionic nerve activity (SGNA) and vagal nerve activity (VNA) in ambulatory dogs (5,6). We found that the SGNA and VNA are both important in the arrhythmogenesis in dogs with pacing-induced heart failure and paroxysmal atrial fibrillation (7,8). Based on the results of those studies, we hypothesize that MI induces not only anatomic remodeling but also electrical remodeling of the extracardiac nerve structures such as the stellate ganglion (SG) and vagal nerve. These remodeling processes may result in a persistent elevation of the SGNA and VNA in the post-MI period. The purpose of the present study was to perform nerve recordings in ambulatory dogs to test this hypothesis.
Methods
The study was approved by the Institutional Animal Care and Use Committee and conforms to the American Heart Association guidelines. Two-year-old male mongrel dogs (~30 kg) were conditioned for at least 3 weeks. Nine dogs (experimental group) underwent sterile surgery for Data Science International D70-EEE transmitter implantation (Data Science International, St. Paul, Minnesota). One pair of bipolar recording electrode each was implanted under the fascia of the LSG and the left thoracic vagus nerve located above the aortic arch. A third pair of the electrodes was placed in the subcutaneous space of chest wall, with 1 electrode in the left anterior and 1 in the right posterior chest wall to simulate the orientation of electrocardiographic lead 1. After 2 weeks of recovery, simultaneous recordings of all channels were obtained continuously for 7 days. The dogs then underwent a second surgery to create MI. Left heart catheterization was performed using a 7-F Judkins left 2.5 guiding catheter for the left coronary cannulation and a 6-F pigtail catheter for left ventriculography. A 3,000-U intravenous bolus of unfractionated heparin was given at the beginning of the procedure. Amiodarone (150 mg) was administered intravenously before the balloon inflation, followed by a continuous infusion at 150 mg/h until the end of the balloon inflation. The balloon was inflated for 1 h to occlude the left anterior descending coronary artery just below the first diagonal branch in 6 dogs and the left circumflex artery below the second obtuse marginal branch in 3 dogs (Online Figs. S1A and S1B). During balloon inflation, ST-segment elevation was noted on the surface electrocardiogram (Online Figs. S1C and S1D). The left circumflex artery was chosen if there were technical difficulties in cannulating the left anterior descending artery. Left ventriculography was performed immediately before the creation of MI and was repeated just before euthanasia. Blood for cardiac troponin I was drawn at baseline and 24 h after MI. The dogs were allowed to recover for 2 months during which time continuous ambulatory recordings were made. The dogs were then euthanized. The SG and heart were removed for histologic study. Control SG and heart muscle were obtained from 5 normal dogs.
Analysis of neural activity
High-pass (50 Hz) filtering was used to reduce the electrocardiographic signals from the LSG recording channel, and wavelet filtering was used to eliminate the electrocardiographic signals from the vagus nerve recording channel. The majority of signals recorded from the LSG are low-amplitude burst discharge activity (6,7). The nerve activity was integrated over 100 ms and multiplied by the sampling time. The sum of the integrated nerve activity over 24 h is the total nerve activity for that day. The hourly integrated nerve activity was used to analyze the circadian variation. High-amplitude spike discharge activity (6,7) was quantified manually. Integrated nerve activity was used to quantify both SGNA and VNA.
Heart rate variability
Heart rate variability (HRV) was measured by SD of normal to normal R-R interval (SDNN). We selected 27 consecutive QRS complexes in the first 5 min of each hour for each dog to measure the SDNN. The SDNN was measured from 1 day (24 h) at baseline and 1 day in the seventh week after MI using custom software.
Immunohistochemistry
Bilateral SGs and the left ventricular muscle near the site of the balloon occlusion were harvested for immunostaining. The SG was stained for GAP43 (dilution 1:150, Millipore Corp., Billerica, Massachusetts) and synaptophysin (SYN) (dilution 1:150, Dako North America, Inc., Carpinteria, California). The left ventricular myocardium was stained for GAP43 and tyrosine hydroxylase (dilution 1:150, Accurate Chemical & Scientific Corp., Westbury, New York). Tissue specimens from MI and normal control dogs were stained simultaneously. All immunoreactivity was quantified using computerized morphometry (4). Immunoreactivity was expressed as the total area of positive staining per square millimeter (μm2/mm2). We selected 1 stained slide from each dog for ganglion cell size measurements. The slides were selected because there are abundant intact and well-stained ganglion cell bodies. The size of the ganglion cells with complete margins were then measured manually using Image-Pro Plus 6.3 (MediaCybernetics, Bethesda, Maryland).
Statistical analysis
The results were presented as the mean ± SD. For the SDNN, the data were presented as the median and interquartile range (25th to 75th percentiles) because of their nonlinear distribution. The total SGNA or VNA before and after MI were compared with a t test, which was done after logarithmic transformation. The values of the integrated nerve activity were presented by geometric means. A general linear model repeated measure was performed by simple contrast with a baseline reference to determine the significance of an increment of SGNA or VNA at different time points compared with baseline. Cosinor tests were used to determine the significance of the circadian variation. A paired t test was used to compare the troponin and ejection fraction at baseline and after MI. For histologic studies, an independent t test was used to compare the means between the MI group and the control group.
Results
The baseline cardiac troponin I level was <0.2 ng/ml in all animals. The cardiac troponin I level increased to 88.5 ± 80.5 ng/ml (range, 13.5 to 164 ng/ml) at 24 h after MI (p = 0.003). The ejection fraction was 67.2 ± 16.9% before MI and 51.6 ± 17.6% at 2 months after MI (p = 0.17).
SGNA after acute MI
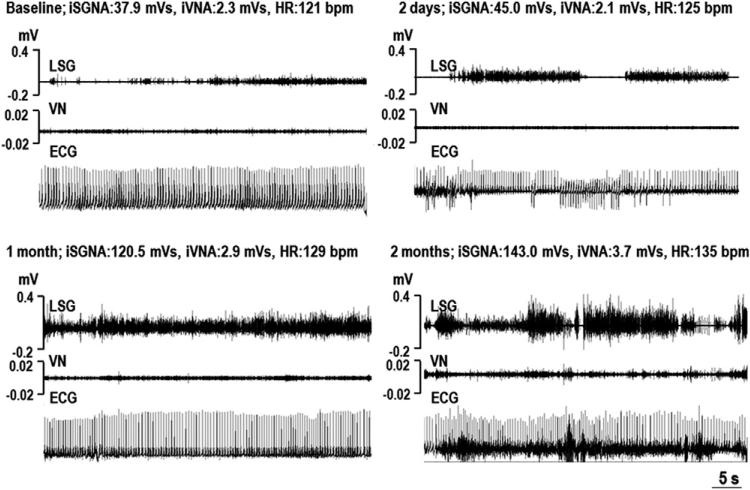
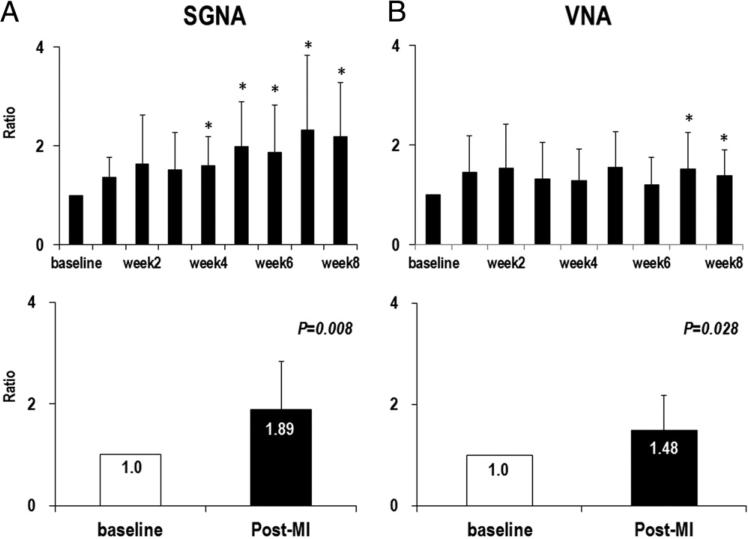
The majority of SGNA is low-amplitude burst discharge activity (Fig. 1). The frequency of the high-amplitude spike discharges increased from 7.7 ± 8.5 episodes/day at baseline to 19.7 ± 12.1 episodes/day after MI (p = 0.028). As shown in Figure 1, we found progressively increased amplitude of SGNA after the MI. We calculated one 24-h integrated SGNA of the baseline and of each week after MI for up to 8 weeks in each dog. The baseline 24-h integrated SGNA, averaged from all 9 study dogs, was 7.44 ± 7.19 Ln(Vs)/day. The 24-h integrated SGNA after MI, averaged from all 8 time points of all dogs, was 8.09 ± 7.75 Ln(Vs)/day (p = 0.012). Because there was great variation in the baseline SGNA among dogs, we used the ratio, which was calculated by the 24-h integrated SGNA of each week after MI divided by the 24-h integrated SGNA at baseline to study the time course of SGNA after MI. SGNA was increased at the fourth week after MI and stayed significantly higher than the baseline up to 8 weeks after MI. Overall SGNA after MI was increased 1.89 ± 0.95-fold over that of baseline (p = 0.008) (Fig. 2A).
Figure 1. Examples of SGNA and VNA After MI.
Each panel shows the simultaneous recordings of the stellate ganglion nerve activity (SGNA), vagal nerve activity (VNA), and subcutaneous electrocardiogram (ECG) at around 11:00 am. The SGNA and VNA increased with increasing time from myocardial infarction (MI). bpm = beats per minute; HR = average heart rate; iSGNA = integrated stellate ganglion nerve activity over 1 min; iVNA = integrated vagal nerve activity over 1 min; LSG = left stellate ganglion; VN = vagal nerve.
Figure 2. SGNA and VNA Ratio.
(A, B, top) The serial changes in the ratio of integrated SGNA and VNA at different times after MI. (A, B, bottom) The comparison of baseline and after MI, which reveals significant increase in nerve activity after MI in both SGNA and VNA. (*p < 0.05 compared with baseline). Abbreviations as in Figure 1.
SGNA after MI retained circadian variation
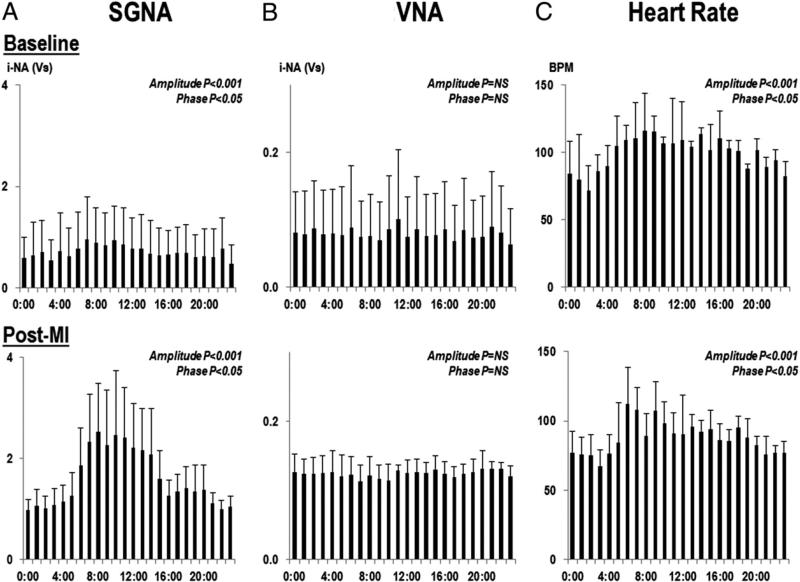
SGNA of each dog consistently showed circadian variation in all 8 weeks after MI. We chose 1 day per week from baseline to the eighth week after MI and averaged all post-MI 1-h integrated nerve activity from 9 study dogs for each hour. As shown in Figure 3A, SGNA after MI was higher than baseline throughout the entire day, but the increased SGNA was mainly observed during daytime (Fig. 4A). The heart rate showed significant circadian variation (amplitude, p < 0.001; phase, p < 0.05) (Fig. 3C). There was significant correlation with heart rate and SGNA (r = 0.547, p < 0.001). The PR intervals were 102.5 ± 14.7 ms with SGNA and 111.7 ± 8.0 ms without SGNA (p = 0.056) at baseline, and were 101.7 ± 4.1 ms with SGNA and 117.1 ± 10.5 ms without SGNA (p = 0.026) after MI. There was no significant correlation between the PR interval and SGNA (p = 0.750).
Figure 3. Nerve Activity and Heart Rate.
The circadian changes in 1-h integrated nerve activity (i-NA) of SGNA (A) and VNA (B) for an entire day at baseline and after MI. The circadian pattern of the SGNA was maintained after MI, but VNA did not exhibit a circadian pattern. (C) Significant circadian variation in heart rate. BPM = beats per min; other abbreviations as in Figures 1 and 2.
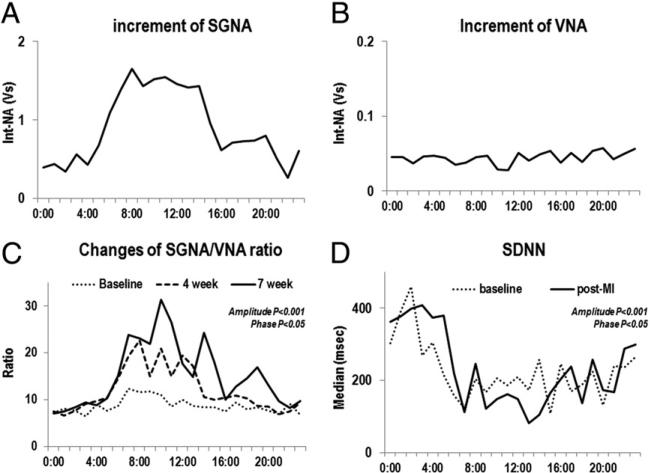
Figure 4. Increase in SGNA and VNA After MI.
(A and B) Increase in integrated SGNA and VNA after MI. There was a significant increase of SGNA in the morning to midday (A) but no change in the VNA (B). The increase in the SGNA/VNA ratio 4 and 7 weeks after MI showed significant circadian variation (C). SD of normal to normal R-R interval (SDNN) also showed significant circadian variation (D), correlating with the SGNA/VNA ratio. Int-NA = integrated nerve activity; other abbreviations as in Figures 1 and 2.
The SGNA/VNA ratio showed significant circadian variation at baseline and post-MI (Fig. 4C). The SGNA/VNA ratio was significantly increased after MI (p < 0.05). The magnitude of increase 24-h showed significant circadian variation (amplitude, p < 0.001; phase, p < 0.05), with maximum augmentation of SGNA/VNA ratio in the daytime. We averaged the SDNN from all dogs for each time segment. The SDNN at baseline (amplitude, p < 0.001; phase, p = NS) and post-MI (amplitude, p < 0.001; phase, p < 0.05) showed significant circadian variation (Fig. 4D). The magnitude of SDNN reduction after MI showed significant circadian variation (amplitude, p = 0.0036; phase, p = NS) and correlated with an increase in SGNA/VNA ratio (Table 1).
Table 1.
Circadian Variation of SGNA/VNA Ratio and SDNN During a 24-h Period
| SGNA/VNA Ratio* |
SDNN† |
||||
|---|---|---|---|---|---|
| Time | Baseline | 4 Weeks | 7 Weeks | Baseline | 7 Weeks |
| 12 am | 7.18 ± 2.0 | 7.51 ± 3.2 | 7.04 ± 1.3 | 303 (152-433) | 363 (222-407) |
| 1 am | 8.06 ± 2.2 | 6.59 ± 2.5 | 7.47 ± 2.1 | 391 (249-465) | 377 (193-453) |
| 2 am | 7.68 ± 2.0 | 7.71 ± 2.1 | 8.42 ± 2.8 | 460 (265-500) | 400 (348-582) |
| 3 am | 6.52 ± 1.6 | 9.17 ± 3.4 | 9.44 ± 3.0 | 269 (156-583) | 409 (284-446) |
| 4 am | 8.97 ± 2.9 | 9.69 ± 5.1 | 8.83 ± 2.8 | 305 (248-421) | 374 (218-462) |
| 5 am | 7.69 ± 2.8 | 10.50 ± 3.4 | 10.37 ± 5.6 | 216 (105-356) | 379 (297-515) |
| 6 am | 8.70 ± 3.1 | 14.58 ± 10.5 | 15.20 ± 9.5 | 158 (114-326) | 220 (147-395) |
| 7 am | 2.36 ± 4.8 | 19.34 ± 8.5 | 23.83 ± 10.0 | 123 (103-191) | 113 (91-239) |
| 8 am | 11.65 ± 4.5 | 22.66 ± 10.2 | 23.08 ± 12.0 | 203 (151-281) | 245 (168-349) |
| 9 am | 11.79 ± 3.6 | 15.00 ± 8.5 | 21.97 ± 10.3 | 168 (125-250) | 122 (92-363) |
| 10 am | 11.05 ± 8.1 | 20.88 ± 10.6 | 31.36 ± 12.1 | 206 (104-314) | 149 (112-238) |
| 11 am | 8.57 ± 3.9 | 15.09 ± 5.6 | 26.50 ± 13.5 | 187 (99-421) | 161 (65-269) |
| 12 pm | 10.05 ± 3.8 | 19.38 ± 8.5 | 17.75 ± 8.0 | 209 (100-418) | 148 (76-306) |
| 1 pm | 8.70 ± 2.5 | 17.25 ± 6.9 | 14.93 ± 8.6 | 174 (137-225) | 82 (60-213) |
| 2 pm | 8.47 ± 3.4 | 10.63 ± 8.0 | 24.34 ± 22.2 | 258 (136-360) | 105 (66-148) |
| 3 pm | 8.44 ± 2.6 | 10.05 ± 5.4 | 17.91 ± 16.1 | 108 (57-173) | 166 (136-332) |
| 4 pm | 7.45 ± 2.3 | 10.40 ± 4.2 | 10.06 ± 4.5 | 246 (116-298) | 203 (91-366) |
| 5 pm | 9.38 ± 2.9 | 10.97 ± 3.4 | 12.81 ± 4.8 | 170 (96-241) | 237 (207-336) |
| 6 pm | 7.96 ± 3.0 | 10.39 ± 3.2 | 14.62 ± 3.6 | 188 (118-332) | 137 (96-311) |
| 7 pm | 8.40 ± 4.5 | 8.75 ± 3.7 | 16.92 ± 11.7 | 224 (148-291) | 257 (169-328) |
| 8 pm | 7.63 ± 1.9 | 8.51 ± 2.1 | 13.05 ± 6.1 | 132 (70-272) | 173 (96-316) |
| 9 pm | 6.87 ± 1.6 | 6.90 ± 1.6 | 9.72 ± 3.8 | 241 (183-329) | 168 (93-345) |
| 10 pm | 9.11 ± 3.6 | 7.48 ± 1.8 | 8.29 ± 1.9 | 236 (218-271) | 287 (212-365) |
| 11 pm | 6.80 ± 1.4 | 9.43 ± 2.9 | 9.74 ± 2.5 | 265 (122-405) | 299 (226-363) |
Values are mean ± SD or median (25th to 75th percentiles).
p < 0.05 when 4 and 7 weeks after MI were compared with baseline.
p < 0.001. The difference of SDDN between baseline and 7 weeks shows a significant circadian pattern.
SDNN = SD of normal to normal R-R interval; SGNA = stellate ganglionic nerve activity; VNA = vagal nerve activity.
Sustained ventricular tachycardia in acute MI was not related to SGNA
Sustained ventricular tachycardia (VT), defined as VT lasting >30 s with a heart rate >100 beats/min, was observed only in the first 2 days (34.3 ± 15.3 h) after MI in 7 study dogs. There were no recurrences of VT afterward. The latency between the balloon occlusion and the onset of VT was 7.2 ± 2.13 h. We randomly selected 500 episodes of sustained VT within 2 days after MI for manual analysis to determine the relationship between the SGNA and sustained VT. The majority of sustained VT (66.5%) within 2 days after acute MI (the phase 1 VT) (2) was not preceded within 20 s by either low-amplitude burst discharge activity or high-amplitude spike discharges.
VNA after MI
VNA was significantly increased in the seventh and eighth weeks after MI. The 24-h VNA at the baseline and after MI was 5.29 ± 5.04 Ln(Vs)/day and 5.58 ± 5.15 Ln(Vs)/day, respectively, which represents a 1.48 ± 0.69-fold increase compared with baseline (p = 0.028) (Fig. 2B). There was no circadian variation in VNA at baseline or after MI (Figs. 3B and 4B).
Neural remodeling of the left ventricle after MI
The density of the GAP43 immunoreactive nerve fibers of the left ventricle was 2,391.8 ± 1,231.5 μm2/mm2 in the control group and 4,761.2 ± 1,523.2 μm2/mm2 in the MI group (p = 0.007). The density of the tyrosine hydroxylase–positive nerve fiber was 1,005.9 ± 423.6 μm2/mm2 in the control group and 1,780.6 ± 687.9 μm2/mm2 in the MI group (p = 0.045).
Neural remodeling of the SG after MI
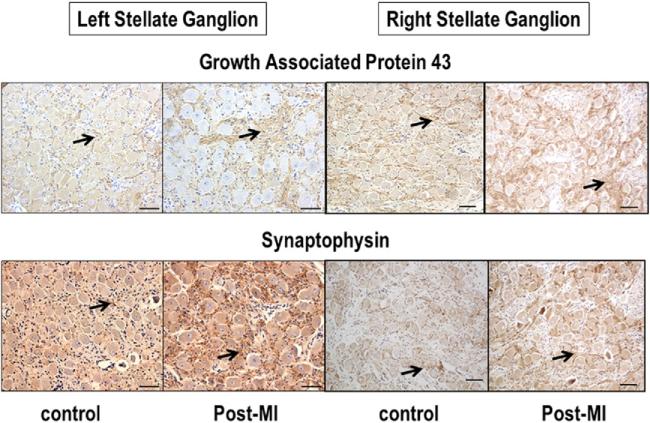
Figure 5 shows typical examples of GAP43 and SYN staining in the left and right SGs. There is increased immunoreactivity of GAP43 and SYN after MI than before MI. For all dogs studied, the density of GAP43 immunoreactivity in the LSG was 63,217.7 ± 34,719.4 μm2/mm2 in the MI group and 20,623.0 ± 4,925.6 μm2/mm2 in the control group (p = 0.01), respectively. The density of SYN immunoreactivity was 32,115.7 ± 8,190 μm2/mm2and 16,326 ± 4,678.5 μm2/mm2, respectively (p = 0.029). The density of GAP43 immunoreactivity in the right SG was 143,649.1 ± 24,681.5 μm2/mm2 in the MI group and 75,594.9 ± 25,092.4 μm2/mm2 in the control group (p < 0.001). The density of SYN immunoreactivity was 59,269.6 ± 13,537.1 μm2/mm2and 31,278.8 ± 5,575.8 μm2/mm2, respectively (p = 0.019).
Figure 5. Immunohistochemical Staining of the Stellate Ganglia.
Immunohistochemical staining with growth-associated protein 43 (upper panel) and synaptophysin (lower panel) of left and right stellate ganglia in control dogs and in dogs with myocardial infarction (MI). Arrows point to positive stains (brown). The figures show that growth-associated protein 43–positive and synaptophysin-positive nerve structures are both more prominent in myocardial infarction dogs than in control dogs. The line segments are 50 μm long.
In addition to the increased synaptic density in the LSG, the sizes of ganglionic neurons in the MI group were significantly larger than the neurons of the control group (734.5 ± 269.6 μm2 vs. 1,123.2 ± 358.0 μm2, p = 0.000) (Online Fig. S2). In addition to the increased synaptogenesis, a small percentage of the ganglion cells in the SGs showed prominent cytoplasmic vacuoles that lead to effacement of the neuronal architecture (Online Fig. S3). Vacuoles were found in 1 control dog and 3 MI dogs (p = 0.55).
Discussion
Continuous recording of LSG nerve activity showed a long-lasting, progressive increase in SGNA up to 2 months after MI. The increased SGNA retained circadian distribution, and the time period of highest SGNA and sympathovagal ratio correlated with a decrease in HRV. Histologic study demonstrated increased synaptogenesis in the SGs 2 months after MI. This study provided both physiologic and histologic evidence of neural remodeling of the SGs after MI.
Post-MI neural remodeling of the LSG
It is known that MI increases the release of catecholamine, which may be causally related to the development of cardiac arrhythmia (9,10). Increased catecholamine results in an increased resting heart rate, which is independently associated with mortality (11). Histologic examination of diseased human and animal hearts shows that nerve sprouting and myocardial hyperinnervation may occur after MI and that the presence of heterogeneous myocardial innervation is associated with the occurrence of ventricular arrhythmias and sudden death (1,2). Subsequent studies show that the mRNA and protein levels of nerve growth factor and GAP43 in the left SG is also increased after MI in a canine model (4). However, the latter study did not include histologic analyses of the LSG or nerve recordings. Jardine et al. (12) reported increased sympathetic nerve activity between 9 and 11 am in conscious sheep by recording through exteriorized wires, but no vagal nerve recordings were made in that study. In the present study, we found that there is significant SG neural remodeling after MI induced by 1-h coronary occlusion, and that the neural remodeling is associated with increased SGNA and sympathovagal ratio. Thus, in addition to changes of myocardial innervation patterns, significant remodeling of the SG and persistent elevation of sympathetic outflow may also play a role in determining the outcomes of patients with MI. The increased sympathetic outflow may be a new therapeutic target for the prevention of complications associated with MI.
Sympathovagal imbalance after MI
Without direct recordings, previous studies of sympathovagal balance rely on the mathematical analyses of the HRV (13). This approach, while interesting, is not without flaws. One of the most important problems of HRV analyses is that the HRV is dependent not only on autonomic tone but also on the presence of normal sinus node that can properly and quickly respond to the changes of the autonomic nerve activity. In conditions associated with sinus node dysfunction, such as heart failure, the HRV correlates poorly with the autonomic nerve activity (14). Therefore, there are major limitations in constructing sympathovagal balance with HRV analyses (15). In the present study, we recorded sympathetic nerve activity and VNA directly and showed increased sympathetic and parasympathetic nerve activity, and augmented sympathovagal imbalance in day time. These findings for the first time document an imbalance between the sympathetic nerve activity and VNA after MI. We also documented that anatomic remodeling of the SGs persisted for at least 2 months. The increased nerve sprouting and synaptogenesis of the SGs increased the neuronal excitability (6). Sustained sympathetic hyperactivity may facilitate vagal discharges. However, because SGNA, but not VNA, has a circadian variation pattern, a prominent sympathovagal imbalance was noted only during the daytime. The prominent sympathovagal imbalance in this study was consistent with a significant change in the SDNN during the daytime.
SGNA and VT during acute ischemia
No arrhythmias were noted immediately after MI. The use of amiodarone and the effect of anesthesia may play roles in the absence of early arrhythmias. The amiodarone may work through the direct electrophysiologic and beta-blocking effects on altering the infarct size. However, VT did occur later during recovery from MI. The possible mechanisms include abnormal automaticity from surviving Purkinje cells (16), which can be affected by the sympathetic nerve activity or subacute imbalance between sympathetic innervation in the infarcted area and in the normal territory. However, in contrast to VT that occurs during the subacute and chronic phases of MI (6), the sustained VT episodes in this study were not preceded by sympathetic nerve activity and did not cause sudden death in any of the dogs studied. These findings are consistent with those of recent report that multiple nonarrhythmic mechanisms may be involved in death in the early post-MI period (17) and that implantation of an implantable cardioverter-defibrillator after acute MI failed to reduce the total mortality (18).
Study limitations
A limitation of the study is that none of these dogs developed ventricular arrhythmias during the chronic phase of MI, making it difficult to assess the importance of autonomic nerve discharges in ventricular arrhythmogenesis. A second limitation is that the MI was created with 1-h balloon occlusion, followed by reperfusion. It is possible that MI created by other methods may result in a different magnitude of neural remodeling.
Conclusions
This study demonstrated a concomitant increase in the sympathetic and parasympathetic activity accompanied by anatomic remodeling of the SGs after MI. However, the increase was greater in the sympathetic arm than the vagal arm, resulting in increased sympathovagal imbalance after MI. The ventricular arrhythmias that occurred in the early post-MI period were not triggered by the increased SGNA.
Supplementary Material
Acknowledgments
The authors thank Juan Song, PHD, Lei Lin, and Jian Tan for their assistance.
This study was supported in part by National Institutes of Health grants P01 HL78931, R01 HL78932, R01 71140, and R21 HL106554; a Nihon Kohden/St. Jude Medical Electrophysiology fellowship (Dr. M. Maruyama); a Cryptic Masons Medical Research Foundation Endowment (Dr. K. March); and a Medtronic-Zipes Endowment (Dr. P. Chen). Dr. P. Chen has received equipment donations from Medtronic Inc., St. Jude Inc., Crycath Inc., and Cyberonics Inc.
Abbreviations and Acronyms
- GAP
growth-associated protein
- HRV
heart rate variability
- LSG
left stellate ganglion
- MI
myocardial infarction
- SG
stellate ganglion
- SGNA
stellate ganglionic nerve activity
- SDNN
SD of normal to normal R-R interval
- SYN
synaptophysin
- VNA
vagal nerve activity
- VT
ventricular tachycardia
Footnotes
APPENDIX
For supplemental figures, please see the online version of this article.
All other authors have reported that they have no relationships relevant to the contents of this paper to disclose.
REFERENCES
- 1.Cao JM, Chen LS, KenKnight BH, et al. Nerve sprouting and sudden cardiac death. Circ Res. 2000;86:816–21. doi: 10.1161/01.res.86.7.816. [DOI] [PubMed] [Google Scholar]
- 2.Cao JM, Fishbein MC, Han JB, et al. Relationship between regional cardiac hyperinnervation and ventricular arrhythmia. Circulation. 2000;101:1960–9. doi: 10.1161/01.cir.101.16.1960. [DOI] [PubMed] [Google Scholar]
- 3.Verrier RL, Kwaku KF. Frayed nerves in myocardial infarction: the importance of rewiring. Circ Res. 2004;95:5–6. doi: 10.1161/01.RES.0000136343.06161.ec. [DOI] [PubMed] [Google Scholar]
- 4.Zhou S, Chen LS, Miyauchi Y, et al. Mechanisms of cardiac nerve sprouting after myocardial infarction in dogs. Circ Res. 2004;95:76–83. doi: 10.1161/01.RES.0000133678.22968.e3. [DOI] [PubMed] [Google Scholar]
- 5.Jung BC, Dave AS, Tan AY, et al. Circadian variations of stellate ganglion nerve activity in ambulatory dogs. Heart Rhythm. 2006;3:78–85. doi: 10.1016/j.hrthm.2005.09.016. [DOI] [PubMed] [Google Scholar]
- 6.Zhou S, Jung BC, Tan AY, et al. Spontaneous stellate ganglion nerve activity and ventricular arrhythmia in a canine model of sudden death. Heart Rhythm. 2008;5:131–9. doi: 10.1016/j.hrthm.2007.09.007. [DOI] [PubMed] [Google Scholar]
- 7.Ogawa M, Zhou S, Tan AY, et al. Left stellate ganglion and vagal nerve activity and cardiac arrhythmias in ambulatory dogs with pacing-induced congestive heart failure. J Am Coll Cardiol. 2007;50:335–43. doi: 10.1016/j.jacc.2007.03.045. [DOI] [PubMed] [Google Scholar]
- 8.Tan AY, Zhou S, Ogawa M, et al. Neural mechanisms of paroxysmal atrial fibrillation and paroxysmal atrial tachycardia in ambulatory canines. Circulation. 2008;118:916–25. doi: 10.1161/CIRCULATIONAHA.108.776203. [DOI] [PMC free article] [PubMed] [Google Scholar]
- 9.Videbaek J, Christensen NJ, Sterndorff B. Serial determination of plasma catecholamines in myocardial infarction. Circulation. 1972;46:846–55. doi: 10.1161/01.cir.46.5.846. [DOI] [PubMed] [Google Scholar]
- 10.McDonald L, Baker C, Bray C, McDonald A, Restieaux N. Plasma-catecholamines after cardiac infarction. Lancet. 1969;2:1021–3. doi: 10.1016/s0140-6736(69)90637-0. [DOI] [PubMed] [Google Scholar]
- 11.Hjalmarson A, Gilpin EA, Kjekshus J, et al. Influence of heart rate on mortality after acute myocardial infarction. Am J Cardiol. 1990;65:547–53. doi: 10.1016/0002-9149(90)91029-6. [DOI] [PubMed] [Google Scholar]
- 12.Jardine DL, Charles CJ, Ashton RK, et al. Increased cardiac sympathetic nerve activity following acute myocardial infarction in a sheep model. J Physiol. 2005;565:325–33. doi: 10.1113/jphysiol.2004.082198. [DOI] [PMC free article] [PubMed] [Google Scholar]
- 13.Pagani M, Lombardi F, Guzzetti S, et al. Power spectral analysis of heart rate and arterial pressure variabilities as a marker of sympatho-vagal interaction in man and conscious dog. Circ Res. 1986;59:178–93. doi: 10.1161/01.res.59.2.178. [DOI] [PubMed] [Google Scholar]
- 14.Piccirillo G, Magri D, Ogawa M, et al. Autonomic nervous system activity measured directly and QT interval variability in normal and pacing-induced tachycardia heart failure dogs. J Am Coll Cardiol. 2009;54:840–50. doi: 10.1016/j.jacc.2009.06.008. [DOI] [PMC free article] [PubMed] [Google Scholar]
- 15.Eckberg DL. Sympathovagal balance: a critical appraisal. Circulation. 1997;96:3224–32. doi: 10.1161/01.cir.96.9.3224. [DOI] [PubMed] [Google Scholar]
- 16.Friedman PL, Stewart JR, Fenoglio JJ, Jr., Wit AL. Survival of subendocardial Purkinje fibers after extensive myocardial infarction in dogs. Circ Res. 1973;33:597–611. doi: 10.1161/01.res.33.5.597. [DOI] [PubMed] [Google Scholar]
- 17.Dorian P, Hohnloser SH, Thorpe KE, et al. Mechanisms underlying the lack of effect of implantable cardioverter-defibrillator therapy on mortality in high-risk patients with recent myocardial infarction: insights from the Defibrillation in Acute Myocardial Infarction Trial (DINAMIT). Circulation. 2010;122:2645–52. doi: 10.1161/CIRCULATIONAHA.109.924225. [DOI] [PubMed] [Google Scholar]
- 18.Hohnloser SH, Kuck KH, Dorian P, et al. Prophylactic use of an implantable cardioverter-defibrillator after acute myocardial infarction. N Engl J Med. 2004;351:2481–8. doi: 10.1056/NEJMoa041489. [DOI] [PubMed] [Google Scholar]
Associated Data
This section collects any data citations, data availability statements, or supplementary materials included in this article.


