

Abstract
Scholars who study how social networks affect older adults’ health are often concerned with the prospect of declining social connectedness in late life. This paper shifts the focus to older adults’ tendencies to cultivate new social ties. This process of network growth can improve access to social resources, boost self-esteem, reduce loneliness, and increase physical activity. We therefore examine the link between tie cultivation and health using new longitudinal data from the National Social Life, Health, and Aging Project (NSHAP), which recorded changes in older adults’ confidant network rosters over a period of about five years. Most respondents (81.8%) added at least one new network member during the study period, and most (59.4%) cultivated multiple new confidant relationships. Longitudinal analyses suggest that the addition of new confidants is associated with improvements in functional, self-rated, and psychological health, net of baseline connectedness as well as any network losses that occurred during the same period. Network losses were associated with physical but not psychological well-being. These findings underscore the importance of distinguishing between concurrent processes that underlie social network change in later life, and highlight the need for additional research on the mechanisms by which network change may improve health.
Keywords: Aging, life course, social networks, network change, functional health, self-rated health, depression
With a few important caveats, researchers have generally emphasized the health benefits of having strong, stable social connections (see Berkman, Glass, Brissette, & Seeman, 2000; York Cornwell & Waite, 2009). Expanding on this work, some researchers have begun to consider the implications of network change for health. Social network-related changes involve unique process that cannot be boiled down to static features of social ties or networks, and therefore may have independent effects on health. Some recent work reveals that over-time changes in social connections are linked to health outcomes independently of baseline network-related properties such as size, density, and supportiveness (e.g., Cerhan & Wallace, 1997; Eng, Rimm, Fitzmaurice, & Kawachi, 2002; Giordano & Lindstrom, 2010; Seeman et al., 2011; Thomas, 2011).
The issue of social network change and its potential health effects is especially important in the context of research on aging, as later life can be a time of particular challenges, upheaval, and adaptation with respect to both social connectedness and health. In addition to health decline, life-course transitions like retirement, widowhood, and residential changes can drastically alter a person’s network (Cornwell, 2009; Donnelly & Hinterlong, 2010; Litwin & Stoeckel, 2013; Perry & Pescosolido, 2012; Schafer, 2013). Unfortunately, we know little about the health consequences of changes in social connectedness that may accompany these kinds of transitions. Several lines of research provide clues, however, about the link between changes in related forms of social connectedness and health in later life. First, life-course research sheds light on the effects of common late-life transitions that involve separation from key social roles (especially retirement) and the loss of contacts (especially widowhood). While much of this work connotes loss and isolation, some social-gerontological research has begun to view these as transitions that can spur network growth. This work is informed by continuity and activity theories, which argue that cultivating new social connections is one way that many older adults adapt to later-life challenges and compensate for loss (Atchley, 1989; Donnelly & Hinterlong, 2010; Zettel & Rook, 2004).
Recognizing variation in how older adults deal with late-life transitions, health researchers have begun to consider the implications of both network loss and growth for older adults. This raises the issue of how to measure these network changes. Most research (e.g., Cerhan and Wallace 1997; Eng et al., 2002; Thomas 2011) has operationalized change in social connectedness using summary measures of net change between waves (e.g., network size at time2 minus network size at time1). One limitation of this approach is that it assumes that increases in connectedness have equivalent but opposite effects on health as do decreases in connectedness. A few studies have attempted to correct for this by introducing separate measures for network growth and decline. Seeman et al. (2011), for example, employ two dummy variables to classify individuals who experienced decreases in social engagement over time versus those who experienced increases, where “no change” is the reference category. This approach has the intriguing implication that increases in network connectedness may not simply have the opposite effect of decreases, as the magnitudes of the two associations may differ. A remaining limitation, though, is that this approach still treats these two processes as mutually exclusive, alternative trajectories.
Thus, a gap remains in our understanding of separate processes of network change and how they relate to health. Because people may adjust to network losses by cultivating new ties and mobilizing support, proactively rearrange their networks in anticipation of change, or simply cultivate new relationships to expand their networks, the loss of network members and the addition of new ones may occur simultaneously, in close succession, or entirely independently (e.g., Atchley, 1989; Donnelly & Hinterlong, 2010; Zettel & Rook, 2004). The possibility that processes of network loss and addition can be parallel, sequential, or orthogonal is rarely taken into consideration in the work that has been done on the link between social network change and health in later life.
In this paper, we conceptualize network change as a multidimensional process that involves multiple countervailing processes (Feld, Suitor, & Hoegh, 2007). We theorize several potential mechanisms through which losses and additions of network members may influence different aspects of physical and psychological health. We then examine the extent to which different elements of network change – including social network losses and additions – relate to these health outcomes. We use new longitudinal data on older adults’ egocentric social networks and health that were collected in two waves by the National Social Life, Health, and Aging Project (NSHAP) between 2005/6 and 2010/11. The analyses reveal some surprising trends with respect to the extent of network loss, addition, and turnover, and underscore the importance of treating these as related but unique influences on different dimensions of older adults’ well-being.
SOCIAL NETWORK CHANGE AND HEALTH
Most research on the link between networks and health implicitly treats networks as static or stable structures whose health-relevant properties can be captured at a given moment in time. This approach is not entirely unjustified, as some research documents considerable stability in social networks over time (e.g., Wellman, Wong, Tindall, & Nazer, 1997). But scholars also recognize that change is endemic in social networks, and a growing number have begun to urge researchers to remain mindful of the dynamic nature of networks (Snijders & Doreian, 2010). Several important processes – ranging from the loss of network members to the addition of new ones, and how these experiences are sequenced – constitute a class of network phenomena that are rarely studied or utilized in empirical analyses of important individual outcomes. Health researchers have also begun to recognize that these processes may represent new, poorly understood mechanisms that directly affect health (e.g., Giordano & Lindstrom, 2010; Seeman et al., 2011; Thomas, 2011).
Network Loss
The idea that shifts in the social environment can exert powerful independent influences on health is not new. A large body of research on bereavement, for example, is motivated by this concern over the consequences of network loss. The experience of loss triggers a bereavement process, which in turn often evokes stress, depression, and loneliness (see Stroebe, Schut, & Stroebe, 2007). Beyond this, because being socially connected helps individuals maintain a sense of control and mastery as well as access to coping resources during periods of strain (Thoits, 2011), network losses can reduce sense of control and decrease individuals’ abilities to cope with stress (Gerstorf, Röcke, & Lachman, 2010). These things, in turn, have numerous downstream health consequences, due in part to their effects on immune, cardiovascular, and neuroendocrine function (see Uchino, 2006). Stress and psychological distress are also closely associated with elevated allostatic load (e.g., Juster, McEwen, & Lupien, 2009), which relates to internal wear and tear on the body and its organ systems. Even mild chronic stress can increase the risk of long-term physical disability and infection (Rai et al., 2011).
Relatedly, the loss of network members can result in a reshuffling of social influences and norms. This, in turn, can give rise to anomia, or a sense of normlessness or detachment from society (see Deflem, 1989). This sense of normlessness can increase stress and suppress immune function (Graham, Christian, & Kiecolt-Glaser, 2006), which can have negative health consequences. Anomia may derive not only from the loss of preexisting social routines with a given lost network member, but also from disruption in the larger social network in which that person was embedded. This is especially true with respect to someone who was well connected to one’s other network members, perhaps having connected them to each other and played a key role in organizing their supportive efforts all along. The loss of such a person can throw a network into disarray. Likewise, it can leave one in a situation in which one’s network members do not get along or are effectively segregated, which is an element of Durkheimian anomie (Bearman, 1991).
Expanding on this, the loss of a key network member can disrupt the internal functions of one’s network. Over time, network members develop routines that facilitate the coordination of social support and informal social control. As a result of these routines, people may develop a stable cognitive map of the resources they can secure from their networks in different situations (e.g., see Pescosolido, 1992). The loss of a network member can therefore negatively affect health not only due to psychological bereavement, but also because, structurally speaking, loss disrupts established routines of contact and communication among one’s contacts. Again, the loss of a particularly central network member, such as one’s spouse, can be particularly damaging to a network’s capacity to provide coordinated social support (Kalmijn, 2003). Losses may thus create uncertainty about to whom one can turn in times of need.
Network Growth
Perhaps due to the assumption that aging begets isolation, considerably less attention has been paid to the health implications of adding new relationships in late life. Adding new ties to a network can benefit health for a number of reasons (e.g., Eng et al., 2002). For one, the addition of new ties can increase the number, range, and quality of social resources that are available to a person. To the extent that one’s previous stock of resources had been inadequate or problematic in some way, then, a change may solve preexisting problems and improve well-being. The addition of new network members also provides an opportunity to expand one’s network beyond existing boundaries. This can increase network heterogeneity and thereby increase the variety of resources and influences to which one has access. Expanding on the arguments in the previous section, on the other hand, network growth may disrupt preexisting network processes and/or introduce heterogeneous norms and influences that have negative psychological consequences.
It is also important to recognize that the process of successfully cultivating new relationships can be invigorating both physically and psychologically speaking. Developing new ties can boost self-esteem, sense of belonging, and reassurance as to one’s social desirability – which is especially important following destabilizing life-course events that may leave one feeling isolated (Kemp, Ball, Hollingsworth, & Perkins, 2012; Li, 2007; Street & Burge, 2012). As discussed above, self-esteem is closely tied to immune function, and can therefore have downstream health consequences. Also relevant is the fact that the cultivation of new network ties can occur in a number of ways. Sometimes people develop close relationships with people they did not know before, but sometimes they turn to old acquaintances that they had not been in touch with for a long time and rekindle dormant ties (Bidart & Lavenu, 2005; Sasovova, Mehra, Borgatti, & Schippers, 2010). In some cases, then, the process of cultivating confidant relationships can be rewarding in that it allows one to revisit once-familiar interaction patterns and customs. This has been a major theme in recent work on the benefits of building online social networks with existing and previous social contacts, for example (e.g., Raacke & Bonds-Raacke, 2008).
Other potential health benefits of cultivating new social relationships may derive from the physical and cognitive activity and stimulation of bodily systems that this process entails (Morrow-Howell & Gehlert, 2012). Building new relationships – especially outside of one’s existing social circles – often requires an increase in physical activity, as well as greater deliberative cognition associated with becoming socially engaged in new places and trying out new activities (e.g., see Tan et al, 2009). In this respect, benefits of adding new network members stem not only from immediate social or psychological effects, but also from the activation of cardiovascular and muscular systems, immune function, and similar exercise-related processes. We will return to this idea below in our discussion of network change in late life.
The Relationship between Social Network Losses and Additions
While different forms of change within networks may occur independently of each other, they do often occur in tandem. Research on network tie replacement and substitution – often discussed in terms of longer-term “network evolution” or “network turnover” processes – implies that losses from and additions to networks are commonly related to each other (e.g., Doreian & Stokman, 1997; Perry, 2006; Wellman et al., 1997; Zettel & Rook, 2004). Experiencing network losses may directly prompt a person to cultivate new relationships or to rekindle dormant ones, for example. Likewise, people often proactively withdraw from existing relationships in order to form other, more beneficial relationships. This is to be expected in cases where one’s contacts are disadvantageous, dangerous (e.g., abusive), stressful, or perhaps difficult to maintain for some reason. Thus, the combination of processes of network loss and cultivation may be consequential in and of itself. For example, the extent to which network loss is detrimental may depend on whether there are concomitant additions that change one’s network in some way.
Unfortunately, much of the research that examines social network change in the context of health employs summary measures of network change. The most common measures reflect overall net change in network size between waves or some summary measure of overall change in social integration (e.g., net change in social engagement between two time points). Such measures are indeed very useful as indices of change in the social environment. But they are not sufficient to capture the countervailing social processes through which social network ties are lost and added during a period of time (see Feld et al., 2007). If a measure of overall change in network size between two time periods equals zero, for example, this could reflect either complete network stability during that time period or (more likely, as we argue below) complete network turnover. Network turnover and stability are inherently different processes and need to be distinguished from each other. Just as importantly, network losses and additions do not always counterbalance each other. They are inherently different processes that are not simply “opposites” of each other. This is one of the guiding principles of our approach: Network loss and growth are not mirror processes and should not be measured that way. Our analysis is therefore designed to distinguish between and to assess unique contributions of network loss and growth.
NETWORK CHANGE AND HEALTH IN LATER LIFE
The issue of network change is particularly important, we argue, in the context of later life. Scholars have become particularly interested in this period of the life course – a time when health usually declines and the need for social support increases, when network ties are a primary source of sense of belonging, and when life transitions affect network structure (Fiori, Antonucci, & Akiyama, 2008; Litwin & Stoeckel, 2013). Much research on this is motivated by concern over the social implications of transitions like retirement, bereavement, and health decline. A strong connotation of loss therefore permeates most work on the issue of network change in later life.
But there is reason to believe that older adults’ networks are shaped equally by the process of network growth. This expectation derives from research on older adults’ social integration in the face of potentially isolating later-life transitions. Some research has found, for example, that retirement can both reduce network range and access to weak ties and increase connectedness to kin and the community (e.g., Cornwell, Laumann, & Schumm, 2008; van Groenou & van Tilburg, 2012). There is also mixed evidence regarding the aftermath of bereavement, as some scholars have highlighted increased loneliness while others have documented increases in social activity (see Donnelly & Hinterlong, 2010; Zettel & Rook, 2004). The one intractable issue is health decline, which hampers individuals’ efforts to form and maintain social ties, particularly weak ties (e.g., Cerhan & Wallace, 1993; Cornwell, 2009; Schafer, 2013). On the other hand, some scholars argue that network changes that occur in this context are often purposefully engineered by older adults – that their dwindling life spans prompt them to alter their networks by cutting weak ties so they can spend their remaining time in the company of closer social contacts (Charles & Carstensen, 2010).
One process that fuels tie cultivation in later life is adaptation to the loss of social roles and contacts. Continuity and activity theories hold that people grow so accustomed to social roles and activities during their lives that they attempt to maintain them in the midst of later-life transitions (e.g., Atchley, 1989). The loss of social relationships thus sparks efforts by individuals to adapt to and/or compensate by cultivating new social relationships and by becoming more involved in community activities (Donnelly & Hinterlong, 2010; Zettel & Rook, 2004). People who adjust to later-life transitions by remaining socially active tend to be happier and healthier, both because they maintain their access to social resources and because of the physical activity and mental stimulation that comes with social adaptation (Kahana, Kelley-Moore, & Kahana, 2012). Cultivating even weak ties in the wake of bereavement may be more beneficial to older adults than turning inward to one’s closest contacts. Older adults value the weaker ties that they maintain with acquaintances, neighbors, and group members – in part, because these ties help older adults maintain their independence and non-familial connectedness (e.g., see Cornwell & Laumann, 2011). In short, adaptation is an important mechanism through which loss is often translated into concomitant or subsequent additions to social networks in later life.
This body of research reiterates how important it is to consider potentially countervailing processes that affect network size and structure – network loss and addition – in tandem. We are interested in the form network change takes in later life, the incidence of network growth, the relationship between network losses and additions, and how these processes relate to health. We are particularly interested in the prospect that network growth may have health benefits net of the detrimental effects of network loss.
DATA AND ANALYSIS
We use recent data from two waves of the National Social Life, Health, and Aging Project (NSHAP), a nationally representative, population-based panel study funded by the National Institutes of Health. The NSHAP focuses on understanding connections between older adults’ social lives and health. Wave 1 (W1) was conducted in 2005–6 and consisted of in-home interviews with 3,005 community-dwelling older adults between the ages of 57 and 85. The sample was selected using a multi-stage area probability design that oversampled by race/ethnicity, age, and gender. The final response rate for W1 was 75.5%. In 2010–11, the NSHAP conducted a second wave (W2). Of the 3,005 baseline respondents, 744 (24.8%) were lost to some form of attrition. NSHAP’s W2 response rate from among eligible surviving baseline respondents (N = 2,548) is 88.7%. The NSHAP re-interviewed 75.2% of W1 respondents, yielding a panel of 2,261 older adults.
Social Network Change
Network data were collected at both waves. Starting at W1, all respondents were asked to list up to five people with whom they discuss “things that were important to you” during the past year. This procedure tends to elicit strong ties – ties through which social influence and resources are most likely to flow (see Bailey & Marsden, 1999; c. f., Bearman & Parigi, 2004). To assess the importance, intensity, and functions of these “confidant” ties, the NSHAP asked respondents to provide information about the nature of their relationship with each confidant, including type of relationship, frequency of contact, and emotional closeness. The NSHAP also gauged the functional specificity (Perry & Pescosolido, 2010) of network ties by asking respondents how likely they were to talk to each of their confidants about health matters.
Our main interest is in confidant turnover during the study period. Not only were the same network data collected at W2 as at W1, but the NSHAP also devised a CAPI exercise to reveal specific confidant changes between waves among the 2,261 respondents who participated at both W1 and W2. At W2, interviewers first collected each respondent’s confidant roster and preliminary information about respondents’ relationships with confidants as described above. The respondent’s W1 roster was preloaded into the CAPI instrument and was not visible to the respondent while completing this step. After the respondent completed the W2 roster, the CAPI was programmed to display a visual representation linking matches between the W1 and W2 rosters (see Figure 1). The respondent was asked to verify if these computer-programmed matches were correct, and was given the opportunity to correct any mismatches. The W1 roster line corresponding to a given W2 alter was then recorded. (See Perry & Pescosolido [2012] for a similar assessment of egocentric network change.)
Figure 1. Screenshot of a Portion of the CAPI Interface Used by NSHAP Respondents to Match Their W1 Network Members to Their W2 Network Members.
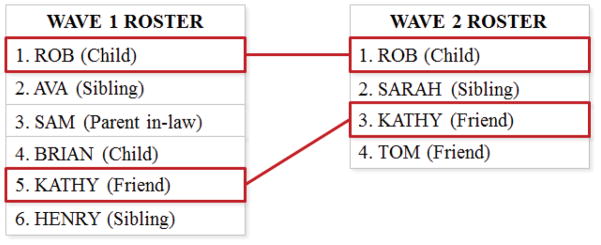
Note: The names that appeared in the original screenshot of the rosters above have been replaced with pseudonyms. The names of and other information concerning respondents’ network members at W1 were preloaded from their original W1 surveys in the CATI system, which was programmed to display a visual representation linking matches between the respondent’s W1 and W2 rosters. Respondents were asked to confirm that any changes in network personnel were depicted correctly. The exercise included names of the up to five confidants who were listed at W1 (Roster A), any spouse/partner whom the respondent did not name first as a confidant (Roster B), and one other “especially close” contact who had not yet been named (Roster C).
Health researchers typically measure network change either in terms of summary changes in the size of respondents’ networks over time (e.g., −1, 0, +1) or in terms of net change in summary measures of social engagement. We measure network change using multiple parameters that capture the number of confidants who were named as confidants at W1 but who were not named as confidants at W2 (confidants “lost”) as well as parameters that reflect the number of confidants who were named at W2 but not named as such at W1 (confidants “added”). To allow for non-linear associations and to ensure that results do not merely reflect differences in the number of confidants named at either W1 or W2, measures are entered into the models using indicators of the specific number of confidants lost or added per respondent. Descriptive statistics of these and other key variables are presented in Table 1.
Table 1.
Descriptions and Weighted Means and Standard Deviations of Key Variables (N = 2,140)a
| Variable | Description | Proportion or mean | s.d. |
|---|---|---|---|
| Functional impairment (W2) | R’s self-rated ability to complete each of 7 activities of daily living on their own at W1. Responses range from “unable to do” (= 1) to “no difficulty” (= 4) (α = .841). Items are averaged together then logged. Range: 0 to 1.386. | .125 | .238 |
| Self-rated health (W2) | R rated his/her own health as “poor” (reference) | .052 | .218 |
| R rated his/her own health as “fair” | .192 | .410 | |
| R rated his/her own health as “good” | .323 | .470 | |
| R rated his/her own health as “very good” | .307 | .454 | |
| R rated his/her own health as “excellent” | .126 | .320 | |
| Depressive symptoms (W2) | Average of R’s standardized responses to 10 ordinal items from the CES-D scale assessing depressive symptoms. Responses range from “rarely or none of the time” (= 0) to “most of the time” (3). Items are averaged together then logged. Range: 0 to 1.329. | .331 | .277 |
| Age | R’s age at baseline (in years, divided by 10). Range: 5.7 to 8.5. | 6.710 | .747 |
| Female | Whether R is female | .522 | .500 |
| Black | Whether R is black | .097 | .369 |
| Hispanic | Whether R is Hispanic | .071 | .304 |
| Education (W1) | R’s had less than a high school education (reference) | .160 | .397 |
| R’s highest level of education is a high school diploma | .253 | .433 | |
| R has a college degree | .319 | .462 | |
| R holds a professional degree | .268 | .431 | |
| Network size at baseline | R named one confidant in their network roster at W1 (reference) | .109 | .297 |
| R named two confidants. | .140 | .368 | |
| R named three confidants. | .185 | .395 | |
| R named four confidants. | .166 | .377 | |
| R named five confidants. | .401 | .484 | |
| Number of confidants lost between W1 and W2 | R did not lose any confidants between waves W1 and W2 (reference) | .216 | .414 |
| R lost one confidant between waves | .262 | .441 | |
| R lost two confidants between waves | .259 | .434 | |
| R lost three confidants between waves | .161 | .367 | |
| R lost four confidants between waves | .079 | .273 | |
| R lost five confidants between waves | .023 | .148 | |
| Number of confidants added between W1 and W2 | R did not add any confidants between waves W1 and W2 (reference) | .174 | .386 |
| R added one confidant between W1 and W2 | .236 | .417 | |
| R added two confidants between waves | .276 | .443 | |
| R added three confidants between waves | .174 | .381 | |
| R added four confidants between waves | .107 | .318 | |
| R added five confidants between waves | .032 | .183 | |
| Kin composition | Proportion of R’s confidants who are kin at W1. Range: 0 to 1. | .674 | .329 |
| Frequency of contact | Average ordinal rating (1 = < once per year, 8 = every day) of how often R interacts with each confidant at W1. Range: 2.6 to 8. | 6.869 | .855 |
| Emotional closeness | Average ordinal rating (1 = “not very close”, 4 = “extremely close”) of how close R is to each confidant at W1. Range: 1 to 4. | 3.174 | .526 |
| Discussion of health matters | Average ordinal rating (1 = “not likely”, 3 = “very likely”) of how likely R is to talk to each confidant about health at W1. Range: 1 to 3. | 2.607 | .458 |
Estimates are weighted using NSHAP W1 person-weights (adjusted for attrition and selection at W2). Estimates are calculated for all respondents who have non-missing data for key variables in the final models for all outcome variables.
We are interested in how these aspects of network change relate to older adults’ health. There are several reasons network losses and additions could be related to health. One has to do with shifts in the composition, function, and structure of a network that occur as its membership changes. Therefore, we also calculate four measures of overall change in (1) average frequency of interaction with confidants, (2) kin composition of the network, (3) frequency of contact with confidants, and (4) likelihood of discussing health/medical matters with them.
Health
We consider associations between aspects of network change and three health measures. First, we examine functional health, one of the greatest stressors in later life. The prevalence of functional impairment has increased in recent years (Crimmins & Beltrán-Sánchez, 2011), partly due to the increasing prevalence of obesity and to greater longevity among those who have chronic diseases. Disability is often measured as the inability to perform the activities that are needed for independent living and personal care, like eating without assistance. We construct an index comprised of seven items (α = .84) that assesses how much difficulty respondents have with these kinds of tasks. This measure is skewed, so it is logged in the analysis. We also examine overall self-rated health, which is reported by respondents as “poor,” “fair,” “good,” “very good,” or “excellent.” This measure is widely recognized as an independent predictor of future health problems and mortality, and is useful for capturing subjective aspects of health that are missed by specific measures like functional impairment (Idler & Benyamini, 1997).
We also consider psychological well-being. Depression is one of the leading causes of disability among older adults (see Rai et al. 2011). Depressive symptoms are measured using a modified Center for Epidemiologic Studies Depression scale (CES-D-ml), which is the average of standardized responses to 10 ordinal items assessing the respondents’ depressive symptomology, such as feeling sad “most of the time” as opposed to less frequently (α = .77). The CES-D-ml scale does not include one measure typically included in the CES-D, which asks respondents how often they feel “lonely.” Leaving this item in the scale would give it a social dimension that is partially captured in other measures of connectedness, such as number of non-partner confidants, and thus would increase endogeneity problems (see York Cornwell & Waite, 2009). Due to heavy skew, the CES-D-ml is logged.
Controls
Several factors co-vary with health, social network change, and network features, including age, gender, race/ethnicity, and education. Age is modeled linearly (and divided by 10 to make the coefficient more meaningful). Life-course factors include baseline marital status and change in marital status between waves, as well as baseline employment status and change in employment status. All models include baseline functional impairment, self-rated health, and depression Because patterns of network change may depend on baseline network structure, we also include controls for baseline network size, kin composition, frequency of contact with confidants, emotional closeness to confidants, and respondents’ likelihood of discussing health matters with them. We also control for frequency of attendance at religious services. Research suggests that survey-based egocentric social network data suffers from interviewer effects on networks size (see Paik & Sanchagrin, 2013). Therefore, we control for (1) the number of confidants named at W1 by other respondents who were interviewed by R’s W1 interviewer, and (2) the number of confidants named at W2 by other respondents who were interviewed by R’s W2 interviewer. These measures help control for biasing effects of interviewers who may have discouraged respondents from naming large numbers of confidants. Finally, because measures of losses and/or additions of network members may co-vary with other aspects of network change, all models control for the aggregate change between W1 and W2 with respect to kin composition, contact frequency, emotional closeness, and health discussion.
Analytic Strategy
Ordinary least squares is appropriate for predicting functional impairment and depressive symptoms. Ordered logit is more appropriate for self-rated health. Because this dependent variable has five possible levels, there are four intercepts associated with the cumulative probabilities (γ1, γ2, γ3, and γ4) of observing progressively higher levels of self-rated health. Most ordered logit models make the assumption that the odds ratio estimates of the independent variable are the same at each intercept (i.e., the “proportional odds” assumption). Our case, however, violates the proportional odds assumption (χ2 [126] = 218.94, p < .001). We therefore use generalized ordered logit (partial proportional odds) models, which allow inconsistent estimates to vary across levels (Williams, 2006).
The first model for each health outcome includes the socio-demographic, life-course, and social network controls. The second model introduces the summary measure of network size change, which is similar to measures of network change that are often used in research on the effects of network change. A comparison of the first and second models will show how considering overall network change alters our interpretation of the influence of baseline network size. The third model replaces this summary measure with the two separate sets of parameters that capture the number of confidants lost and the number added between waves. This step is important for illustrating limitations in interpreting the summary network change measure.
It is not our intention to test a definitive causal model. Two waves are not sufficient to establish causality, especially when employing measures of change in a predictor that are derived from both waves of data. However, the NSHAP data provide an opportunity to assess whether the data are at least consistent with the argument that within-network changes are significantly associated with health net of baseline network features. We are cognizant of the possibility that reverse causation could yield biased estimates and unreliable significance tests. We therefore conduct two supplemental analyses (presented in Appendix Table A3) in which we predict both (1) the number of confidants lost and (2) the number added between waves, using overall changes in the three key health measures as predictors. A significant association between changes in functional limitations, self-rated health, and/or depressive symptoms would support endogeneity concerns. Findings are discussed briefly in the results section.
Appendix Table A3.
Incidence Rate Ratios from Poisson Regression Models Predicting the Number of Confidants Lost and Added between Waves (N = 2,140)
| Predictor | Number lost | Number added |
|---|---|---|
| W1 functional impairment (logged) | 1.114 (.083) | 1.033 (.120) |
| W1 self-rated health (reference = “poor”) | ||
| Fair | .954 (.076) | .953 (.075) |
| Good | .988 (.079) | .997 (.093) |
| Very good | .967 (.088) | .936 (.094) |
| Excellent | .982 (.095) | 1.040 (.104) |
| W1 depressive symptoms (logged) | 1.067 (.080) | 1.030 (.094) |
| Change in (logged) functional impairment | 1.103) (.086) | (.088) (.098) |
| Change in self-rated health | 1.000 (.019) | 1.018 (.026) |
| Change in (logged) depressive symptoms | 1.016 (.053) | .936 (.065) |
| Pseudo R2 b | .469 | .085 |
p < .10
p < .05,
p < .01,
p < .001 (two-sided tests)
Estimates are weighted using NSHAP W1 person-weights (adjusted for attrition and selection at W2).
All models are survey-adjusted and include all of the same covariates and controls that were employed in the analyses presented in Tables 2–4, except for other measures of network change.
Represents the squared correlation between respondents’ observed number of confidants lost/added and the corresponding predicted values.
Attrition and Selection Adjustment
All models take into account the clustering and stratification of NSHAP’s sample design and include NSHAP-supplied weights to account for respondents’ differential probabilities of selection at W1. We also take into account the non-random loss of respondents due to attrition. We begin by creating a variable for each of the 3,005 W1 respondents that indicates whether they were part of the final W2 sample. We predict this indicator using a logit model, with baseline socio-demographic variables, health, and other factors entered as predictors. From this, we derive a predicted probability that each W1 respondent appears in the analysis. We take the inverse of this probability and multiply it by the NSHAP-supplied weight for that person at W1. Using these adjusted weights as the sampling weights in the models give more weight to individuals who were less likely to be in the W2 sample, effectively adjusting estimates toward where they would have been had all W1 respondents made it into the W2 sample (see Austin, 2011; Morgan and Todd, 2008; for recent applications to these data, see Cornwell & Laumann, 2011).
FINDINGS
The respondents in our panel experienced expectable levels of health decline over the five-year period. They reported slightly more functional limitations at W2 than at W1. The average functional limitations scale score (not logged) at W1 was 1.16, compared to 1.21 at W2 (two-sided paired-samples t-test: t= 7.93, p < .001). Whereas 32.3% of the respondents reported having difficulty with at least one activity of daily living at W1, 37.1% reported difficulty with something at W2. There was also modest change in self-rated health. At W1, the average rating on the scale (which ranges from 1 to 5) was 3.26, compared to 3.17 at W2 (t = −6.27, p < .001). Put another way, 24.9% percent of respondents reported being in only fair or poor health at baseline, compared to 28.2% at follow up. Depressive symptoms, however, did not change significantly between waves. The average CES-D-ml scale score (not logged) at W1 was 1.47, compared to 1.46 at W2 (t = −.76, p = .45).
Social Network Change
In the sample analyzed here (N = 2,140), the average number of confidants at W1 was 3.51, compared to 3.77 at W2 (t = −7.77, p < .001). A total of 3,609 W1 confidants were lost between waves, and 4,112 new ones were added. More respondents (37.9%) reported a net expansion of their networks than a net decrease (26.6%). The matrix in Figure 2 shows the frequency of different combinations of losses from and additions to networks over the study period (also see Appendix Figure A1). Regardless of whether respondents’ networks expanded or shrank overall, the vast majority (81.8%) named a confidant at W2 who they had not named at W1. At the same time, 78.0% had named at least one confidant at W1 who was not named again at W2.
Figure 2. Matrix Showing the Number of Respondents Who “Lost” and “Added” Different Numbers of Confidants between Waves 1 and 2.
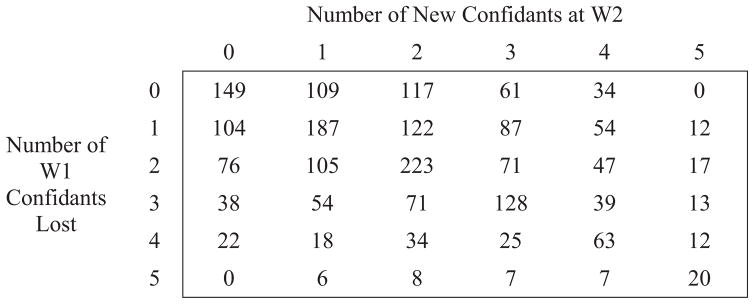
Note: The numbers in the cells are raw, unweighted counts.
Appendix Figure A1. Distribution of the Number of New Network Members Named for the First Time at Wave 2 Given Different Numbers of Wave 1 Network Members Lost.

Note: The horizontal axes are arranged in descending order so that the tall bars (which represent lower values) do not obscure as many of the low bars (which represent higher values).
Figure 2 helps to demonstrate how a summary measure of overall change in network size masks network turnover. Of the 770 respondents who reported no net change in network size between waves (represented in the matrix diagonal), 621 (80.6%) nonetheless reported some change in who their network members are. When respondents lost network members, they tended to add the same number of new ones. Only 11.2% of respondents lost confidants but did not add any, and 15.7% experienced losses that were offset by some (but fewer) new additions. About 15.0% of respondents added but did not lose any confidants, and 22.1% experienced net expansion despite losing some confidants. Only 7.0% of respondents reported complete stability in their networks.
One concern when the NSHAP team devised the network change module was that apparent network “turnover” may be an artifact of the limitations of the five-person network roster cap. Following the roster matching exercise, respondents were asked to provide some information about any W1 confidants who were not named atW2.i These data suggest that only seldom (0.6% of confidant losses) did respondents report that they dropped a confidant because there was “not enough space to list” him/her at W2. The most common reason respondents gave for why they did not name confidants again at W2 (23.4% of all losses) had to do with physical distance – either the respondent or the confidant moved, or it was determined that the confidant lived “too far away” from the respondent. Other common responses included that the confidant died during the study period (17.1%), that they were “still in touch” with the confidant but presumably not on the order they had been at W1 (15.3%), or that they just “drifted apart” (14.8%). These reasons account for more than two-thirds of confidant losses. These and other reasons that were provided (e.g., the respondent retired, there was a “falling out”) suggest that most of the turnover that is reported here is not due to incidental reporting issues.
Social Network Change and Health
We now consider how these network change processes relate to health.
Functional Impairment
Table 2 presents unstandardized coefficients from OLS regression models predicting (logged) functional impairment. Several socio-demographic characteristics are significantly associated with functional impairment. Older adults experienced more functional impairment. Hispanics experienced less functional impairment than non-Hispanics. With respect to network characteristics, having more kin confidants (and increasing kin composition between waves) is associated with greater functional impairment. People who were not working at either W1 or W2 (not shown) had higher levels of functional impairment. Finally, those who had lower self-rated health and/or worse functional health at baseline also reported greater functional impairment.
Table 2.
Unstandardized Coefficients from Regression Models Predicting W2 Funtional Impairment Using Key Measures of Social Network Change (N = 2,142)a
| Predictor | Model 1 | Model 2 | Model 3 |
|---|---|---|---|
| W1 functional impairment (logged) | .678*** (.029) | .678*** (.028) | .680*** (.030) |
| Age (divided by 10) | .024* (.010) | .022* (.010) | .023* (.010) |
| Female | −.001 (.011) | .003 (.010) | .003 (.011) |
| Black | −.004 (.018) | .002 (.017) | .003 (.017) |
| Hispanic | −.053** (.015) | −.053** (.016) | −.052** (.016) |
| Education (reference: < HS) | |||
| High school | −.013 (.018) | −.009 (.018) | −.011 (.018) |
| College degree | −.009 (.017) | −.008 (.017) | −.006 (.017) |
| Professional degree | −.016 (.019) | −.016 (.019) | −.011 (.019) |
| W1 network size (reference = 1) | |||
| Two | .010 (.019) | −.004 (.020) | .001 (.020) |
| Three | .024 (.018) | .007 (.019) | .005 (.020) |
| Four | .032 (.024) | .015 (.026) | .004 (.022) |
| Five | .055** (.019) | .032 (.021) | .016 (.022) |
| W1 kin composition | .040* (.016) | .036* (.016) | .039* (.019) |
| W1 frequency of contact (W1) | .009 (.009) | .006 (.009) | .006 (.009) |
| W1 emotional closeness | −.004 (.013) | −.006 (.013) | −.007 (.013) |
| W1 discussion of health matters | .007 (.015) | .007 (.015) | .009 (.015) |
| Net network change (reference = no change in network size) | |||
| Net loss of four or five confidants | -- | .162* (.071) | -- |
| Loss of three confidants | -- | .030 (.032) | -- |
| Loss of two confidants | -- | .041 (.027) | -- |
| Loss of one confidant | -- | .056** (.016) | -- |
| Net gain of one confidant | -- | −.000 (.015) | -- |
| Net gain of two confidants | -- | .017 (.017) | -- |
| Net gain of three confidants | -- | .017 (.022) | -- |
| Net gain of four or five confidants | -- | −.033 (.040) | -- |
| Confidants lost (reference = zero) | |||
| One | -- | -- | .036* (.016) |
| Two | -- | -- | .035 (.018) |
| Three | -- | -- | .050* (.021) |
| Four | -- | -- | .052* (.022) |
| Five | -- | -- | .137* (.060) |
| Confidants added (reference = zero) | |||
| One | -- | -- | −.022 (.015) |
| Two | -- | -- | −.030 (.018) |
| Three | -- | -- | −.034 (.020) |
| Four | -- | -- | −.047* (.023) |
| Five | -- | -- | −.082* (.037) |
| Constant | −.141 (.117) | −.104 (.114) | −.101 (.124) |
| R2 | .527 | .536 | .532 |
p < .05,
p < .01,
p < .001 (two-sided tests)
Estimates are weighted using NSHAP W1 person-weights (adjusted for attrition and selection at W2).
All models are survey-adjusted and include controls for baseline self-rated health and depression, religious attendance, W1 marital status and change in marital status, W1 employment status and change in employment status, interviewer effects, and change in kin composition, frequency of contact, emotional closeness, and likelihood of discussing health matters.
From Model 1, having a larger social network at baseline increases functional impairment. Model 2 shows what happens when the summary measure of network change is taken into account. In general, declines in network size – as opposed to no change – are associated with increases in functional impairment. Experiencing a net loss of four or five confidants is the most detrimental in terms of functional impairment, while a net loss of one confidant results in a modest but significant increment in functional impairment. Notice that, according to this model, net increases in network size are not significantly associated with functional impairment.
In model 3, losses and additions of confidants are included as separate parameters. Both sets of measures include significant coefficients. Respondents who lost five confidants experienced particularly marked increments in functional impairment. Conversely, respondents who added four or five confidants experienced significant decrements in functional impairment. The addition of four new confidants is associated with a .05 decrement in the (logged) functional impairment score, compared to a .08 decrement in cases where the W2 confidant roster is entirely made up of fresh faces. The measures of losses and additions operate additively and are not conditional on each other. A separate model that includes (1) a count of the number of losses, (2) number of additions, and (3) an interaction between these two measures shows that the interaction is not significant (b = −.13, s.e. = .12). Thus, any benefits of adding new confidants hold regardless of whether a respondent lost confidants between waves, and vice versa.
Because the functional limitations scale is not easily interpretable, we estimated a set of supplemental logit models that predict whether respondents reported having (1) some difficulty with at least one ADL, and (2) some difficulty with multiple ADLs. Results are similar to those presented in Table 2 (see Appendix Table A1). Predicted probabilities of functional impairment – given different combinations of baseline network size, number of confidants lost, and number added – are plotted in Figure 3. The top panel shows predicted probabilities of difficulty with any ADLs. The dashed line shows predicted probabilities in the most typical (modal) scenario where respondents started with four confidants at baseline and lost two by W2. For example, the predicted probability of any impairment among those who added three new confidants was .24, compared to .38 among those who did not add any new confidants – a 60% increase in risk of functional impairment. The solid line shows probabilities assuming that the individual started with three confidants and lost one, and the dotted line shows probabilities for those who started with two confidants and did not lose any. The main relationship to observe in this figure is the overall decline in the risk of functional impairment as the number of confidants added increases. The lower panel shows predicted probabilities of multiple impairments. For those who had four confidants at baseline and who lost two during the study period, the addition of three confidants is associated with a predicted probability of .10 of experiencing multiple impairment, compared to .16 among those who did not add any new confidants – a 57% increase in risk.
Appendix Table A1.
Odds Ratios from Logistic Regression Models Predicting the Number of ADLs with Which Respondents Reported Having at Least Some Difficulty (N = 2,142)
| Predictor | At Least One Problematic ADL | At Least Two Problematic ADLs |
|---|---|---|
| W1 network size (reference = 1) | ||
| Two | 1.116 (.333) | 1.203 (.394) |
| Three | 1.099 (.365) | 1.421 (.539) |
| Four | .899 (.337) | 1.253 (.605) |
| Five | 1.398 (.482) | 2.167 (.865) |
| Confidants lost (reference = zero) | ||
| One | 1.488 (.317) | 1.779* (.441) |
| Two | 1.456 (.403) | 1.295 (.321) |
| Three | 2.082* (.693) | 1.998 (.732) |
| Four | 1.706 (.588) | 1.447 (.509) |
| Five | 3.138* (1.529) | 4.578** (2.351) |
| Confidants added (reference = zero) | ||
| One | .798 (.155) | .810 (.236) |
| Two | .718 (.149) | .631 (.178) |
| Three | .508* (.143) | .594 (.174) |
| Four | .577 (.190) | .416* (.159) |
| Five | .560 (.259) | .555 (.301) |
| Constant | .008 (.013) | .008 (.013) |
| Pseudo R2 | .320 | .320 |
p < .10
p < .05,
p < .01,
p < .001 (two-sided tests)
Estimates are weighted using NSHAP W1 person-weights (adjusted for attrition and selection at W2).
All models are survey-adjusted and include all of the same covariates and controls that were employed in the analysis that is presented in Table 2.
Figure 3. Predicted Probabilities of Different Degrees of Functional Impairment among Older Adults, by the Number of Confidants Added during the Study Period.

Note: The dashed lines represent predicted probabilities when individuals had four confidants at baseline and lost two network members between waves. The solid lines show predicted probabilities for those who had three confidants at baseline and who lost one during the study period. The dotted lines show predicted probabilities for those who had two confidants at baseline and who lost one during the study period. All predicted values are based on the logistic regression models presented in Appendix Table A1, holding all other covariates constant at their mean values.
Self-Rated Health
Table 3 shows odds ratios from the generalized ordered logistic regression analysis of self-rated health. Older adults are less likely to report higher levels of self-rated health. The first model shows that African-Americans are more likely than whites not to have poor health, but subsequent models show that they are also (marginally) less likely to report excellent health. Respondents who have higher SES report better overall health. Those who were not working at either wave or who stopped working between waves were less likely to report better health (not shown). Baseline network measures are not significantly associated with self-rated health.
Table 3.
Odds Ratios from Generalized Ordered Logistic Regression Models Predicting Levels of Self-Rated Health (N = 2,140)a
| Predictor | Odds of Reporting Health as Being at Least:
|
|||
|---|---|---|---|---|
| Fair | Good | Very Good | Excellent | |
| W1 self-rated health (reference = “poor”) | ||||
| Fair | 4.489** (1.821) | 2.008 (.760) | .946 (.477) | 1.683 (.912) |
| Good | 16.087*** (8.854) | 5.888*** (2.174) | 1.661 (.830) | 1.839 (.923) |
| Very good | 22.983*** (12.987) | 19.935*** (7.892) | 7.878*** (3.581) | 5.155*** (2.130) |
| Excellent | 22.371*** (9.229) | 22.371*** (9.229) | 22.371*** (9.229) | 22.371*** (9.229) |
| Age (divided by 10) | 1.322 (.297) | .817* (.067) | .822* (.067) | .934 (.106) |
| Female | 1.253 (.152) | 1.253 (.152) | 1.253 (.152) | 1.253 (.152) |
| Black | 2.323** (.610) | 1.034 (.220) | .807 (.144) | .397 (.207) |
| Hispanic | 3.646** (1.523) | 1.174 (.258) | 1.009 (.209) | .739 (.345) |
| Education (reference: < HS) | ||||
| High school | 2.125* (.645) | 1.625* (.353) | 1.154 (.268) | .824 (.196) |
| College degree | 1.575* (.292) | 1.575* (.292) | 1.575* (.292) | 1.575* (.292) |
| Professional degree | 2.034** (.420) | 2.034** (.420) | 2.034** (.420) | 2.034** (.420) |
| W1 network size (reference = 1) | ||||
| Two | 1.305 (.895) | .617 (.168) | 1.228 (.356) | 1.173 (.431) |
| Three | .862 (.148) | .862 (.148) | .862 (.148) | .862 (.148) |
| Four | .892 (.164) | .892 (.164) | .892 (.164) | .892 (.164) |
| Five | .832 (.139) | .832 (.137) | .832 (.137 | .832 (.137) |
| W1 kin composition | .414* (.146) | .872 (.231) | .689 (.164) | 1.134 (.325) |
| W1 frequency of contact (W1) | 1.005 (.089) | 1.005 (.089) | 1.005 (.089) | 1.005 (.089) |
| W1 emotional closeness | 1.223 (.160) | 1.223 (.160) | 1.223 (.160) | 1.223 (.160) |
| W1 discussion of health matters | .754 (.124) | .754 (.124) | .754 (.124) | .754 (.124) |
| Confidants lost (reference = zero) | ||||
| One | .906 (.162) | .906 (.162) | .906 (.162) | .906 (.162) |
| Two | .381** (.107) | .859 (.188) | .831 (.202) | 1.114 (.296) |
| Three | .804 (.199) | .804 (.199) | .804 (.199) | .804 (.199) |
| Four | 1.323 (1.033) | .508* (.169) | .901 (.311) | 1.178 (.414) |
| Five | .275 (.207) | .767 (.416) | .438 (.208) | 1.362 (.660) |
| Confidants added (reference = zero) | ||||
| One | 1.267 (.178) | 1.267 (.178) | 1.267 (.178) | 1.267 (.178) |
| Two | 1.335* (.181) | 1.335* (.181) | 1.335* (.181) | 1.335* (.181) |
| Three | 1.369 (.233) | 1.369 (.233) | 1.369 (.233) | 1.369 (.233) |
| Four | 1.618* (.380) | 1.618* (.380) | 1.618* (.380) | 1.618* (.380) |
| Five | 1.111 (.413) | 1.111 (.413) | 1.111 (.413) | 1.111 (.413) |
| Pseudo R2 b | .346 | |||
p < .05,
p < .01,
p < .001 (two-sided tests)
Estimates are weighted using NSHAP W1 person-weights (adjusted for attrition and selection at W2).
All models are survey-adjusted and include controls for baseline functional health and depression, religious attendance, W1 marital status and change in marital status, W1 employment status and change in employment status, interviewer effects, and change in kin composition, frequency of contact, emotional closeness, and likelihood of discussing health matters.
Represents the squared correlation between respondents’ observed ordinal self-rated health levels and the value of the category into which respondents have the highest predicted probability of falling to predicted probabilities generated by these models.
Due to space constraints, Table 3 shows a final model that includes separate parameters of numbers of network members lost and added. We also conducted an analysis that is parallel to Model 2 in Table 2, which includes parameters capturing overall change in network size between waves. As in the case of functional impairment, the model suggests that the only form of net loss that is significantly related to self-rated health involves a net loss of four or five confidants, which cut the odds of reporting good or better health (OR = .36, s.e. = .16, p < .05). We also see that net gains in network size – for those who reported modest gains of one or two confidants – are significantly associated with reporting better than poor health.
Both the number of confidants lost and the number added are significantly associated with self-rated health. Their associations depend on the level of health being considered. From the first column, losing a couple of network members significantly reduces the odds of reporting better than poor health, and losing all five W1 confidants has a higher-magnitude (but only marginally significant) association at this level. Likewise, losing four confidants reduces the odds of reporting very good or excellent health by half. The number of confidants lost does not have a consistent association across all levels of self-rated health. However, the general association is negative, in that losing confidants is only associated with worse health.
The number of confidants added has a consistent association with self-rated health, with proportional odds holding across levels. The addition of two new confidants is associated with a 23.5% increment in the odds of reporting better health at all levels, while the addition of four confidants is associated with a 61.8% percent increment. The coefficients for adding one or three confidants are also marginally significant (p = .097 and p = .072, respectively). Again, network losses and additions operate additively and are not conditional on each other. A separate model that tests for an interaction is not significant (OR= 1.01, s.e. = .03).
The relationship is depicted in Figure 4. The top panel shows predicted probabilities of reporting very good or excellent health, and the bottom panel depicts probabilities of reporting fair or poor health. In general, the odds of reporting better health increase as the number of confidants added increases. For example, among those who had four confidants at baseline and who lost two during the study period, the addition of three confidants is associated with a predicted probability of .38 of reporting good or excellent health, compared to .31 among those who did not add any new confidants – an 18% decrease.
Figure 4. Predicted Probabilities of Different Levels of Self-Rated Health among Older Adults, by the Number of Confidants Added during the Study Period.

Note: The dashed lines represent predicted probabilities when individuals had four confidants at baseline and lost two network members between waves. The solid lines show predicted probabilities for those who had three confidants at baseline and who lost one during the study period. The dotted lines show predicted probabilities for those who had two confidants at baseline and who lost one during the study period. All predicted values are based on the generalized ordered logistic regression models presented in Table 3, holding all other covariates constant at their mean values.
Depressive Symptoms
The final health outcome analyzed here is depressive symptoms (see Table 4). Few socio-demographic characteristics are consistently significantly associated with depressive symptoms. There is (marginal) evidence that those who have some college education experience fewer depressive symptoms than those who have less than a high school education. Those who were not working at either wave reported greater depression. Of the baseline network measures, only frequency of contact is related to depressive symptoms, as those who had more frequent contact with their confidants reported fewer depressive symptoms. Net increases (decreases) in emotional closeness to confidants were associated with fewer (more) depressive symptoms.
Table 4.
Unstandardized Coefficients from Regression Models Predicting W2 Depressive Symptoms (N = 2,142)a
| Predictor | Model 1 | Model 2 | Model 3 |
|---|---|---|---|
| W1 depressive symptoms (logged) | .470*** (.025) | .467*** (.025) | .469*** (.026) |
| Age (divided by 10) | .010 (.010) | .008 (.010) | .007 (.010) |
| Female | .008 (.013) | .010 (.012) | .010 (.012) |
| Black | −.007 (.017) | −.010 (.017) | −.008 (.017) |
| Hispanic | −.022 (.027) | −.024 (.027) | −.024 (.028) |
| Education (reference: < HS) | |||
| High school | −.015 (.021) | −.015 (.021) | −.015 (.021) |
| College degree | −.037 (.022) | −.037 (.022) | −.036 (.021) |
| Professional degree | −.043 (.027) | −.043 (.026) | −.043 (.026) |
| W1 network size (reference = 1) | |||
| Two | −.014 (.023) | −.010 (.026) | −.021 (.022) |
| Three | −.014 (.022) | −.022 (.023) | −.024 (.021) |
| Four | −.005 (.023) | −.024 (.026) | −.023 (.025) |
| Five | −.010 (.022) | −.029 (.027) | −.031 (.022) |
| W1 kin composition | .042 (.026) | .039 (.027) | .032 (.027) |
| W1 frequency of contact (W1) | −.020* (.010) | −.023* (.010) | −.024* (.010) |
| W1 emotional closeness | −.005 (.018) | −.006 (.019) | −.007 (.018) |
| W1 discussion of health matters | −.017 (.017) | −.016 (.016) | −.017 (.017) |
| Net network change (reference = no change in network size) | |||
| Net loss of four or five confidants | -- | .019 (.032) | -- |
| Loss of three confidants | -- | .038 (.044) | -- |
| Loss of two confidants | -- | .044 (.025) | -- |
| Loss of one confidant | -- | .039* (.017) | -- |
| Net gain of one confidant | -- | .003 (.021) | -- |
| Net gain of two confidants | -- | − 014 (.019) | -- |
| Net gain of three confidants | -- | − .031 (.025) | -- |
| Net gain of four or five confidants | -- | .011 (.038) | -- |
| Confidants lost (reference = zero) | |||
| One | -- | -- | .025 (.021) |
| Two | -- | -- | .022 (.018) |
| Three | -- | -- | .033 (.026) |
| Four | -- | -- | .024 (.026) |
| Five | -- | -- | .054 (.040) |
| Confidants added (reference = zero) | |||
| One | -- | -- | −.018 (.017) |
| Two | -- | -- | −.047* (.018) |
| Three | -- | -- | −.058* (.022) |
| Four | -- | -- | −.059* (.027) |
| Five | -- | -- | −.011 (.031) |
| Constant | .317** (.104) | .350** (.109) | .404** (.119) |
| R2 | .338 | .343 | .344 |
p < .05,
p < .01,
p < .001 (two-sided tests)
Estimates are weighted using NSHAP W1 person-weights (adjusted for attrition and selection at W2).
All models are survey-adjusted and include controls for baseline functional and self-rated health, religious attendance, W1 marital status and change in marital status, W1 employment status and change in employment status, interviewer effects, and change in kin composition, frequency of contact, emotional closeness, and likelihood of discussing health matters.
Model 2 shows that the only form of net change in network size that is significantly related to depressive symptoms are the situations involving the net loss of just one confidant or (to a marginal extent) two confidants. There is no evidence that net gains in network size are associated with depressive symptoms. Model 3 shows that whereas losing confidants is not associated with greater depressive symptomology, adding new confidants is associated with lower depressive symptomology. This is true for those who gained two, three, or four confidants during the study period. Again, there is no significant interaction between the number of confidant losses and the number of new confidants (b = .00, s.e. = .03).
Like the functional limitations scale, the measure of depressive symptoms is not interpretable. We therefore estimated logit models that predict: (1) whether respondents reported occasionally (as opposed to “rarely or never” or “sometimes”) experiencing at least one depressive symptom, and (2) experiencing multiple such depressive symptoms. Results of these analyses (Appendix Table A2) confirm that network additions are significantly associated with depressive symptoms whereas network losses are not, and also that additions of two, three, and four confidants are all significantly associated with this outcome.
Appendix Table A2.
Odds Ratios from Logistic Regression Models Predicting the Number of Depressive Symptoms Respondents Reported Experiencing at Least “Occasionally” (N = 2,142)
| Predictor | At Least One Depressive Symptom | At Least Two Depressive Symptoms |
|---|---|---|
| W1 network size (reference = 1) | ||
| Two | .734 (.209) | .705 (.203) |
| Three | .684 (.179) | .675 (.187) |
| Four | .439** (.124) | .696 (.211) |
| Five | .575* (.154) | .561* (.159) |
| Confidants lost (reference = zero) | ||
| One | 1.225 (.247) | 1.027 (.234) |
| Two | 1.272 (.291) | 1.205 (.261) |
| Three | 1.278 (.356) | 1.294 (.318) |
| Four | 1.132 (.328) | 1.091 (.371) |
| Five | 3.003 (.797) | 1.228 (.587) |
| Confidants added (reference = zero) | ||
| One | .734* (.104) | .773 (.143) |
| Two | .657* (.104) | .604* (.115) |
| Three | .506** (.109) | .534** (.105)) |
| Four | .512* (.144) | .522* (.130) |
| Five | 1.145 (.438) | .803 (.276) |
| Constant | 2.313 (2.313) | 2.029 (2.699) |
| Pseudo R2 | .174 | .208 |
p < .10
p < .05,
p < .01,
p < .001 (two-sided tests)
Estimates are weighted using NSHAP W1 person-weights (adjusted for attrition and selection at W2).
All models are survey-adjusted and include all of the same covariates and controls that were employed in the analysis that is presented in Table 4.
Predicted probabilities are plotted in Figure 5. In general, adding more confidants is associated with lower probabilities of depressive symptomology. For example, the dashed line shows predicted probabilities in the modal scenario where respondents started with four confidants and lost two. The predicted probability of reporting at least one depressive symptom among those who added three new confidants was .54, compared to .69 among those who added no new confidants – a 29% increase in risk. The lower panel of Figure 5 shows predicted probabilities of reporting multiple depressive symptoms. The nature of the association between network addition and multiple depressive symptoms is similar to that of any depressive symptoms.
Figure 5. Predicted Probabilities of Different Degrees of Depressive Symptomology among Older Adults, by the Number of Confidants Added during the Study Period.

Note: The dashed lines represent predicted probabilities when individuals had four confidants at baseline and lost two network members between waves. The solid lines show predicted probabilities for those who had three confidants at baseline and who lost one during the study period. The dotted lines show predicted probabilities for those who had two confidants at baseline and who lost one during the study period. All predicted values are based on the logistic regression models presented in Appendix Table A2, holding all other covariates constant at their mean values.
Endogeneity
It is possible that the significant associations between network changes and all three health outcomes analyzed here reflect endogeneity that is associated with reverse causation. Supplemental analyses predicting the number of losses and additions experienced by respondents are presented in Appendix Table A3. These analyses use Poisson regression, as there is no evidence of overdispersion in either number lost (M = 1.69, SD = 1.32) or added (M = 1.92, SD = 1.38). These models include baseline and between-wave change in functional impairment, self-rated health, and depressive symptoms as predictors, as well as the same predictors as the models presented above, except that they do not include other predictors representing network change (this decision does not affect the main findings). Neither the baseline health measures nor the measures of changes in health are significantly associated with either the number of confidants lost or the number added. These results do not guarantee that endogeneity is not present and that the estimates presented in Tables 2, 3, and 4 are not biased, but they do provide a measure of assurance that the findings reported above are not merely a reflection of reverse causation.
DISCUSSION
The unique health implications of different aspects of network change in later life – including both the loss of existing network members and (especially) the addition of new ones – are seldom studied in social research on health. This study has sought to highlight how important it is to pay attention to this issue when studying older adults’ health. Social network change is typical in later life. Older adults commonly lose network ties, as a vast literature has shown, but there is also an overriding norm of network replacement and substitution (Atchley, 1989; Donnelly & Hinterlong, 2010; Zettel & Rook, 2004). Most older adults actively cultivate new confidant relationships, whether in an effort to adapt to losses or to proactively expand their social networks. Unfortunately, the implications of these concurrent changes are seldom explored.
The importance of separating out network losses and additions from summary measures of network change is highlighted in our analysis of health. These countervailing processes appear to have different health consequences that are masked by summary measures. One of our overarching conclusions is that the “Network-loss-is-detrimental” narrative is far too simplistic a rubric for thinking about the implications of social network change in later life. Network loss is indeed associated with worse subsequent health, as a number of studies suggest (Giordano & Lindstrom, 2010; Seeman et al., 2011; Stroebe, Schut, & Stroebe, 2007; Thomas, 2011). But in our data there is a more consistent association between the addition of new network members and better health across a range of health measures. This finding is consistent with the hypothesis that the detriments of network loss may be counterbalanced by the benefits of adding fresh ties to one’s network. Moreover, regardless of whether they lose network members, older adults who cultivate new ties appear to enjoy health benefits.
An important task for future research on this link is to identify the mechanisms through which network change affects health. One possibility is that cultivating new network members increases levels of physical and cognitive activity to an extent that benefits immune function and cardiovascular health (e.g., Morrow-Howell &d Gehlert, 2012; Tan et al., 2009; Thomas, 2011). Adaptive efforts following potentially isolating later-life transitions, such as bereavement, can increase one’s community exposure and social activity (e.g., Donnelly & Hinterlong, 2010; Zettel & Rook, 2004), and may therefore also lead to elaborated impression management or self-control efforts (e.g., Abraham & Hansson, 1995). The addition of new network members may also boost self-esteem and reduce depression, which can have a variety of downstream health benefits (Kemp et al., 2012; Li, 2007; Street & Burge, 2012). Finally, those whose baseline social networks were deficient in some way may have been more likely to cultivate new network ties, such that the addition of new network members increased their access to (social) resources. We should note that a closer look at who was added to and lost from respondents’ confidant rosters reveals that lost and new confidants were disproportionately weak ties (e.g., in terms of frequency of contact and emotional closeness), and that respondents’ networks tended to have the same general characteristics at both waves. (More information is provided in Appendix Table A4.) Thus, turnover in confidant networks is more likely to reflect replacement and adaptation than efforts to alter one’s network so as to change its characteristics.
Appendix Table A4.
Alter-Level Measures Describing Stable, Lost, and New Confidant Ties (Unweighted)a
| Measureb | Average Values for:
|
|||
|---|---|---|---|---|
| Stable Confidants, at:
|
“Lost” Confidants (N = 3,609) | “New” Confidants (N = 4,112) | ||
| W1 (N = 4,005) | W2 (N = 4,005) | |||
| Kin relationship | .78 (.42) | .78 (.41) | .52 (.50) | .50 (.50) |
| Coresident status | .24 (.43) | .25 (.43) | .11 (.31) | .07 (.25) |
| Emotional closeness to alters (1 – 4) | 3.32 (.67) | 3.29 (.66) | 2.91 (.77) | 2.80 (.74) |
| Frequency of contact with alters (1 – 8) | 7.07 (1.11) | 7.02 (1.15) | 6.43 (1.41) | 6.41 (1.38) |
| Likelihood of discussing health with alters (1 – 3) | 2.72 (.56) | 2.72 (.55) | 2.40 (.75) | 2.37 (.76) |
| Frequency of contact between alters (0–8) | 4.54 (2.01) | 4.45 (2.00) | 3.65 (2.19) | 3.69 (2.16) |
| Length of time ego has known alters (1–4) | -- | -- | -- | 3.69 (.68) |
Estimates are drawn from all respondents for whom valid data were available for a given variable, ignoring those who had any trouble with the roster matching exercise and/or who had missing data on any alter. Standard deviations appear in parentheses below the relevant measure.
All estimtes refer to confidants (Roster A) only. “Lost” in this case refers to all confidants who were listed in Roster A at W1 but not at W2, while “new” confidants include any alters who were not included in Roster A at W1 but were at W2.
This study has several limitations. One issue is that our models are likely plagued by endogeneity. The increasingly prevalent argument that health shapes social network connectedness (e.g., Cornwell, 2009; Schafer, 2013) points to alternative explanations for our findings. Some of the processes that are central to social network change in later life – such as adaptive efforts at tie replacement – may be contingent on individuals’ health in the first place. In addition, we do not have the data necessary to determine the timing of and reasons behind older adults’ network losses and additions. These would provide crucial context for understanding when certain kinds of network changes have certain kinds of health consequences. We only examined three health outcomes in this study. It is likely that social network change has different implications for physical, psychological, and cognitive health, and that it varied with health-related behavior, lifestyle, social disadvantage, and other important factors that related to health. These possibilities provide exciting avenues for future research, and highlight the growing need for careful analyses of specific dimensions of network change in later life.
This paper nonetheless offers important evidence that to understand the implications of social networks for health in later life, we must pay greater attention to the dynamic features of older adults’ social environments. The central implication of this paper is that the link between social networks and health is not merely a function of current or recent network connectedness or resources. These features do have a profound impact on health. But, beyond this, the inherently dynamic nature of social networks gives rise to other unique processes throughout the life course. These processes speak to the degree of stability or instability in the social environment, reliability and predictability with respect to network resources and structural position, the need for proactive and adaptive response, and other factors that make social networks constant works-in-progress as opposed to static structures. These processes are under-theorized in the sociology of health, but should be seen as directly relevant to a number of health outcomes.
Research highlights.
New longitudinal data on changes in older adults’ egocentric networks.
Focuses on the health consequences of older adults’ cultivation of new network ties.
More older adults added network members than lost them.
Measures of net change in network size miss most instances of network change.
Adding new confidants is associated with better physical and mental health.
Footnotes
The National Social Life, Health, and Aging Project is supported by the National Institutes of Health (R01AG021487, R37AG030481, R01AG033903), which also provided partial funding for this research. An earlier version of this paper was presented at the session on “Social Network Dynamics and Health in Later Life” at the ASA conference in Denver, Colorado in 2012. We wish to thank Brea Perry, Howard Litwin, Phil Schumm, Erin York Cornwell, three anonymous reviewers, and the editors of Social Science & Medicine for providing useful suggestions on earlier drafts.
Whenever a W1 confidant was not named again at W2, interviewers first inquired: “I noticed that in our last interview in (YEAR), you also listed (NAME) as someone with whom you discuss important matters, but you did not list (NAME) this time. Is (NAME) still living?” If the respondent responded “Yes,” the interviewer asked: “What is the main reason you are no longer in touch with (NAME)?” Respondents were provided with a small pre-set list of reasons, including “I moved,” “(NAME) moved,” “I became ill or had a health problem,” “(NAME) became ill or had a health problem,” or “other.” Most respondents chose “other,” and were then asked to provide short open-ended explanations. There were no pre-validated response categories to classify losses. Through a series of working group discussions, the team identified eight categories of broad explanations for alter losses (including the above four pre-set categories). Two teams used different methods to independently code each open-ended response. One team categorized the responses by evaluating them and deciding which category was most appropriate. The other team used a computer to apply a data-reduction method based on word-frequency count that is commonly used in content analyses (Krippendorff 1980) – the operative assumption being that the words that are mentioned most often capture the general meaning of the text. Using these methods, the two coders achieved 80.1% inter-rater agreement across the nine categories, yielding a respectable level of reliability (Cramer’s V = .71). The NSHAP social networks team then discussed and resolved any remaining disputed categorizations.
Publisher's Disclaimer: This is a PDF file of an unedited manuscript that has been accepted for publication. As a service to our customers we are providing this early version of the manuscript. The manuscript will undergo copyediting, typesetting, and review of the resulting proof before it is published in its final citable form. Please note that during the production process errors may be discovered which could affect the content, and all legal disclaimers that apply to the journal pertain.
Contributor Information
Benjamin Cornwell, Email: btc49@cornell.edu, Department of Sociology, Cornell University, 354 Uris Hall, Ithaca, NY 14853.
Edward O. Laumann, Email: laumann@uchicago.edu, Department of Sociology, University of Chicago, 1126 E. 59th Street, Room 410, Chicago, IL 60637
References
- Abraham JD, Hansson RO. Successful aging at work: An applied study of selection, optimization, and compensation through impression management. Journal of Gerontology: Psychological Sciences. 1995;50B:P94–P103. doi: 10.1093/geronb/50b.2.p94. [DOI] [PubMed] [Google Scholar]
- Atchley RC. The continuity theory of normal aging. The Gerontologist. 1989;29:183–90. doi: 10.1093/geront/29.2.183. [DOI] [PubMed] [Google Scholar]
- Austin PC. An introduction to propensity score methods for reducing the effects of confounding in observational studies. Multivariate Behavioral Research. 2011;46:399–424. doi: 10.1080/00273171.2011.568786. [DOI] [PMC free article] [PubMed] [Google Scholar]
- Bailey S, Marsden PV. Interpretation and interview context: Examining the General Social Survey name generator using cognitive methods. Social Networks. 1999;21:287–309. [Google Scholar]
- Bearman PS. The social structure of suicide. Sociological Forum. 1991;6:501–524. [Google Scholar]
- Bearman P, Parigi P. Cloning headless frogs and other important matters: Conversation topics and network structure. Social Forces. 2004;83:535–57. [Google Scholar]
- Berkman LF, Glass T, Brissette I, Seeman TE. From social integration to health: Durkheim in the new millennium. Social Science & Medicine. 2000;51:843–57. doi: 10.1016/s0277-9536(00)00065-4. [DOI] [PubMed] [Google Scholar]
- Bidart C, Lavenu D. Evolutions of personal networks and life events. Social Networks. 2005;27:359–76. [Google Scholar]
- Cerhan JR, Wallace RB. Predictors of decline in social relationships in the rural elderly. American Journal of Epidemiology. 1993;137:870–880. doi: 10.1093/oxfordjournals.aje.a116748. [DOI] [PubMed] [Google Scholar]
- Cerhan JR, Wallace RB. Change in social ties and subsequent mortality in rural elders. Epidemiology. 1997;8:475–481. doi: 10.1097/00001648-199709000-00001. [DOI] [PubMed] [Google Scholar]
- Charles ST, Carstensen LL. Social and emotional aging. Annual Review of Psychology. 2010;61:383–409. doi: 10.1146/annurev.psych.093008.100448. [DOI] [PMC free article] [PubMed] [Google Scholar]
- Cornwell B. Good health and the bridging of structural holes. Social Networks. 2009;31:92–103. doi: 10.1016/j.socnet.2008.10.005. [DOI] [PMC free article] [PubMed] [Google Scholar]
- Cornwell B, Laumann EO. Network position and sexual dysfunction: Implications of partner betweenness for men. American Journal of Sociology. 2011;117:172–208. doi: 10.1086/661079. [DOI] [PMC free article] [PubMed] [Google Scholar]
- Cornwell B, Laumann EO, Schumm LP. The social connectedness of older adults: A national profile. American Sociological Review. 2008;73:185–203. doi: 10.1177/000312240807300201. [DOI] [PMC free article] [PubMed] [Google Scholar]
- Crimmins EM, Beltrán-Sánchez H. Mortality and morbidity trends: Is there compression of morbidity? Journals of Gerontology Series B: Social Sciences. 2011;66B:75–86. doi: 10.1093/geronb/gbq088. [DOI] [PMC free article] [PubMed] [Google Scholar]
- Deflem M. From anomie to anomia and anomic depression: A sociological critique on the use of anomie in psychiatric research. Social Science & Medicine. 1989;29:627–34. doi: 10.1016/0277-9536(89)90182-2. [DOI] [PubMed] [Google Scholar]
- Donnelly EA, Hinterlong JE. Changes in volunteer activity among recently widowed older adults. The Gerontologist. 2010;50:158–69. doi: 10.1093/geront/gnp103. [DOI] [PubMed] [Google Scholar]
- Doreian P, Stokman FN. Evolution of Social Networks. Amsterdam, Netherlands: Gordon & Breach; 1997. [Google Scholar]
- Eng PM, Rimm EB, Fitzmaurice G, Kawachi I. Social ties and change in social ties in relation to subsequent total and cause-specific mortality and coronary heart disease incidence in men. American Journal of Epidemiology. 2002;155:700–09. doi: 10.1093/aje/155.8.700. [DOI] [PubMed] [Google Scholar]
- Feld SL, Suitor JJ, Hoegh JG. Describing changes in personal networks over time. Field Methods. 2007;19:218–36. [Google Scholar]
- Fiori KL, Antonucci TC, Akiyama H. Profiles of social relations among older adults: A cross-cultural approach. Ageing and Society. 2008;28:203–31. [Google Scholar]
- Gerstorf D, Röcke C, Lachman ME. Antecedent-consequent relations of perceived control to health and social support: Longitudinal evidence for between-domain associations across adulthood. Journal of Gerontology: Psychological Sciences. 2010;66B:61–71. doi: 10.1093/geronb/gbq077. [DOI] [PMC free article] [PubMed] [Google Scholar]
- Giordano GN, Lindstrom M. The impact of changes in different aspects of social capital and material conditions on self-rated health over time: A longitudinal cohort study. Social Science & Medicine. 2010;70:700–10. doi: 10.1016/j.socscimed.2009.10.044. [DOI] [PubMed] [Google Scholar]
- Graham JE, Christian LM, Kiecolt-Glaser JK. Stress, age, and immune function: Toward a lifespan approach. Journal of Behavioral Medicine. 2006;29:389–400. doi: 10.1007/s10865-006-9057-4. [DOI] [PMC free article] [PubMed] [Google Scholar]
- Idler EL, Benyamini Y. Self-rated health and mortality: A review of twenty-seven community studies. Journal of Health and Social Behavior. 1997;38:21–37. [PubMed] [Google Scholar]
- Juster RP, McEwen BS, Lupien SJ. Allostatic load biomarkers of chronic stress and impact on health and cognition. Neuroscience and Biobehavioral Review. 2009;35:2–16. doi: 10.1016/j.neubiorev.2009.10.002. [DOI] [PubMed] [Google Scholar]
- Kahana E, Kelley-Moore J, Kahana B. Proactive aging: A longitudinal study of stress, resources, agency, and well-being in late life. Aging & Mental Health. 2012;16:438–51. doi: 10.1080/13607863.2011.644519. [DOI] [PMC free article] [PubMed] [Google Scholar]
- Kalmijn M. Shared friendship networks and the life course: An analysis of survey data on married and cohabiting couples. Social Networks. 2003;25:231–249. [Google Scholar]
- Kemp CL, Ball MM, Hollingsworth C, Perkins MM. Strangers and friends: residents’ social careers in assisted living. The Journals of Gerontology Series B: Psychological Sciences and Social Sciences. 2012;67:491–502. doi: 10.1093/geronb/gbs043. [DOI] [PMC free article] [PubMed] [Google Scholar]
- Krippendorff Klauss. Content Analysis: An Introduction to Its Methodology. Newbury Park, CA: Sage; 1980. [Google Scholar]
- Lamme S, Dykstra PA, van Groenou MIB. Rebuilding the network: New relationships in widowhood. Personal Relationships. 1996;3:337–49. [Google Scholar]
- Li Y. Recovering from spousal bereavement in later life: Does volunteer participation play a role? The Journals of Gerontology Series B: Psychological Sciences and Social Sciences. 2007;62:S257–S266. doi: 10.1093/geronb/62.4.s257. [DOI] [PubMed] [Google Scholar]
- Litwin H, Howard, Kimberly J, Stoeckel KJ. The social networks of older Europeans. In: Phellas Constantinos., editor. Aging in European Societies. New York: Springer; 2013. pp. 177–90. [Google Scholar]
- Morgan SL, Todd JJ. A diagnostic routine for the detection of consequential heterogeneity of causal effects. Sociological Methodology. 2008;38:231–81. [Google Scholar]
- Morrow-Howell N, Gehlert S. Social engagement and a healthy aging society. In: Prohaska Thomas R, Anderson Lynda A, Binstock Robert H., editors. Public Health for an Aging Society. Baltimore: The Johns Hopkins University Press; 2012. pp. 205–27. [Google Scholar]
- Paik A, Sanchagrin K. Social isolation in America: An artifact. American Sociological Review. 2013;78:339–360. [Google Scholar]
- Perry BL. Understanding social network disruption: The case of youth in foster care. Social Problems. 2006;53:371–91. [Google Scholar]
- Perry BL, Pescosolido BA. Functional specificity in discussion networks: The influence of general and problem-specific networks on health outcomes. Social Networks. 2010;32:345–57. [Google Scholar]
- Perry BL, Pescosolido BA. Social network dynamics and biographical disruption: The case of “first-timers” with mental illness. American Journal of Sociology. 2012;118:134–175. [Google Scholar]
- Pescosolido BA. Beyond Rational Choice: The social dynamics of how people seek help. American Journal of Sociology. 1992;97:1096–1138. [Google Scholar]
- Raacke J, Bonds-Raacke J. MySpace and Facebook: Applying the uses and gratifications theory to exploring friend-networking sites. Cyber Psychology & Behavior. 2008;11:169–74. doi: 10.1089/cpb.2007.0056. [DOI] [PubMed] [Google Scholar]
- Rai D, Kosidou K, Lundberg M, Araya R, Lewis G, Magnusson C. Psychological distress and risk of long-term disability: Population-based longitudinal study. Journal of Epidemiology & Community Health. 2011 doi: 10.1136/jech.2010.119644. in press. [DOI] [PubMed] [Google Scholar]
- Schafer MH. Structural advantages of good health in old age: Investigating the health-begets-position hypothesis with a full social network. Research on Aging. 2013;35:348–370. [Google Scholar]
- Seeman TE, Miller-Martinez DM, Merkin SS, Lachman ME, Tun PA, Karlamangla AS. Histories of social engagement and adult cognition: Midlife in the U.S. study. Journals of Gerontology, B: Psychological Sciences and Social Sciences. 2011;66B:i141–i152. doi: 10.1093/geronb/gbq091. [DOI] [PMC free article] [PubMed] [Google Scholar]
- Snijders TAB, Doreian P. Introduction to the special issue on network dynamics. Social Networks. 2010;32:1–3. [Google Scholar]
- Street D, Burge SW. Residential context, social relationships, and subjective well-being in assisted living. Research on Aging. 2012;34:365–94. [Google Scholar]
- Stroebe M, Schut H, Stroebe W. Health outcomes of bereavement. Lancet. 2007;370:1960–1973. doi: 10.1016/S0140-6736(07)61816-9. [DOI] [PubMed] [Google Scholar]
- Tan EJ, Rebok GW, Yu Q, Frangakis CE, Carlson MC, Wang T, Ricks M, Tanner EK, McGill S, Fried LP. The long-term relationship between high-intensity volunteering and physical activity in older African American women. The Journals of Gerontology Series B: Psychological Sciences and Social Sciences. 2009;64:304–11. doi: 10.1093/geronb/gbn023. [DOI] [PMC free article] [PubMed] [Google Scholar]
- Thoits PA. Mechanisms linking social ties and support to physical and mental health. Journal of Health and Social Behavior. 2011;52:145–61. doi: 10.1177/0022146510395592. [DOI] [PubMed] [Google Scholar]
- Thomas PA. Trajectories of social engagement and limitations in late life. Journal of Health and Social Behavior. 2011;52:430–43. doi: 10.1177/0022146511411922. [DOI] [PubMed] [Google Scholar]
- Uchino BN. Social support and health: A review of physiological processes potentially underlying links to disease outcomes. Journal of Behavioral Medicine. 2006;29:377–87. doi: 10.1007/s10865-006-9056-5. [DOI] [PubMed] [Google Scholar]
- van Groenou Marjolein Broese, Theo van Tilburg. Six-Year Follow-up on volunteering in Later Life: A Cohort Comparison in the Netherlands. European Sociological Review. 2012;28:1–11. [Google Scholar]
- Wellman B, Wong RYL, Tindall D, Nazer N. A decade of network change: Turnover, persistence and stability in personal communities. Social Networks. 1997;19:27–50. [Google Scholar]
- Williams R. Generalized ordered logit/partial proportional odds models for ordinal dependent variables. The Stata Journal. 2006;6:58–82. [Google Scholar]
- York Cornwell E, Waite LJ. Social disconnectedness, perceived isolation, and health among older adults. Journal of Health and Social Behavior. 2009;50:31–48. doi: 10.1177/002214650905000103. [DOI] [PMC free article] [PubMed] [Google Scholar]
- Zettel LA, Rook KS. Substitution and compensation in the social networks of older widowed women. Psychology and Aging. 2004;19:433–43. doi: 10.1037/0882-7974.19.3.433. [DOI] [PubMed] [Google Scholar]