

Abstract
Background
The prevalence of hypertension among collegiate football athletes is not well described.
Methods and Results
A retrospective cohort of all male athletes who participated in varsity athletics at a National Collegiate Athletic Association Division I university between 1999–2012 was examined through chart review. Mandatory annual preparticipation physical examinations included blood pressure, body mass index, medication use, and supplement use. Prevalence of hypertension was compared between football and non-football athletes. A mixed-effects linear regression model examined change in blood pressure over time. 636 collegiate athletes, including 323 football players, were identified. In the initial year of athletic participation, 19.2% of football athletes had hypertension and 61.9% had prehypertension. The prevalence of hypertension was higher among football athletes than non-football athletes in their initial (19.2% vs. 7.0%, P< 0.001) and final (19.2% vs. 10.2%, P=0.001) years of athletic participation. In adjusted analyses, the odds of hypertension was higher among football athletes in the initial year (AOR 2.28, 95% CI 1.21 to 4.30) but not the final year (AOR 1.25, 95% CI 0.69 to 2.28). Over the course of their collegiate career, football athletes had an annual decrease in systolic blood pressure (−0.82 mmHg, P=0.002), while non-football athletes did not (0.18 mmHg, P=0.58).
Conclusions
Hypertension and prehypertension were common among collegiate football athletes, and football athletes were more likely to have hypertension than male non-football athletes. This presents a potential cardiovascular risk in a young population of athletes. Strategies for increasing awareness, prevention and treatment are needed.
Keywords: blood pressure, epidemiology, hypertension, physical exercise, athletes
Introduction
In the 2011–2012 academic year, an estimated 261,150 male college students at National Collegiate Athletic Association (NCAA) member schools participated in varsity athletics and 69,643 of these students played American football.1 Routine physical activity is an established means of blood pressure reduction and provides many cardiovascular health benefits. However, football players may have increased cardiovascular risks. One study of professional athletes found that National Football League (NFL) players had a higher prevalence of hypertension (13.8%) than age-matched men in the general US population (5.5%).2 The higher prevalence of hypertension persisted even after adjusting for body mass index (BMI) and race.2
The prevalence of hypertension among collegiate football athletes has not been well established. Several small studies have suggested that collegiate football athletes have a high prevalence of hypertension. Recently, it was reported that first-year football athletes have an increase in blood pressure during their initial season of collegiate football participation. In this cohort, 14% had hypertension at the end of their initial year of athletic participation.3 However these studies have been limited by small sample sizes, blood pressure measurement during a single season, comparisons to non-athletes, or inability to assess potential confounders such as BMI, race, medication use, and supplement use.3–10 Information about the change in blood pressures among football athletes over the course of an entire collegiate career is lacking.
Our aim was to determine the prevalence of hypertension among collegiate football athletes and to compare hypertension among football athletes to non-football athletes during collegiate athletic participation. We also sought to compare the change in systolic blood pressure of these 2 groups of athletes over the course of their collegiate careers. Our hypothesis was that football athletes would have a higher prevalence of hypertension and a greater increase in systolic blood pressure over the course of a collegiate career than non-football athletes.
Methods
Study Design and Population
We assembled a retrospective cohort of 678 collegiate athletes who participated in varsity athletics at a private NCAA Division I university in the Southeastern Conference. We selected all male athletes listed on varsity rosters whose final year of athletic participation was in the 2003–2004 academic year through those participating in the 2011–2012 academic year. Because athletes started at the university up to 5 years before their final year of participation, data was collected between 1999–2012. Data were collected from the athletic training room medical record, which contains athletic-specific medical documentation, for each year that the athlete participated in varsity athletics. Because some students do not participate in athletics for their entire 4-year NCAA eligibility period while other athletes did not use their eligibility in contiguous years, each athlete had data collected from between 1 and 5 years of athletic participation.
Male athletes were excluded if they reported a history of a cardiac or renal abnormality or surgery, did not have at least one preparticipation physical evaluation available for review, or did not have an initial blood pressure recorded. The Institutional Review Board at Vanderbilt University approved the study with a waiver for informed consent.
Data collection
All athletes were required to undergo a preparticipation physical examination by a Sports Medicine physician prior to annual athletics participation. A clinical nurse, certified athletic trainer, or physician took at least 1 standardized resting blood pressure measurement at each preparticipation physical evaluation. Attention was given to use of an appropriately sized blood pressure cuff, and a repeat blood pressure measurement was typically assessed if the initial value was abnormal. In cases of multiple blood pressure measurements, the lowest measurement recorded during the preparticipation physical evaluation was conservatively used for analysis. The athletic training room medical record also included a standardized demographic history form completed once at matriculation containing: birth date, medical history, tobacco use, family medical history, and zip code. A standardized preparticipation physical evaluation form contained repeated (annual) assessment of: height, weight, medications (including over the counter medications), and supplement use. Study data were collected using a chart abstraction form by 5 trained reviewers from the Vanderbilt Survey Research Shared Resource core within the Vanderbilt Epidemiology Center. In addition, the institutional Athletics Compliance Office provided athlete’s self-reported race, sport, positions played, and scholarship status. All data was managed using REDCap (Research Electronic Data Capture).
Exposure: Classification of Sport
Athletes whose primary or secondary sport was football were classified as football athletes. Athletes whose primary or secondary sport was not football were classified as non-football athletes. There were 2 athletes who played both a primary and secondary sport. Both of these athletes played football and basketball, and were considered as football athletes only.
Outcomes: Hypertension Prevalence and Systolic Blood Pressure
Blood pressures were collected at each annual preparticipation physical evaluation. Blood pressure classifications from The Seventh Report of the Joint National Committee on Prevention, Detection, Evaluation, and Treatment of High Blood Pressure (JNC 7) were used.12 Normal blood pressure was defined as a systolic blood pressure <120 mmHg and a diastolic blood pressure <80 mmHg. Prehypertension was defined as a systolic blood pressure of 120 to 139 mmHg or a diastolic blood pressure of 80 to 89 mmHg. The primary outcome was the prevalence of hypertension in the initial and final year of athletic participation, defined as a systolic blood pressure ≥140 mmHg, or a diastolic blood pressure ≥90 mmHg, or a self-reported history of hypertension, or use of an antihypertensive medication with no alternative reason documented. The secondary outcome was the mean systolic and diastolic blood pressure at the 2 time points. We also examined the change in systolic blood pressure over the course of the collegiate career.
Covariates
Covariates abstracted from the training room medical record included: age, BMI, parental history of hypertension, medication use, supplement use, tobacco use, and estimated parental income derived from zip code. Medications were reviewed and classified (A.R.K. and C.L.R.) as blood pressure increasing or non-blood pressure increasing based on the primary effects or common side effects of the medication with reference to Epocrates®. Supplements were self-reported separately from medications. The most common supplements were vitamins and protein supplements. Assessment of tobacco use was not added to the demographic history form until 2005. Athletes were considered to be scholarship athletes if they received a scholarship during at least half of their years of athletic participation. Parental income was estimated using the 2011 median household income in 2011 inflation-adjusted dollars for the zip code tabulation area of each athlete’s residence immediately prior to matriculation.13
Statistical analysis
Statistical analyses were performed using Stata/SE version 12.0 (Stata Corp, College Station, Texas) and R 2.15.2 (http://www.R-project.org). Using descriptive statistics, we examined the distribution of demographics, covariates, and systolic and diastolic blood pressure outcomes in football and non-football athletes. We compared the prevalence of hypertension and prehypertension in the initial and final years of athletic participation between football and non-football athletes using chi-squared analyses and calculated 95% confidence intervals (CI) for binomial proportions using Wilson’s formula.14 We used multivariable logistic regression models to estimate the odds of hypertension vs. non-hypertension (prehypertension and normal blood pressure) in football athletes and non-football athletes in the initial and the final years of athletic participation adjusted for the following covariates: age (continuous), race (White, Black, or other), BMI (continuous), parental history of hypertension (present/absent), blood pressure increasing medication use (present/absent), supplement use (present/absent), tobacco use (present/absent), scholarship status (present/absent), and estimated parental income (continuous).
For the secondary outcome, we examined systolic and diastolic blood pressure as continuous measures at the initial and final years of athletic participation. We used multivariable linear regression models to estimate systolic blood pressure in football athletes and non-football athletes adjusting for the same covariates as described above.
For longitudinal analyses, we used a mixed-effects linear regression model to examine the change in systolic blood pressure over time and mixed-effects logistic regression model to examine change in hypertension over time for football athletes and non-football athletes with random intercepts to account for within-subject correlation. BMI, medication use, and supplement use were included in the model as time-varying covariates and the other covariates were time-invariant. We also included the number of years played and an athletic status (football vs. non-football) x number of years played interaction term in these models.
In all models, missing data for race (n=3), BMI (n=6), tobacco use (n=192), scholarship status (n=3), and income (n=54) were imputed using multiple imputation, incorporating predictive mean matching and flexible additive imputation models, as implemented in the aregImpute function available in the Hmisc package in R. In the initial models it appeared BMI was strongly predictive of the association between football and hypertension as well as football and systolic blood pressure. Thus, in a post hoc analysis we report additional models showing the effect of all covariates except BMI.
Sample Size calculation
We calculated that including 178 football athletes and 178 non-football athletes, assuming a 24% prevalence of hypertension among football athletes,9 an 11% prevalence of hypertension among non-football athletes,15 and a type 1 error rate of 0.05, based on a 2-sample comparison of proportions, would provide 90% power to detect a difference in the prevalence of hypertension.
Sensitivity and subgroup analyses
In sensitivity analyses, we used the mean of all blood pressures recorded during the preparticipation physical evaluation, rather than the lowest measurement obtained that day. We also performed sensitivity analyses excluding athletes’ who self-reported a history of hypertension as part of the definition of hypertension. We preformed subgroup analyses restricting the population to football athletes and comparing offensive and defensive linemen (offensive lineman, center, offensive guard, offensive tackle, defensive lineman, defensive tackle, and defensive end) to non-linemen football athletes.
Results
We identified 678 male athletes on varsity athletic rosters. We excluded 42 athletes (6%) for the following reasons: history of cardiac or renal abnormality or surgery (n=13), no preparticipation physical evaluation available for review (n=17), or no initial blood pressure recorded (n=12) (Figure 1). The remaining 636 males, 323 (50.8%) football athletes and 313 (49.2%) non-football athletes, were included in the study.
Figure 1.

Flow of Study Participant Selection.
Athletes participated in baseball, basketball, cross-country, football, golf, soccer, and tennis (Table 1). All sports were offered each year other than soccer, which was only available until 2006. Football and non-football athletes were similar in age, medication use, and tobacco use. Compared to non-football athletes, football athletes were more likely to be Black (P<0.001), have a higher initial BMI (P<0.001), and have a parental history of hypertension (P=0.03). Football athletes reported more initial supplement use (P<0.001), more scholarships (P=0.003), lower parental incomes (P<0.001), and more years of athletic participation (P<0.001) than non-football athletes.
Table 1.
Characteristics of the Study Cohort.
| Non-Football N=313 |
Football N=323 |
P value | |
|---|---|---|---|
| Age, years (mean ± SD) | 18.8 ± 0.8 | 18.6 ± 0.7 | <0.001 |
| Race (%) | |||
| White | 62.9 | 44.3 | |
| Black | 12.1 | 39.3 | <0.001 |
| Other | 24.3 | 16.1 | |
| Available (%) | 99.4 | 99.7 | |
| BMI, kg/m2 (mean ± SD) | |||
| Initial year of athletic participation | 23.8 ± 2.6 | 28.4 ± 4.3 | <0.001 |
| Final year of athletic participation | 24.6 ± 2.8 | 29.8 ± 4.3 | <0.001 |
| Parental history of hypertension (%) | 26.5 | 34.7 | 0.03 |
| Medication use (%) | |||
| Initial year of athletic participation | 29.7 | 29.1 | 0.87 |
| Blood pressure increasing | 10.5 | 8.4 | 0.64 |
| Final year of athletic participation | 19.8 | 18.3 | 0.62 |
| Blood pressure increasing | 8.0 | 7.1 | 0.53 |
| Supplement use (%) | |||
| Initial year of athletic participation | 22.7 | 37.5 | <0.001 |
| Final year of athletic participation | 8.0 | 14.9 | 0.007 |
| Tobacco use (%) | 11.0 | 11.1 | 0.99 |
| Available (%) | 69.6 | 70.0 | |
| Scholarship (%) | 65.6 | 76.4 | 0.003 |
| Available (%) | 99.4 | 99.7 | |
| Parental income, dollars (median, IQR) | 72,622 (54,690 – 92,948) | 56,568 (44,510 – 83,357) | <0.001 |
| Available (%) | 87.5 | 95.4 | |
| Number of varsity athletic years (mean ± SD) | 2.8 ± 1.1 | 3.2 ± 1.3 | <0.001 |
| Sport (%) | |||
| Baseball | 39.6 | _ | |
| Basketball | 15.3 | _ | |
| Cross-country | 12.1 | _ | |
| Golf | 8.3 | _ | _ |
| Soccer | 14.1 | _ | |
| Tennis | 10.5 | _ | |
| Football | _ | 100 | |
| Linemen | 31.0 | ||
| Non-linemen | 69.0 | ||
Primary Outcome: Prevalence of Hypertension
The prevalence of hypertension among football athletes was 19.2% (95% CI 15.3% to 23.8%) in the initial year of athletic participation and 19.2% (95% CI 15.3% to 23.8%) in the final year of athletic participation (Table 2). Compared to non-football athletes, the prevalence of hypertension was higher among football athletes in both the initial year (19.2% vs. 7.0%; P<0.001) and final year (19.2% vs. 10.2%; P=0.005) of athletic participation (Figure 2). Athletes met criteria for hypertension in the initial year for: elevated blood pressure measurement (93%), history of hypertension (9.5%), and use of anti-hypertensive medication (1.2%). Athletes met criteria for hypertension in the final year for: elevated blood pressure measurement (90%), history of hypertension (8.5%), and use of anti-hypertensive medication (4.3%). The prevalence of prehypertension among football athletes was 61.9% (95% CI 56.5% to 67.0%) in the initial year of athletic participation and 59.8% (95% CI 54.3% to 65.0%) in the final year of athletic participation.
Table 2.
Prevalence of Hypertension and Mean Blood Pressures in Collegiate Football and Non-Football Athletes in Initial Year and Final Year of Athletic Participation.
| Non-Football N=313 |
Football N=323 |
P value | |
|---|---|---|---|
| Hypertension (%) (95% confidence interval) | |||
| Initial year of athletic participation | 7.0 (4.5 – 10.1) | 19.2 (15.3 – 23.8) | < 0.001 |
| Final year of athletic participation | 10.2 (7.1 – 13.7) | 19.2 (15.3 – 23.8) | 0.001 |
| Prehypertension (%) (95% confidence interval) | |||
| Initial year of athletic participation | 64.5 (57.1 – 67.6) | 61.9 (56.5 – 67.0) | 0.49 |
| Final year of athletic participation | 64.5 (57.1 – 67.6) | 59.8 (54.3 – 65.0) | 0.21 |
| Systolic blood pressure, mmHg (mean ± SD) | |||
| Initial year of athletic participation | 122.5±9.8 | 126.4±11.0 | <0.001 |
| Final year of athletic participation | 123.4±10.0 | 125.1±11.0 | 0.05 |
| Diastolic blood pressure, mmHg (mean ± SD) | |||
| Initial year of athletic participation | 72.3±9.0 | 75.3±9.9 | <0.001 |
| Final year of athletic participation | 73.8±8.2 | 76.8±9.3 | <0.001 |
Figure 2.
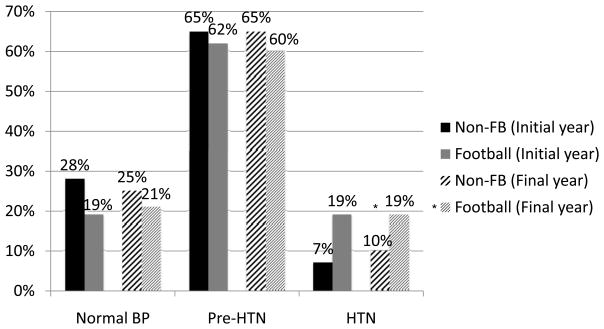
Prevalence of Normal Blood Pressure, Prehypertension, and Hypertension Among Collegiate Football Athletes and Non-football (Non-FB) Athletes in the Initial Year and Final Year of Athletic Participation.
* P<0.05
In the initial year, the adjusted odds of hypertension was higher among football athletes (AOR 2.28, 95% CI 1.21 to 4.30; P=0.01) than non-football athletes. However, in the final year, the adjusted odds of hypertension did not differ between football athletes (AOR 1.25, 95% CI 0.69 to 2.28; P=0.47) and non-football athletes. BMI was an important confounder in each model (Figure 3). Race as a confounder did not contribute to the overall effect. In a longitudinal analysis, the odds of having hypertension decreased by 8.2% with each additional year for football athletes (95% CI, −12.0% to 24.7%, P=0.401) and increased by 21.7% for non-football athletes (95% CI −11.2% to 66.8%, P=0.222).
Figure 3.


Results of Multivariable Logistic Regression of Hypertension and Multivariable Linear Regression of Systolic Blood Pressure for Collegiate Football Athletes vs. Non-football Athletes in the Initial Year and Final Year of Varsity Athletic Participation.
* All covariates included age, race, BMI, parental history of hypertension, medication use, supplement use, tobacco use, scholarship status, and parental income.
† Estimate for difference in systolic blood pressure in mmHg.
Secondary Outcome: Mean Systolic and Diastolic Blood Pressures
In both the initial and final year of athletic participation, football athletes had higher mean systolic (initial: 126.4±11.0 vs. 122.5±9.8 mmHg; P<0.001; final: 125.1±11.0 vs. 123.4±10.0 mmHg; P=0.05) and diastolic (initial: 75.3±9.9 mmHg vs. 72.3±9.0 mmHg; P<0.001; final: 76.8±9.3 vs. 73.8±8.2 mmHg; P<0.001) blood pressures than non-football athletes (Table 2). In adjusted analyses, football athletes had higher systolic blood pressures than non-football athletes in the initial year, by 2.62 mmHg (95% CI 0.59 to 4.66 mmHg; P=0.01). However, in the final year of athletic participation, their mean systolic blood pressure was not different from non-football athletes (−1.23 mmHg, 95% CI −3.30 to 0.84 mmHg; P=0.24) (Figure 3). In a longitudinal analysis, football athletes had an annual decrease in systolic blood pressure over the course of their collegiate career (−0.82 mmHg; P=0.002) while non-football athletes did not have a change in systolic blood pressure over time (0.18 mmHg; P=0.58) (Figure 4).
Figure 4.

Relationship Between Number of Years of Athletic Participation and Systolic Blood Pressure for Football and Non-Football Athletes Adjusting for Age, Race, BMI, Parental History of Hypertension, Medication Use, Supplement Use, Tobacco Use, Scholarship Status, Parental Income, Number of Years Played, and a Football x Number of Years Played Interaction Term.
In 2 sensitivity analyses, using the mean of all blood pressure measurements, and excluding athletes’ history of hypertension as part of the definition of hypertension, results were similar. In subgroup analyses of football athletes (n=323), the prevalence of hypertension was similar between linemen (n=100) and non-linemen (n=223) in the initial year (23.0% vs. 17.5%; P=0.25) and final year (24.0% vs. 17.0%; P=0.14) of athletic participation.
Discussion
In this study, 76% of all collegiate male athletes had prehypertension or hypertension. In unadjusted analyses, football athletes had a higher prevalence of hypertension and higher mean systolic blood pressures than non-football male athletes in both initial and final years of athletic participation. Some, but not all, of this increase in hypertension and systolic blood pressure was explained by a higher BMI among football athletes. In longitudinal analyses, football athletes had a non-significant decrease in the risk of developing hypertension over the course of a collegiate athletic career. The systolic blood pressure of football athletes decreased slightly over the course of a collegiate athletic career while systolic blood pressure remained unchanged for non-football athletes. Similar to others, we found that football linemen had a similar prevalence of hypertension as non-linemen.2, 16, 17
We found a high prevalence of hypertension (19.2%) among collegiate football athletes in both the initial year and final year of athletic participation. The prevalence of hypertension in our sample of collegiate male football athletes is much greater than the 2.2% prevalence of hypertension reported among 18–24 year old males18 and the 9.1% prevalence of hypertension reported among 20–34 year old males in the general U.S. population.19 The results are similar to a prior report that described 85 collegiate football athletes with a 23.5% prevalence of hypertension in their initial year of athletic participation.9 However, it is somewhat greater than the 14% prevalence of hypertension reported in 113 football athletes after the initial year of athletic participation.3 Additionally, the mean blood pressure of collegiate football athletes in our sample was in the prehypertensive range in both the initial year (126/75 mmHg) and the final year (125/77 mmHg) of athletic participation. This is consistent with past reports of collegiate football4–9 and NFL athletes,2 but remains higher than the estimated mean blood pressure among 18–39 year old men in the general population (119/70 mmHg).20
Although football athletes had a higher prevalence of hypertension in the initial year of athletic participation when adjusting for BMI and other covariates, in the final year of athletic participation there was no difference. It is possible that participation in high school football may be an independent risk factor for hypertension that is responsible for the initial difference. Alternatively, the increase in BMI experienced by non-football athletes between their initial and final years of athletic participation may have a larger effect on blood pressure than the increase in BMI experienced by football athletes. More research is needed in this area.
We also found a high prevalence of prehypertension and hypertension, and elevated mean systolic blood pressures, in the non-football collegiate male athletes. These findings may raise concern about whether blood pressure was measured properly in this population who tend to be larger and more muscular than the general population. However, our providers were trained to use large cuffs and have a standardized approach to blood pressure measurement. The high blood pressure measurements may also call into question our application of standard definitions for normal blood pressure from the general population to the population of male athletes. Current blood pressure guidelines do not provide alternate definitions for hypertension for athletes.
If these measurements are a true reflection of blood pressure in this population, then collegiate male athletes, and football athletes in particular, may have an increased cardiovascular risk that should be more robustly addressed. Possible factors that may increase the risk of hypertension among football athletes, include frequent use of non-steroidal anti-inflammatory drugs,21 high salt intake,22 strength and resistance training23–25 the psychosocial pressures of competition,26 stimulant use,27 or supplement use.28 These factors should continue to be investigated.
Our study was strengthened by our ability to evaluate blood pressures in a large cohort of athletes from 14 consecutive years at multiple time points over the course of a collegiate athletic career while considering many important covariates. However, we were limited by the retrospective use of medical records at a single private institution, which affects the generalizability of our results. Additionally, although BMI is commonly used in clinical practice, it may overestimate obesity in football athletes with increased muscle mass.9, 29 We were not powered to detect a difference in the prevalence of hypertension between linemen and other football athletes. There may have been a social desirability bias leading athletes to under-report medication, supplement, or tobacco use. Finally, we were unable to measure other factors that could influence blood pressure, such as alcohol use, banned-substance use, salt intake, or psychosocial stressors.
In summary, collegiate male athletes have a markedly high prevalence of prehypertension and hypertension, and football athletes have a higher prevalence of hypertension and higher systolic blood pressures than male non-football athletes. Some, but not all, of the elevation in blood pressure is related to the higher BMI of football athletes. The increased prevalence of hypertension and higher systolic blood pressures of football athletes upon matriculation to college suggests the need for further investigation of hypertension in pre-college football athletes. Additionally, we should continue to investigate the etiologies of these higher blood pressures. Regardless of the cause, the high prevalence of prehypertension and hypertension in all collegiate male athletes supports the need for increased awareness, prevention, and treatment of elevated blood pressures in athletes.
Acknowledgments
We thank the Survey Research Shared Resource at Vanderbilt University for compensated assistance with data collection and Mollie Malone, MEd, ATC, Vanderbilt University, for maintaining the athletic training room records.
Funding Sources: This work was supported by the Office of Academic Affiliations, Department of Veterans Affairs, VA National Quality Scholars Program with resources and use of facilities at Tennessee Valley Healthcare System, Nashville, TN, the American Medical Society for Sports Medicine Foundation, Inc., the National Center for Advancing Translational Sciences of the National Institute of Health under Award Number UL1 TR00045, and the Survey and Biospecimen Shared Resource at Vanderbilt Medical Center which is supported in part by the Cancer Center Supporting Grant #P30CA068485 awarded to the Vanderbilt-Ingram Cancer Center/Vanderbilt Medical Center and funded by the National Cancer Institute. The content is solely the responsibility of the authors and does not necessarily represent the official views of the National Institutes of Health.
Footnotes
Disclosures: None
References
- 1.Irick E. NCAA Sports Sponsorship and Participation Rates Report 1981-82 - 2011-12. Indianapolis, Indiana: National Collegiate Athletic Association; 2012. [Google Scholar]
- 2.Tucker AM, Vogel RA, Lincoln AE, Dunn RE, Ahrensfield DC, Allen TW, Castle LW, Heyer RA, Pellman EJ, Strollo PJ, Jr, Wilson PW, Yates AP. Prevalence of cardiovascular disease risk factors among National Football League players. JAMA. 2009;301:2111–2119. doi: 10.1001/jama.2009.716. [DOI] [PubMed] [Google Scholar]
- 3.Weiner RB, Wang F, Isaacs SK, Malhotra R, Berkstresser B, Kim JH, Hutter AM, Jr, Picard MH, Wang TJ, Baggish AL. Blood pressure and left ventricular hypertrophy during american-style football participation. Circulation. 2013;128:524–531. doi: 10.1161/CIRCULATIONAHA.113.003522. [DOI] [PubMed] [Google Scholar]
- 4.Dobrosielski DA, Rosenbaum D, Wooster BM, Merrill M, Swanson J, Moore JB, Brubaker PH. Assessment of cardiovascular risk in collegiate football players and nonathletes. J Am Coll Health. 2011;59:224–7. doi: 10.1080/07448481.2010.483719. [DOI] [PubMed] [Google Scholar]
- 5.Haskins S, Bernhardt DT, Koscik RL. Screening for insulin resistance and cardiovascular risk in collegiate football linemen. Clin J Sports Med. 2011;21:233–6. doi: 10.1097/JSM.0b013e31821a61f8. [DOI] [PubMed] [Google Scholar]
- 6.Magalski A, Maron BJ, Main ML, McCoy M, Florez A, Reid KJ, Epps HW, Bates J, Browne JE. Relation of race to electrocardiographic patterns in elite American football players. J Am Coll Cardiol. 2008;51:2250–5. doi: 10.1016/j.jacc.2008.01.065. [DOI] [PubMed] [Google Scholar]
- 7.Millard-Stafford M, Sparling PB. Comparison of blood lipids and blood pressure on black and white collegiate male athletes. Am J Hum Biol. 1992;4:265–70. doi: 10.1002/ajhb.1310040211. [DOI] [PubMed] [Google Scholar]
- 8.Wilkerson GB, Bullard JT, Bartal DW. Identification of cardiometabolic risk among collegiate football players. J Athl Training. 2010;45:67–74. doi: 10.4085/1062-6050-45.1.67. [DOI] [PMC free article] [PubMed] [Google Scholar]
- 9.Carbuhn AF, Womack JW, Green JS, Morgan K, Miller GS, Crouse SF. Performance and blood pressure characteristics of first-year National Collegiate Athletic Association Division I football players. J Strength Cond Res. 2008;22:1347–54. doi: 10.1519/JSC.0b013e318173db5d. [DOI] [PubMed] [Google Scholar]
- 10.Dixit S, Hecht S, Concoff A. Cardiovascular risk factors in football players. Current Sports Medicine Reports. 2011;10:378–82. doi: 10.1249/JSR.0b013e31823a362e. [DOI] [PubMed] [Google Scholar]
- 11.Harris PA, Taylor R, Thielke R, Payne J, Gonzalez N, Conde JG. Research electronic data capture (RedCap)--a metadata-driven methodology and workflow process for providing translational research informatics support. J Biomed Inform. 2009;42:377–81. doi: 10.1016/j.jbi.2008.08.010. [DOI] [PMC free article] [PubMed] [Google Scholar]
- 12.Chobanian AV, Bakris GL, Black HR, Cushman WC, Green LA, Izzo JL, Jr, Jones DW, Materson BJ, Oparil S, Wright JT, Jr, Roccella EJ. The seventh report of the joint national committee on prevention, detection, evaluation, and treatment of high blood pressure: The JNC 7 report. JAMA. 2003;289:2560–72. doi: 10.1001/jama.289.19.2560. [DOI] [PubMed] [Google Scholar]
- 13.American Fact Finder. U.S. Census Bureau; [Accessed February 1, 2013]. at http://factfinder2.census.gov/faces/nav/jsf/pages/searchresults.xhtml) [Google Scholar]
- 14.Brown LCT, Dasgupta A. Interval estimation for a binomial proportion. Stat Sci. 2011;16:101–33. [Google Scholar]
- 15.Roger VL, Go AS, Lloyd-Jones DM, Benjamin EJ, Berry JD, Borden WB, Bravata DM, Dai S, Ford ES, Fox CS, Fullerton HJ, Gillespie C, Hailpern SM, Heit JA, Howard VJ, Kissela BM, Kittner SJ, Lackland DT, Lichtman JH, Lisabeth LD, Makuc DM, Marcus GM, Marelli A, Matchar DB, Moy CS, Mozaffarian D, Mussolino ME, Nichol G, Paynter NP, Soliman EZ, Sorlie PD, Sotoodehnia N, Turan TN, Virani SS, Wong ND, Woo D, Turner MB. Heart disease and stroke statistics--2012 update: A report from the American Heart Association. Circulation. 2012;125:e2–e220. doi: 10.1161/CIR.0b013e31823ac046. [DOI] [PMC free article] [PubMed] [Google Scholar]
- 16.Rice TB, Dunn RE, Lincoln AE, Tucker AM, Vogel RA, Heyer RA, Yates AP, Wilson PW, Pellmen EJ, Allen TW, Newman AB, Strollo PJ., Jr Sleep-disordered breathing in the National Football League. Sleep. 2010;33:819–824. doi: 10.1093/sleep/33.6.819. [DOI] [PMC free article] [PubMed] [Google Scholar]
- 17.Albuquerque FN, Kuniyoshi FH, Calvin AD, Sierra-Johnson J, Romero-Corral A, Lopez-Jimenez F, George CF, Rapoport DM, Vogel RA, Khandheria B, Goldman ME, Roberts A, Somers VK. Sleep-disordered breathing, hypertension, and obesity in retired National Football League players. J Am Coll Cardiol. 2010;56:1432–3. doi: 10.1016/j.jacc.2010.03.099. [DOI] [PMC free article] [PubMed] [Google Scholar]
- 18.Grebla RC, Rodriguez CJ, Borrell LN, Pickering TG. Prevalence and determinants of isolated systolic hypertension among young adults: The 1999–2004 U.S. National Health and Nutrition Examination Survey. J Hypertens. 2010;28:15–23. doi: 10.1097/HJH.0b013e328331b7ff. [DOI] [PMC free article] [PubMed] [Google Scholar]
- 19.Go AS, Mozaffarian D, Roger VL, Benjamin EJ, Berry JD, Borden WB, Bravata DM, Dai S, Ford ES, Fox CS, Franco S, Fullerton HJ, Gillespie C, Hailpern SM, Heit JA, Howard VJ, Huffman MD, Kissela BM, Kittner SJ, Lackland DT, Lichtman JH, Lisabeth LD, Magid D, Marcus GM, Marelli A, Matchar DB, McGuire DK, Mohler ER, Moy CS, Mussolino ME, Nichol G, Paynter NP, Schreiner PJ, Sorlie PD, Stein J, Turan TN, Virani SS, Wong ND, Woo D, Turner MB. Heart disease and stroke statistics--2013 update: A report from the American Heart Association. Circulation. 2013;127:e6–e245. doi: 10.1161/CIR.0b013e31828124ad. [DOI] [PMC free article] [PubMed] [Google Scholar]
- 20.Wright JD, Hughes JP, Ostchega Y, Yoon SS, Nwankwo T. Mean systolic and diastolic blood pressure in adults aged 18 and over in the United States, 2001–2008. National health statistics reports. 2011:1–22. 24. [PubMed] [Google Scholar]
- 21.Antman EM, Bennett JS, Daugherty A, Furberg C, Roberts H, Taubert KA. Use of nonsteroidal antiinflammatory drugs: An update for clinicians: A scientific statement from the American Heart Association. Circulation. 2007;115:1634–1642. doi: 10.1161/CIRCULATIONAHA.106.181424. [DOI] [PubMed] [Google Scholar]
- 22.Kotchen TA, Cowley AW, Jr, Frohlich ED. Salt in health and disease--a delicate balance. N Engl J Med. 2013;368:1229–37. doi: 10.1056/NEJMra1212606. [DOI] [PubMed] [Google Scholar]
- 23.Miyachi M, Kawano H, Sugawara J, Takahashi K, Hayashi K, Yamazaki K, Tabata I, Tanaka H. Unfavorable effects of resistance training on central arterial compliance: A randomized intervention study. Circulation. 2004;110:2858–2863. doi: 10.1161/01.CIR.0000146380.08401.99. [DOI] [PubMed] [Google Scholar]
- 24.Kawano H, Tanimoto M, Yamamoto K, Sanada K, Gando Y, Tabata I, Higuchi M, Miyachi M. Resistance training in men is associated with increased arterial stiffness and blood pressure but does not adversely affect endothelial function as measured by arterial reactivity to the cold pressor test. Exp Physiol. 2008;93:296–302. doi: 10.1113/expphysiol.2007.039867. [DOI] [PubMed] [Google Scholar]
- 25.Kingwell BA. Large artery stiffness: Implications for exercise capacity and cardiovascular risk. Clin Exp Pharmacol P. 2002;29:214–7. doi: 10.1046/j.1440-1681.2002.03622.x. [DOI] [PubMed] [Google Scholar]
- 26.Sparrenberger F, Cichelero FT, Ascoli AM, Fonseca FP, Weiss G, Berwanger O, Fuchs SC, Moreira LB, Fuchs FD. Does psychosocial stress cause hypertension? A systematic review of observational studies. J Hum Hypertens. 2009;23:12–9. doi: 10.1038/jhh.2008.74. [DOI] [PubMed] [Google Scholar]
- 27.Bents RT, Tokish JM, Goldberg L. Ephedrine, pseudoephedrine, and amphetamine prevalence in college hockey players: Most report performance-enhancing use. The Physician Sportsmed. 2004;32:30–4. doi: 10.3810/psm.2004.09.551. [DOI] [PubMed] [Google Scholar]
- 28.Achar S, Rostamian A, Narayan SM. Cardiac and metabolic effects of anabolic-androgenic steroid abuse on lipids, blood pressure, left ventricular dimensions, and rhythm. Am J Cardiol. 2010;106:893–901. doi: 10.1016/j.amjcard.2010.05.013. [DOI] [PMC free article] [PubMed] [Google Scholar]
- 29.Lesser GT. Obesity in the NFL. JAMA. 2005;293:2999. doi: 10.1001/jama.293.24.2999-a. author reply. [DOI] [PubMed] [Google Scholar]