
Figure 6. Tumor cell adaptation to non-orthotopic tumor microenvironment.
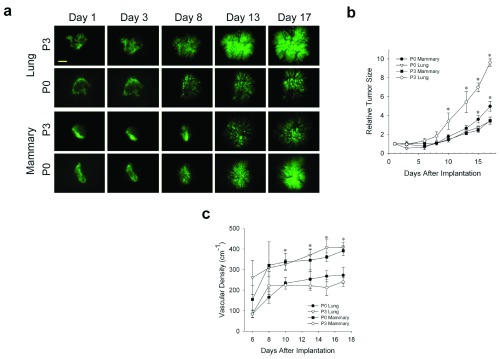
( a) N202 tumor spheroids were passaged 0 or 3 times on lung tissue, as described in methods, and implanted onto engrafted lung or fat pad tissue and monitored by IVM at the indicated times. ( b) Relative tumor growth curves. Tumor size was determined by measuring tumor area from fluorescence images on the indicated days and normalizing this relative to day 1 (see Methods). ( c) Tumor vascular density of the indicated passaged N202 tumor spheroid was also determined as described in the methods. Scale bar = 500 μm. Mean +/- SD are shown. * = p<0.05. n = 3–4 mice for all experiments.