

Abstract
The goal of this study was to test whether the “loss of the complexity” hypothesis can be applied to compare the metabolic patterns of mouse models with known differences in metabolic and endocrine function as well as life span. Here, we compare the complexity of locomotor activity and metabolic patterns (energy expenditure, VO2, and respiratory quotient) of the long-lived growth hormone receptor gene deleted mice (GHR− /−) and their wild-type littermates. Using approximate entropy as a measure of complexity, we observed greater metabolic complexity, as indicated by greater irregularity in the physiological fluctuations of the GHR− /− mice. Further analysis of the data also revealed lower energy costs of locomotor activity and a stronger relationship between locomotor activity and respiratory quotient in the GHR− /− mice relative to controls. These findings suggest underlying differences in metabolic modulation in the GHR− /− mice revealed especially through measures of complexity of their time-dependent fluctuations.
Key Words: Animal model, Metabolism, Longevity, Growth hormone.
Since the introduction of the loss of complexity hypothesis in aging and disease (1), there have been numerous studies that have demonstrated that aging leads to altered patterns of physiological activity. This seminal study demonstrated that although two individuals, one young and one old, could have the same mean and standard deviation in heart rate, that is, their beat-to-beat heart rate fluctuations, the manner in which the heart rate time series unfolded over time could not have been more different. The heart rate fluctuations of the young person were highly irregular making the time series more difficult to describe, changing on both short and long timescales, and thus making the data more “complex.” The old person, on the other hand, exhibited only slow, long-range fluctuations in heart rate, characterized by greater regularity over time, hence the “loss of complexity.”
Many studies have shown data consistent with the loss of complexity hypothesis, including data from motor behavior (see Morrison and Newell [2] for review) and other physiological variables (3). As a result, the loss of complexity is viewed as an indicator of declining health along the path to frailty (4), as the functional connections between different physiological systems or structures begin to weaken (5,6). An interesting issue that arises is whether increased physiological complexity can also be a marker of metabolic health. Effectively, if we were to test two individuals at the same chronological age, will a person who has the genetic potential to live longer exhibit greater complexity in their metabolic physiology in comparison with someone who does not?
A study of this type would be nearly impossible to conduct in humans owing to the length of the human life span and the many confounding variables of lifestyle including diet, exercise, socioeconomic status, etc. However, this kind of study is possible using animals that have a relatively short life span and known differences in longevity. Specifically, growth hormone receptor knockout mice (GHR− /−) are known to live significantly longer than their wild-type (WT) counterparts (7–9). Normally, growth hormone (GH) secretion declines during normal aging, which in turn results in lower insulin-like growth factor-1 levels. Yet, stable lines of dwarf mice with diminished GH/insulin-like growth factor-1 activity, such as GHR− /−, Ames, and Snell mice have increased longevity (10). This suggests that at least in part, the effects of aging are associated with declines in the GH/insulin-like growth factor-1 axis (9,11).
As a consequence of elimination of GH-induced signaling, the GHR− /− mice are dwarf in terms of both length and body mass, although they possess a higher proportion of fat mass (12–14). The mice are also insulin sensitive with low levels of insulin-like growth factor-1. Potentially, the increased life span of the GHR− /− mice is owed to an improved metabolic system (15) that results in lower fasting glucose and insulin levels in comparison with WT littermates (7,9). This difference persists even when the GHR− /− mouse is challenged with a high-fat diet (13,16). The intersection between the theoretical underpinnings of complexity and metabolic physiology is the concept of metabolic flexibility (see Galgani et al. [17] for a review). Effectively, a system with greater metabolic flexibility has a greater capacity to adapt to the availability of fuel substrates and switch between fuel sources to meet internal and external demands. Respiratory quotient (RQ), an indicator of the proportions of substrate utilization, thus becomes an important variable, especially when examined from the perspective of complexity.
Our current study also allows us to test whether metabolic flexibility and physiologic complexity could in fact be synonymous. In general, metabolic flexibility has been tested under challenging conditions such as the transition to fat from carbohydrate metabolism under a hyperinsulinemic clamp (17). Here, we examine whether metabolic flexibility can be captured through the dynamics of fluctuations in metabolic patterns over days. Related to the concept of complexity in physiology is a proposal that studying intraindividual variability provides greater insight into physiological health and well-being than averages of multiple physiological traces over time and across multiple animals. West (18) states that if the appropriate physiological intraindividual-dependent variables are selected and analyzed appropriately, there will be greater between-subjects variability and a stronger ability to detect group differences.
A second aspect to the comparison of metabolic flexibility between the GHR− /− and WT is the relationship between locomotor activity (LMA) and metabolic variables. It is an open question as to whether greater metabolic flexibility in the GHR− /− mice (19) is exclusively a function of inherent differences in metabolic physiology or if it associated with LMA both in terms of magnitude and fluctuations over time. One of our goals was to test whether differences exist in the LMA–metabolism relationship across the WT and GHR− /− mice. It is possible that GHR− /− exhibit greater complexity in LMA and also possess different levels of independence between fluctuations in LMA and the metabolic variables. The data presented here were published in a previous study (19) that compared daily energy balance, that is, feeding, energy expenditure (EE), LMA, and heat loss. The current study employs an entirely novel approach to analyzing and interpreting the LMA and metabolic data. Here, we compare differences in patterns of (i) LMA, (ii) EE, (iii) oxygen consumption (VO2), and (iv) RQ; between GHR− /− and WT littermates. Using conventional analyses (comparison of group mean differences) as well as nonlinear time series analysis, we will test two main hypotheses.
First, we test the hypothesis that complexity in LMA and the metabolic variables is higher in the GHR− /− mice than controls. Increased metabolic complexity is also indicative of greater metabolic flexibility as it demonstrates the capacity of the system to be modulated over shorter timescales. To date, virtually all of the studies that have examined metabolic physiology between GHR− /− and WT mice have focused on comparing between-animal or between-subjects variance (eg, using t tests or analyses of variance) but do not regularly examine within-subjects or intraindividual variability. The complexity of metabolic fluctuations provides insight into the underlying pattern of intraindividual variability over time. Second, we test the hypothesis that there is greater independence between LMA and EE in the GHR− /− mice when compared with WT animals. Conventionally, group averages of each variable are obtained over blocks of time and then subjected to correlation analysis, providing the between-subjects correlation. Here, we use a different approach, where we compare the intraindividual correlations between metabolic variables and LMA across the entire testing period and compare the strengths of the correlations between groups. This approach allows us to evaluate the degree to which they are modulated alongside LMA. Our results show a more complex pattern of fluctuations in the metabolic variables of the GHR− /− mice. Furthermore, we observed that the GHR− /− are more energy efficient in that they are able to traverse a greater distance with lower EE. Our data suggest that the GHR− /− mice modulate RQ as a function of LMA more so than the WT.
Methods
This study compared mice divided into two main cohorts; GHR− /− (n = 13) and WT (n = 12). All mice were female and 17 months old. The body mass (M ± SD) of the GHR− /− mice was 13.8 ± 1.4 g, whereas the body mass of the WT (M ± SD) was 31.2 ± 2.7 g. Nasoanal length was not measured in the original Longo and colleagues’ (19) study, but is a critical piece of information. As a result, we used approximate data obtained from an existing colony of GHR− /− and WT mice of the same age and sex, with the same number of mice (13 GHR− /−; 12 WT) in each group. The nasoanal length (M ± SD) of the GHR− /− mice was 6.1 ± 0.2 cm, whereas the nasoanal length of the WT (M ± SD) was 8.9 ± 0.2 cm.
Metabolic and LMA data were collected at 14-minute intervals over a continuous 4-day period, yielding 400 data points for data analysis using a 16-chamber indirect calorimetry system (Oxymax, Columbus Instruments, Columbus, OH). We selected the 4-day testing period as it was the longest possible period of time that the mice could be housed within the metabolic cages without having to be removed for cage cleaning or the replenishment of food to the hopper. Having a continuous stream of data that is undisrupted by external factors is particularly important for analysis of metabolic dynamics. The cages were maintained in a temperature- and humidity-controlled room and exposed to a 12-hour light/12-hour dark cycles. Each cage held one mouse, and ad libitum access to water and powdered chow (Lab Diet 5001, Purina, St. Louis, MO) was provided. The cage dimensions were 30 × 20 × 24cm (x, y, and z), and the interbeam distance in the x-axis was every 1.27cm, which was used to measure LMA. The calorimeter’s O2 and CO2 sensors were calibrated before each experiment using a compressed gas with a highly defined mixture of O2 and CO2. We calculated RQ as the quotient of CO2 production (VCO2) and O2 consumption (VO2). Body mass levels of the mice were also measured pre- and postcalorimetry, where only a 0.5% decline in body mass was observed across both groups of mice (see Table 1 from Longo et al. [19]), suggesting that the mice were acclimated to their new environment.
Table 1.
Summary of Results for the Group Comparisons of the Average Value of Each Dependent Variable Over the 4-Day Testing Period
| Dependent Variable | GHR− /− (M ± SD) | WT (M ± SD) | t(18) | p |
|---|---|---|---|---|
| LMA (No. of beam breaks)* | 310.6±55.0 | 467.8±130.1 | 3.88 | .002 |
| LMA (adjusted for nasoanal length) | 453.5±80.3 | 467.8±130.1 | 0.33 | .734 |
| VO2 (mL/kg/min)** | 99.5±10.5 | 72.9±4.6 | 8.29 | <.001 |
| RQ | 0.86 ± <0.0001 | 0.86 ± <0.0001 | 0.82 | .422 |
| EE (kcal/h)** | 0.29 ± <0.001 | 0.49±0.002 | 11.92 | <.001 |
Notes: EE = energy expenditure; LMA = locomotor activity; RQ = respiratory quotient; WT = wild-type.
Significance at *p < .01; **p < .001.
All procedures were approved by the Ohio University Institutional Animal Care and Use Committee. For more complete details of the experimental protocol, please refer to Longo and colleagues (19).
Conventional Measures
The means of all of the dependent variables over the testing period were obtained. In terms of LMA, beam breaks are collected on an absolute scale, that is, a set distance between two beams. These measures are identical to that of Longo and colleagues (19), to maintain consistency with our previous research, as were the EE calculations, measured as [(3.815 + (1.232 × RQ)) × VO2]. In addition, because the GHR− /− are dwarf mice and thus, considerably shorter than their WT counterparts, we conducted an additional comparison of mean LMA by correcting for the difference in nasoanal length of the two groups of mice, where the GHR− /− mice are approximately 68.5% shorter than the WT.
Correlation Analysis
Instead of testing for between-subjects correlations of mean LMA and metabolic variables, we conducted correlations between the dependent variables as a within-subjects analysis, as proposed by West (18). Pearson product-moment correlations for each individual animal were obtained over the testing period. Relationships between the dependent variables for each mouse provided r values that were later subject to statistical comparisons to detect significant group differences. The correlation and other analyses represent the novel approaches to data analysis employed in this current study.
Permutation Analysis
We conducted further analyses to determine the possibility that systematic outliers in the data led to significant group differences in the intraindividual correlation values. To test the probability of chance difference, we ran 1,000 random permutations of the data points of one variable while holding the other constant. These permutations were conducted on the data of each mouse. For each permutation, we compared the group r value means using a two-sample t test.
Approximate Entropy
To quantify the complexity or irregularity of the unit variance normalized (mean subtracted, divided by standard deviation) LMA and metabolic time series, we used approximate entropy (ApEn), as presented in Pincus and Singer (20) and Lipsitz and Goldberger (1).
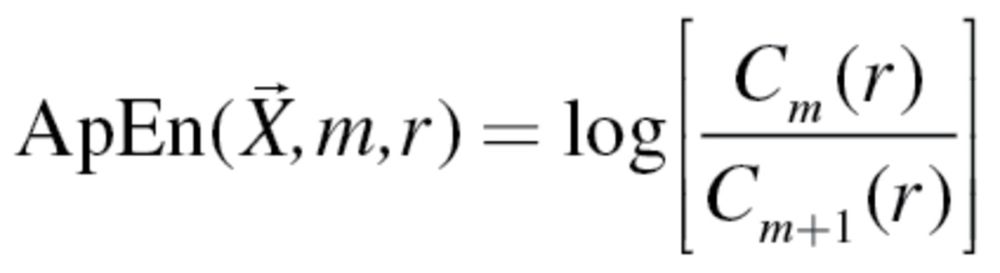 |
(1) |
The ApEn algorithm presented in equation (1) measures the log of the probability ratio of the recurrence of data points of length m within the threshold set by r. More specifically, C m(r) and C m+1(r) provide the average recurrence count of vectors of length m and m + 1, respectively, within a given time series X. Shorter vectors naturally have a higher likelihood of recurring as there will be more of them (eg, more pairs than trios) within any time series. If the time series has a regular pattern, values of C m(r) will be more similar to C m+1(r), indicative of greater similarity in their recurrence characteristics. If the time series is complex, the recurrence of the shorter vectors, as a ratio of the longer vectors will be much larger, yielding higher ApEn values. As recommended by Pincus and Singer (20), the value of m was set at 2, whereas r was set to 0.2.
Because EE is linearly derived from RQ and VO2, we used cross-approximate entropy (CrossApEn [21]) to measure joint unpredictability or asynchrony within the VO2 and RQ signals. CrossApEn uses the identical algorithm to ApEn, but, instead of comparing pairs of data points within a time series, it compares the recurrence of pairs of data points across two time series (see Hong et al. [22] for a more complete explanation). Thus, when CrossApEn values are high, the corecurrence of data across two time series is low, indicative of asynchronous fluctuations. When the corecurrence of data points is high, CrossApEn values are low, indicative of high levels of synchrony in the fluctuations of both variables.
Statistical Analysis
Comparisons between groups on all of the dependent variables were conducted using two-sample t tests assuming unequal variances in Microsoft Excel.
Results
Conventional Measures
On an absolute scale, the GHR− /− mice exhibited a significantly lower number of beam breaks during the testing period than the WT. However, once LMA is corrected for the fact that GHR− /− mice are approximately 68.5% shorter (unpublished data—see Methods section) than the WT mice, the difference is no longer apparent. This correction allows the treatment of the LMA as a relative measure, that is, in terms of the number of body lengths moved, as opposed to a distance measured in centimeters. During the testing period, the mean EE of the GHR− /− mice was significantly lower, whereas their mean VO2 was significantly higher than the WT mice. Results of the statistical analyses are summarized in Table 1.
Correlations
There were two statistically significant group differences in the intraindividual correlations across the dependent variables (Table 2). First, the mean correlation between LMA and RQ was significantly higher for the GHR− /− mice. Second, the mean correlation between LMA and EE was significantly lower for the GHR− /− mice. Interestingly, there were no significant group differences for the r values obtained across pairs of metabolic variables. Exemplar data obtained from a single mouse from each group with r values closest to their group mean were selected (Figure 1). Note the stronger relationship between LMA and RQ in the GHR− /− mouse and the stronger correlation between LMA and EE in the WT mouse in Figure 1.
Table 2.
Summary of Results for the Group Comparisons of the Average r Value Obtained From the Intraindividual Correlations Across the Dependent Variables
| r Value | GHR− /− (M ± SD) | WT (M ± SD) | t(18) | P |
|---|---|---|---|---|
| LMA–VO2 | 0.69±0.07 | 0.70±0.04 | 0.32 | .754 |
| LMA–RQ* | 0.42±0.12 | 0.21±0.28 | 2.49 | .025 |
| LMA–EE** | 0.47±0.02 | 0.62±0.11 | 3.21 | .004 |
| VO2–RQ | 0.31±0.12 | 0.34±0.17 | 0.35 | .731 |
| VO2–EE | 0.84±0.04 | 0.85±0.03 | 0.70 | .492 |
| RQ–EE | −0.23±0.13 | −0.19±0.17 | 0.70 | .491 |
Notes: EE = energy expenditure; LMA = locomotor activity; RQ = respiratory quotient; WT = wild-type.
Significance at *p < .05; **p < .01.
Figure 1.
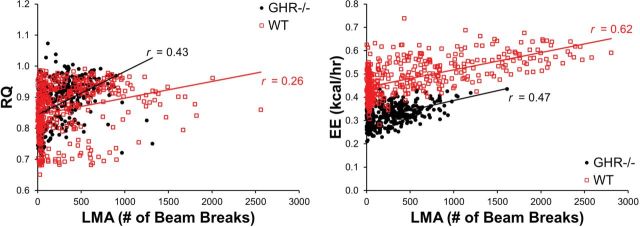
Exemplar scatterplots of intraindividual correlations between locomotor activity (LMA) and respiratory quotient (RQ; left panel) and LMA and energy expenditure (EE; right panel).
Permutation Analysis
The permutation analysis of the correlations revealed that there was a less than 5% likelihood of significant group differences for the LMA–EE (4.8%; average p value = .517) and LMA–RQ (4.5%; average p value = .498) correlations. Random permutations also eliminated the correlations between LMA and EE (average r value = −.0002) with a similar effect on LMA and RQ (average r value = −.0005).
Approximate Entropy
The complexity of two metabolic variables was significantly different between the two groups (Table 3). The GHR− /− mice exhibited significantly more complex patterns of VO2 and RQ over the testing period. There were no significant group differences, however, for LMA and EE complexity. Exemplar plots of the unit variance normalized VO2, RQ, and EE time series can be seen in Figure 2. Presented are data obtained from a single mouse from each group. The left and middle panels provide a visual illustration of higher ApEn values, where the GHR− /− exhibit a more unpredictable pattern of fluctuations in VO2 and RQ over time, but exhibit similarly unpredictable fluctuations in LMA.
Table 3.
Summary of Results for the Group Comparisons of the ApEn Values for Each of the Dependent Variables
| Dependent Variable | GHR− /− (M ± SD) | WT (M ± SD) | t(18) | p |
|---|---|---|---|---|
| LMA ApEn | 1.25±0.03 | 1.22±0.05 | 1.38 | .186 |
| VO2 ApEn* | 1.24±0.04 | 1.17±0.08 | 2.63 | .018 |
| RQ ApEn** | 1.10±0.07 | 0.95±0.09 | 4.72 | <.001 |
| EE ApEn | 1.25±0.04 | 1.26±0.04 | 0.65 | .524 |
Notes: ApEn = approximate entropy; EE = energy expenditure; LMA = locomotor activity; RQ = respiratory quotient; WT = wild-type.
Significance at *p < .05; **p < .001.
Figure 2.
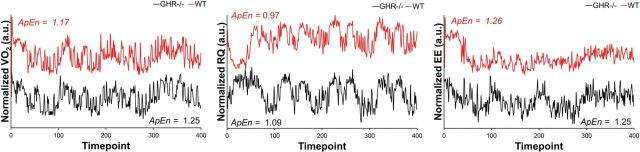
Exemplar plots from individual mice to illustrate differences and similarities in complexity across the different variables, normalized to unit variance. The left and middle panels show a difference in approximate entropy (ApEn), where the GHR− /− exhibit a more unpredictable pattern of fluctuations in VO2 and respiratory quotient (RQ) over time. The right panel shows energy expenditure (EE) fluctuations over time where ApEn values are virtually identical where both mice exhibit similarly unpredictable fluctuations. All of the data are presented on the same scale and have been offset in order to prevent the curves from overlapping. Data presented in arbitrary units (a.u.).
The CrossApEn results revealed significantly greater asynchrony (t(18) = 3.99; p < .001) between VO2 and RQ in the GHR− /− mice (2.02±0.004) in comparison with WT (1.93±0.002). Exemplar plots from a single mouse from each group can be seen in Figure 3.
Figure 3.
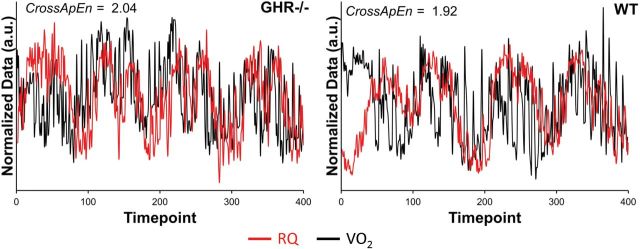
Exemplar unit variance normalized VO2–respiratory quotient (RQ) plots obtained from a single mouse from each group as an illustration of the differences in synchrony between the GHR− /− and wild-type (WT) mice. Visually, the WT data (left panel) exhibit clear areas of overlap and a general synchrony in their fluctuations. The GHR− /− fluctuations are not only more unpredictable but also have fewer regions where the data overlap. Furthermore, it is clear that the two variables seem to fluctuate more independently of one another. Data are presented in arbitrary units (a.u.) due to unit variance normalization to place both data sets on the same scale.
Discussion
The significant differences in ApEn values between the GHR− /− and WT mice provide evidence of the association between greater physiologic complexity and better health (1,4). This is reflected in the significantly higher ApEn values in the GHR− /− in comparison with the WT. This builds upon our previous work that found higher VO2 in WT and lower RQ in the GHR− /−, but only during the light phase when the mice were least active (19). These results are indicative of greater irregularity in VO2 and RQ fluctuations over the testing period. Churruca and colleagues (23) found a similar pattern of differences in blood glucose fluctuations over a 48-hour period when they compared healthy controls against insulin-dependent diabetics and people with metabolic syndrome. Blood glucose fluctuations were the most irregular in the healthy controls, followed by the participants with metabolic syndrome, with the diabetics exhibiting the least complex fluctuations. In addition, there is evidence to show that increased metabolic flexibility following habitual physical activity also led to decreased insulin variance, but increased RQ variance (24). This suggests that increased complexity in metabolic variables could be an indicator of better metabolic function and health. Our results provide convergent evidence that complex fluctuations in metabolic variables could be a marker of better health (1,4,23) and that the altered energy metabolism in GH mutant mice is likely to play a critical role in the aging process and life span (15).
One of the main benefits of using measures of complexity in physiology and behavior is that they are able to primarily distinguish high frequency and short timescale shifts in the data (1). This is viewed as a reflection of a physiological system’s capacity to respond more quickly and adapt to internal and external perturbations (4). Despite this, ApEn values for LMA and EE were not significantly different across the two groups. With regard to LMA, it suggests that both animals engage in physical activity with similar patterns. Interestingly, even though EE is linearly derived from both VO2 and RQ, we did not observe any significant difference between the groups. Moreover, we did not observe a significant group difference for the correlation between VO2 and RQ (see Table 2). The CrossApEn analysis of the VO2–RQ data revealed greater asynchrony in the fluctuation patterns of the GHR− /− mice.
What these findings show is that while on average, the VO2–RQ relationship is not different between the two groups, the manner in which their fluctuations are synchronized over time is different. The GHR− /− mice show greater independence between VO2 and RQ over time, as evidenced by higher CrossApEn values that are indicative of greater asynchrony. This finding supports the hypothesis of that “connectivity” or communication between different physiological systems is an important indicator of health, especially in aging (4–6). The permutation analysis gives us confidence that the significant differences in r values between groups were not obtained by chance or due to artifact from the calorimetry devices. After 1,000 random permutations, we observed significant group differences in less than 5% of all occasions, and also, the correlations between variables were near zero. One would speculate at this time that the modulation of VO2 and RQ differs across the two types of mice, potentially through different endocrine feedback loops, although further research will be needed to validate this idea. Further evidence of underlying differences in metabolic control can be seen in the significant r value differences between groups. On one hand, we observed significantly higher r values from the intraindividual correlations between LMA and EE in the WT mice. On the other, we observed higher rvalues for the GHR− /− mice for the correlation between LMA and RQ (see Table 2). What these correlation results illustrate is a situation where the WT mice modulate EE based on LMA levels, whereas the GHR− /− have a stronger association between RQ and LMA. This is suggestive of greater independence between physical activity demands and EE in the GHR− /− mice. This finding is also consistent with greater metabolic flexibility in the GHR− /− mice. Whereas the WT mice modulate EE as a function of LMA, there is greater RQ modulation of the proportion of metabolic substrate composition in the GHR− /− mice. These results present a case for the benefits of analyzing intraindividual patterns of variability as markers of health (18) while expanding upon our previous findings (19). Metabolic differences remained evident in the conventional comparisons of mean values drawn over the entire testing period, which is an extension of the prior work showing EE differences during both light and dark phases (19). On average, the WT mice have higher levels of EE and LMA, but lower VO2 levels. But, when corrected for body length, the difference in LMA dissipates. On an absolute scale, the WT cover traveled a greater distance over the testing period. However, when the difference in nasoanal length is accounted for, both groups of mice traveled a similar distance in terms of body length. An interesting aspect to the LMA differences is that the energy cost of moving the same relative distance is much lower for the GHR− /− mice. Using the mean LMA and EE values, the number of beam breaks per kilocalorie can be estimated. On average, the GHR− /− have 311 beam breaks every 14 minutes or 1,331 crossings per hour while expending 0.29 kcal/h. This would mean the GHR− /− mice would have 4,590 beam breaks per kilocalorie used. Using the same calculation, the WT mice would have 4,092 beam breaks per kilocalorie used. If corrected for body length, the GHR− /− would be able to achieve 6,751 beam breaks per kilocalorie, more than 1.5 times that of the WT. These data indicate a much lower energy cost of LMA for the GHR− /− in comparison with WT, on both an absolute and relative distance scale. However, in terms of mass, the WT mice have to move 2.25 times more body mass than the GHR− /− mice. Correcting for this would leave the GHR− /− mice with 3,000 beam breaks per kilocalorie, making the WT more efficient. This finding is consistent with Longo and colleagues (19) where GHR− /− mice were found to have higher EE during both light and dark phases, when body mass and LMA were used as covariates.
These corrections for body mass and length are important points to note as proportionally increasing LMA is a less efficient process in the GHR− /− where the slope of the LMA–EE relationship is much steeper in comparison with the WT (19). Thus, in terms of relative distance travelled, the GHR− /− mice are able to cover a greater distance on a single kilocalorie. But, if body mass is accounted for, the WT mice are more efficient. Moreover, it is less costly for the WT mice to proportionally increase their LMA. Further research is still needed to determine whether the source of differences in absolute and relative locomotor energy efficiency in the GHR− /− and WT arise from differences in physiological, biomechanical, or neuromuscular factors, or some combination of the three. Potentially, comparing ad-lib fed WT against calorie restricted and GHR− /− mice might yield greater insight into locomotor efficiency as it would allow a more in-depth examination of the role of body mass and composition alongside genetic differences. Although there is still much to be learned regarding LMA and metabolic efficiency, the critical point is that although the GHR− /− have higher energy demands to increase LMA, they are able to “make up the difference” on an absolute scale by having greater flexibility in modulating substrate utilization through RQ.
Our findings show that the long-lived GHR− /− mice exhibit increased metabolic complexity that is consistent with the idea that metabolic flexibility and physiologic complexity are markers of healthy aging. There are a few important conclusions that can be drawn results of this study. First, the GHR− /− differ in the number of calories used, but also in the fluctuation patterns of RQ and VO2 over time. Second, a stronger association between LMA and RQ in the GHR− /− mice affords greater metabolic flexibility. Third, the GHR− /− have greater independence between VO2 and RQ that leads to similar patterns of fluctuations in EE. Fourth, the bioenergetic cost of LMA in the GHR− /− mice is lower than the WT, especially when body length differences are taken into account. Fifth, there is reduced variance in intraindividual measures of metabolic complexity, as seen in the relatively small between-subjects standard deviation values.
One possible explanation for the increased metabolic complexity in the GHR− /− mice is that they have lower fasting insulin levels and increased insulin sensitivity (8), similar to WT animals that have undergone calorie restriction (25). It is important to note here that calorie restriction in GHR− /− mice in general does not lead to increased longevity and only female GHR− /− mice exhibit an increase in maximal life span (26). Insulin dynamics would be greatly improved in the GHR− /− as having greater insulin sensitivity and secreting less insulin will reduce the amount of time needed for insulin clearance and uptake (see Duckworth et al. [27] for a review). At an approximately similar age to the mice in our study, Panici and colleagues (28) have found lower insulin levels in GHR− /−, a difference that was maintained even with increased age (even though blood glucose levels were not different at this age and were in fact higher in the aged GHR− /− mice). What this suggests is that the metabolic complexity might decline with age at a slower rate in GHR− /− mice. Unfortunately, we do not yet have data at later ages in this study to test the effects of aging on metabolic complexity in both types of mice.
The higher the insulin level, the more time the body needs for its clearance. Slower rates of clearance are related to the “loss of complexity” in that adaptive responses will take longer to occur, leading to slower oscillations and more regular patterns within the data, consistent with the finding of reduced insulin variance following physical activity (24). Concomitantly, individuals with greater insulin sensitivity will be able to modulate both insulin and glucose along shorter timescales, leading to greater metabolic complexity, similar to the findings of Churruca and colleagues (23). Interestingly, altered insulin dynamics have recently been shown to be a marker of frailty in aging (29), suggesting that protecting insulin sensitivity and dynamics could be a component of healthy aging. Overall, our results are consistent with the loss of complexity hypothesis and raise the possibility that metabolic flexibility and complexity might be a component of the mechanisms that give rise to the extended life span in GHR− /− mice.
Funding
This work was supported by the National Institute on Aging (R21 AG035158 and R21 AG039818 to S.L.H.). A portion of this work was supported by the State of Ohio’s Eminent Scholar Program that includes a gift from Milton and Lawrence Goll, by National Institutes of Health grants AG031736 and DK083729, by the American Veterans, and by the Diabetes Institute at Ohio University to J.J.K.
Acknowledgment
We thank Elahu Gosney for his help on obtaining data related to the phenotypes of the GHR− /− mice and their physical characteristics.
References
- 1. Lipsitz LA, Goldberger AL. Loss of ‘complexity’ and aging. Potential applications of fractals and chaos theory to senescence. JAMA. 1992;267:1806–1809 [PubMed] [Google Scholar]
- 2. Morrison S, Newell KM. Aging, neuromuscular decline, and the change in physiological and behavioral complexity of upper-limb movement dynamics. J Aging Res. 2012;2012:891218. [DOI] [PMC free article] [PubMed] [Google Scholar]
- 3. Goldberger AL, Peng CK, Lipsitz LA. What is physiologic complexity and how does it change with aging and disease? Neurobiol Aging. 2002;23:23–26 [DOI] [PubMed] [Google Scholar]
- 4. Lipsitz LA. Dynamics of stability: the physiologic basis of functional health and frailty. J Gerontol A Biol Sci Med Sci. 2002;57:B115–B125 [DOI] [PubMed] [Google Scholar]
- 5. Vaillancourt DE, Newell KM. Changing complexity in human behavior and physiology through aging and disease. Neurobiol Aging. 2002;23:1–11 [DOI] [PubMed] [Google Scholar]
- 6. Hong SL. The dynamics of structural and functional complexity across the lifespan. Nonlinear Dynamics Psychol Life Sci. 2007;11:219–234 [PubMed] [Google Scholar]
- 7. Zhou Y, Xu BC, Maheshwari HG, et al. A mammalian model for Laron syndrome produced by targeted disruption of the mouse growth hormone receptor/binding protein gene (the Laron mouse). Proc Natl Acad Sci U S A. 1997;94:13215–13220 [DOI] [PMC free article] [PubMed] [Google Scholar]
- 8. Coschigano KT, Clemmons D, Bellush LL, Kopchick JJ. Assessment of growth parameters and life span of GHR/BP gene-disrupted mice. Endocrinology. 2000;141:2608–2613 [DOI] [PubMed] [Google Scholar]
- 9. List EO, Sackmann-Sala L, Berryman DE, et al. Endocrine parameters and phenotypes of the growth hormone receptor gene disrupted (GHR-/-) mouse. Endocr Rev. 2011;32:356–386 [DOI] [PMC free article] [PubMed] [Google Scholar]
- 10. Laron Z. Do deficiencies in growth hormone and insulin-like growth factor-1 (IGF-1) shorten or prolong longevity? Mech Ageing Dev. 2005;126:305–307 [DOI] [PubMed] [Google Scholar]
- 11. Bartke A, Chandrashekar V, Dominici F, et al. Insulin-like growth factor 1 (IGF-1) and aging: controversies and new insights. Biogerontology. 2003;4:1–8 [DOI] [PubMed] [Google Scholar]
- 12. Berryman DE, List EO, Coschigano KT, Behar K, Kim JK, Kopchick JJ. Comparing adiposity profiles in three mouse models with altered GH signaling. Growth Horm IGF Res. 2004;14:309–318 [DOI] [PubMed] [Google Scholar]
- 13. Berryman DE, List EO, Kohn DT, Coschigano KT, Seeley RJ, Kopchick JJ. Effect of growth hormone on susceptibility to diet-induced obesity. Endocrinology. 2006;147:2801–2808 [DOI] [PubMed] [Google Scholar]
- 14. Berryman DE, List EO, Palmer AJ, et al. Two-year body composition analyses of long-lived GHR null mice. J Gerontol A Biol Sci Med Sci. 2010;65:31–40 [DOI] [PMC free article] [PubMed] [Google Scholar]
- 15. Brown-Borg HM, Bartke A. GH and IGF1: roles in energy metabolism of long-living GH mutant mice. J Gerontol A Biol Sci Med Sci. 2012;67:652–660 [DOI] [PMC free article] [PubMed] [Google Scholar]
- 16. Bellush LL, Doublier S, Holland AN, Striker LJ, Striker GE, Kopchick JJ. Protection against diabetes-induced nephropathy in growth hormone receptor/binding protein gene-disrupted mice. Endocrinology. 2000;141:163–168 [DOI] [PubMed] [Google Scholar]
- 17. Galgani JE, Moro C, Ravussin E. Metabolic flexibility and insulin resistance. Am J Physiol Endocrinol Metab. 2008;295:E1009–E1017 [DOI] [PMC free article] [PubMed] [Google Scholar]
- 18. West BJ. Where Medicine Went Wrong: Rediscovering the Path to Complexity. Hackensack, NJ: World Scientific; 2006 [Google Scholar]
- 19. Longo KA, Berryman DE, Kelder B, et al. Daily energy balance in growth hormone receptor/binding protein (GHR -/-) gene-disrupted mice is achieved through an increase in dark-phase energy efficiency. Growth Horm IGF Res. 2010;20:73–79 [DOI] [PMC free article] [PubMed] [Google Scholar]
- 20. Pincus SM, Singer BH. Randomness and degrees of irregularity. Proc Natl Acad Sci U S A. 1996;93:2083–2088 [DOI] [PMC free article] [PubMed] [Google Scholar]
- 21. Pincus SM. Approximate entropy as a measure of system complexity. Proc Natl Acad Sci U S A. 1991;88:2297–2301 [DOI] [PMC free article] [PubMed] [Google Scholar]
- 22. Hong SL, Manor B, Li L. Stance and sensory feedback influence on postural dynamics. Neurosci Lett. 2007;423:104–108 [DOI] [PubMed] [Google Scholar]
- 23. Churruca J, Vigil L, Luna E, Ruiz-Galiana J, Varela M. The route to diabetes: loss of complexity in the glycemic profile from health through the metabolic syndrome to type 2 diabetes. Diabetes Metab Syndr Obes. 2008;1:3–11 [DOI] [PMC free article] [PubMed] [Google Scholar]
- 24. Bergouignan A, Rudwill F, Simon C, Blanc S. Physical inactivity as the culprit of metabolic inflexibility: evidence from bed-rest studies. J Appl Physiol. 2011;111:1201–1210 [DOI] [PubMed] [Google Scholar]
- 25. Heilbronn LK, Ravussin E. Calorie restriction and aging: review of the literature and implications for studies in humans. Am J Clin Nutr. 2003;78:361–369 [DOI] [PubMed] [Google Scholar]
- 26. Bonkowski MS, Rocha JS, Masternak MM, Al Regaiey KA, Bartke A. Targeted disruption of growth hormone receptor interferes with the beneficial actions of calorie restriction. Proc Natl Acad Sci U S A. 2006;103:7901–7905 [DOI] [PMC free article] [PubMed] [Google Scholar]
- 27. Duckworth WC, Bennett RG, Hamel FG. Insulin degradation: progress and potential. Endocr Rev. 1998;19:608–624 [DOI] [PubMed] [Google Scholar]
- 28. Panici JA, Wang F, Bonkowski MS, et al. Is altered expression of hepatic insulin-related genes in growth hormone receptor knockout mice due to GH resistance or a difference in biological life spans? J Gerontol A Biol Sci Med Sci. 2009;64:1126–1133 [DOI] [PMC free article] [PubMed] [Google Scholar]
- 29. Kalyani RR, Varadhan R, Weiss CO, Fried LP, Cappola AR. Frailty status and altered glucose-insulin dynamics. J Gerontol A Biol Sci Med Sci. 2012;67:1300–1306 [DOI] [PMC free article] [PubMed] [Google Scholar]