

Abstract
Background.
The effects of bed rest on the dysregulation of fatty acid and glucose metabolism have not been addressed in the older population.
Objective.
We examined the effect of 10 days of bed rest on fatty acid kinetics and hepatic and peripheral insulin resistance in aging.
Methods.
We utilized an octreotide, basal glucagon replacement, multistage insulin infusion, and the concomitant infusion of [6,6 2H2]glucose to derive insulin-mediated suppression of glucose production and insulin-stimulated glucose disposal in nine older, overweight individuals (body mass index 28.1 ± 1.7 kg m−2; 39.9% ± 1.9% fat). During the multistage insulin infusion, we also infused [1-13C]palmitate to examine free fatty acid rate of appearance (R a).
Results.
Body weight, % body fat, and energy metabolism did not change with bed rest. There was a significant decrease (−2291 ± 316cm3) in visceral fat, and no change in abdominal subcutaneous fat with bed rest. Insulin-mediated suppression of glucose production was modest prior to bed rest and was further reduced (>15% ± 2%) by bed rest. There was also a minor decrease in the insulin-mediated suppression of free fatty acid R a after bed rest and, as a consequence, a small variation in plasma free fatty acid from pre- to post-bed rest in the first stage of the multistage insulin infusion. There was also a significant bed rest–induced decline (>2.0 ± 0.6 mg kg FFM−1 min− 1) in insulin-stimulated glucose disposal.
Conclusions.
Preexisting impairments in insulin sensitivity are worsened by bed rest and seem linked to alterations in the regulation of free fatty acid in older, overweight individuals.
Key Words: Inactivity, Hospitalization, Metabolic disease.
Older individuals are often forced to move to a long-term care facility (1), and this change in lifestyle status may lead to an increase in morbidity and mortality (2). These risks are compounded by a reduction in physical activity, which has been shown to precipitate the onset of insulin resistance and the degradation of skeletal muscle in younger individuals (3). Unfortunately, the deleterious influence of bed rest on metabolism has not been evaluated in older adults. Our study sought to examine potential changes in the regulation of glucose and fatty acid metabolism that might be affected by bed rest due to clinical events such as hospitalization, surgery, and hip fracture in the absence of any pre existing co morbidities.
A recent review has promoted the assertion that physical inactivity may promote the concomitant development of insulin resistance, impairments in lipid trafficking, alterations in substrate utilization, and increased deposition of intracellular lipid (4). Moreover, the overall elevation in plasma free fatty acids (FFA) might stem from this “metabolic inflexibilty,” and have a chronic, detrimental influence on the worsening of hepatic and peripheral insulin resistance (5). For example, excess FFA promotes an increase in hepatic-derived very low–density lipoprotein (VLDL) (6) and the excessive deposition of hepatic lipid, highlighting the important role of the liver in the etiology of insulin resistance (7). Although bed rest studies in young individuals describe insulin resistance in presence of decreased lipolysis (8), the effects of bed rest on insulin resistance and FFA metabolism have not been evaluated in older individuals. Therefore, we hypothesized that short-term bed rest would result in the acute onset of hepatic and peripheral insulin resistance and would be potentiated by changes in FFA metabolism in this segment of the population. If short-term bed rest does promote these physiological perturbations, countermeasures must be developed to offset these detrimental clinical consequences.
We utilized a continuous octreotide, basal glucagon replacement, and a multistage insulin infusion (MSI) designed to examine hepatic and peripheral insulin resistance prior to and immediately following 10 days of strict bed rest. The MSI was combined with the infusion of [6,6 2H2]glucose and [1-13C]palmitate and subsequent plasma analysis by gas chromatography/mass spectrometry to derive rates of endogenous glucose production (glucose R a) and free fatty acid rate of appearance (FFA R a), respectively.
Methods
Participants
We recruited participants between the ages of 60–85 years (seven female participants/one male participant) within a body mass index range of 20–35 kg m−2 (Table 1). All participants were weight stable and ranged between normal glucose tolerance and impaired glucose tolerance (9). Participants underwent a physical examination, which included a medical history, electrocardiogram, and blood chemistries. A maximal exercise test was utilized for the determination of VO2 peak. Participants taking medicines or supplements that might have had potential effects on metabolism were excluded. Each participant provided written informed consent, and study procedures were approved by the Institutional Review Board of the University of Arkansas for Medical Sciences.
Table 1.
Clinical Characteristics
| Pre-bed rest | Post-bed rest | |
|---|---|---|
| Weight (kg) | 74.2±5.9 | 73.0±6.0 |
| Body mass index (kg m−2) | 28.1±1.7 | 27.7±1.7 |
| % Body fat | 39.9±1.9 | 40.9±2.1 |
| Trunk fat (kg) | 14.8±1.5 | 14.7±1.6 |
| Abdominal subcutaneous fat (cm3) | 160±28 | 167±34 |
| Visceral fat (cm3) | 186±28 | 163±26* |
| VO2 peak (L min−1) | 1.4±0.1 | 1.3±0.1* |
| Fasting plasma glucose (pg mL−1) | 95.5±5.7 | 105.1±4.4* |
| 120-min Oral Glucose Tolerance test (pg mL−1) | 112.5±6.1 | 120.3±7.2 |
| Basal plasma insulin (μU mL−1) | 6.7±1.8 | 7.3±1.1 |
| “Mild” plasma insulin (μU mL−1) | 16.6±2.3 | 17.4±2.3 |
| “Moderate” plasma insulin (μU mL−1) | 83.2±11.0 | 100.6±11.9 |
*Significant difference from pre- to post-bed rest (visceral fat: p = .01; VO2 peak: p = .001; fasting plasma glucose p = .005).
Experimental Protocol
The entire study protocol entailed ~100 study days. This included a screening visit, 10 days of bed rest, and ~3 months of rehabilitation. Participants were initiated into the study utilizing the University of Arkansas for Medical Sciences Clinical Research Services Core. A pre-bed rest MSI study was performed, and the participants adhered to 10 days of strict bed rest (meaning that volunteers did not get out of bed except to utilize a bedside commode), utilizing inpatient services in the hospital. Nursing services were utilized to maintain appropriate hygiene. On Day 10 of bed rest, a post-bed rest MSI was performed.
Dietary Control
In order to control for variations in dietary intake (10,11), all participants consumed a eucaloric diet, providing the protein recommended daily intake of 0.8 g kg–1 d–1 throughout the dietary stabilization and bed rest periods. Protein was a lacto-ovo vegetarian form during diet stabilization and bed rest (12,13). The nonprotein macronutrient components of the diet provided approximately 60% energy from carbohydrate and 40% from fat. The diet consisted of a 3d rotation designed to maintain body weight throughout the study. An activity factor of 1.6 during diet stabilization (study days 1–8; Table 2) and 1.3 during bed rest (study days 9–19) was used to estimate daily energy requirement according to the following equation: energy requirement (kcal) = [66 + (13.7 × weight in kg) + (5 × height in cm) − (608 × age in y)] × activity factor.
Table 2.
Plasma Lipids
| Pre-bed rest | Post-bed rest | |
|---|---|---|
| Total cholesterol (mg dL−1) | 197±11 | 195±5 |
| Triglycerides (mg dL−1) | 110±16 | 145±7* |
| High-density lipoprotein: HDL (mg dL−1) | 53±3 | 46±4 |
| Very low–density lipoprotein: VLDL (mg dL−1) | 20±1 | 29±1* |
| Low-density lipoprotein: LDL (mg dL−1) | 122±9 | 124±6 |
| LDL/HDL | 2.3±0.1 | 2.8±0.1* |
*Significant difference from pre- to post-bed rest (triglycerides: p = .04; LDL/HDL: p = .02; VLDL: p = .001).
Octreotide, Basal Glucagon Replacement, and MSI
Following an overnight fast, an intravenous catheter was placed in a peripheral vein for infusion purposes. In order to obtain plasma samples, a second venous catheter was placed in a hand vein using the heated hand technique. Blood samples were collected to determine the background enrichments of plasma glucose and palmitate. To measure basal glucose R a and insulin-mediated suppression of glucose production (ISGP), a priming dose (3.27 mg kg−1 of [6,6 2H2]glucose) was administered, followed by an infusion of 0.22 µmol kg− 1 min− 1 from time = −120 to 120 min and then increased to 0.44 µmol kg− 1 min− 1 from time = 120 to 240min to minimize changes in plasma glucose enrichment (14). We also infused [1-13C]palmitate (0.44 µmol kg− 1 min− 1) at t = −60 to 0, 60 to 120, and 180 to 240 of the MSI. Infusions of octreotide (60 ng kg− 1 min− 1), and glucagon (0.65 ng kg− 1 min− 1) were started at t = 0 minute and continued throughout the clamp. Insulin was infused at a rate of 0.25 mU kg− 1 min− 1 from t = 4 to 120 minute (first stage) to evaluate ISGP, and 1.0 mU kg− 1 min− 1 from time = 120 to 240 minute in the second stage to evaluate insulin-stimulated glucose disposal (ISGD). In the second stage of the MSI, we increased the insulin infusion to 1.0 mU kg− 1 min− 1 to examine ISGD or peripheral insulin sensitivity. Euglycemia was maintained by a variable 20% dextrose infusion during the second stage and spiked with 8mg of [6,6 2H2]glucose g−1 of dextrose to prevent an underestimation of glucose R a (15).
Plasma glucose was measured every 5–10 minutes by the glucose oxidase method (Glucose Analyzer 2, Beckman Coulter Inc., Brea, CA). The insulin infusion rate in the first stage was representative of plasma insulin ~twofold greater than fasting levels, and provided an ideal scenario to measure insulin-stimulated suppression of glucose R a by mild hyperinsulinemia (12).
Blood samples were collected every 20min during the MSI, centrifuged for 20min at 4ºC, and stored at –70ºC for future analysis. Plasma insulin concentrations were determined using a double-antibody system (13). Plasma deproteinization and purification were completed, and glucose enrichments were determined using gas chromatography/mass spectrometry analysis (Agilent Technologies, Palo Alto, CA) (16).
Calculations
Glucose R a was calculated for the basal period and modified for transitions in steady-state conditions (18) using the original equations of Steele (19). ISGP was calculated as 1 − (mild hyperinsulinemia glucose R a/basal glucose R a) × 100, and indicates the degree of glucose R a suppressed under basal glucagon/mild hyperinsulinemic conditions. Using this approach, ISGP reflects hepatic insulin sensitivity. In the second stage of the MSI, ISGD was determined during the last 30 minutes of the 240 minute clamp.
The plasma FFA concentration was determined by the gas chromatography/mass spectrometry analysis of the seven individual fatty acids. FFA R a was then calculated by dividing palmitate R a by fractional contribution of palmitate to the plasma FFA concentration (16).
Energy Expenditure
The metabolic rate was measured during each MSI study by indirect calorimetry at t = −120 to −90 minutes for basal period and t = 210–240 minutes for the hyperinsulinemic period (Vmax 29N, Sensormedics, Yorba Linda, CA).
Aerobic Capacity Test
An exercise stress test was performed pre- and post-bed rest to determine VO2 peak on a bicycle ergometer (Lode, Groningen, Netherlands) (12). Respiratory gases were collected and analyzed using indirect calorimetry (Vmax 29N, Sensormedics).
Body Weight and Body Composition
Body mass, height, and body composition testing were measured during pre- and post-bed rest testing sessions. Body composition was measured by dual energy x-ray absorptiometry using a Hologic QDR 2000 densitometer (Hologic Inc., Bedford, MA) (12). A lateral scout was used to identify the L4–L5 vertebral disc space, and a cross-sectional 10 mm scan was obtained using 280 mA (17). Total visceral adipose tissue (VAT) was determined using public domain imaging software (National Institutes of Health). VAT was highlighted and computed using an attenuation range of −190 to −30 Hounsfield units (HU). Total abdominal subcutaneous adipose tissue cross-sectional area was determined by identifying the area between the skin and the external-most aspect of the abdominal muscle wall. The computed tomography images obtained were digitized by Hounsfield units density to separate fat, muscle, and bone compartments using the National Institutes of Health image program on a Macintosh Centris 660av computer. In our laboratory, the coefficient of variation for the measurement of fat area is 1.0%–1.5% (20).
Statistical Analyses
Statistical comparisons regarding ISGP, ISGD, FFA R a, insulin, and FFA concentrations between groups and over time were made using two-way analysis of variation designed to account for repeated measures. Tukey post hoc tests were applied to significant group × time interactions. Statistical comparisons regarding anthropometrics, VO2 consumption, energy expenditure, fuel oxidation, and plasma lipids were made using paired t tests. Data are reported as means ± SEM.
Results
Participants
We enrolled 7 female older volunteers and 1 male older volunteer (64 ± 3 y), and all participants were able to comply with the study protocol (Table 1). There were no dropouts.
Anthropometrics
Body weight, body mass index, and body composition were not changed (Table 1). Although there was no change in abdominal subcutaneous adipose tissue, there was a small reduction in VAT (p = .01) (Table 1).
Maximal Exercise Test
Basal VO2 consumption was equivalent at pre- and post-bed rest. However, bed rest induced a significant decrease in VO2 peak (p = .001) (Table 1).
Plasma Lipids
Although total cholesterol was unchanged, plasma triglycerides increased (p = .03) with bed rest (Table 2). There were no significant changes in low-density lipoprotein or high-density lipoprotein, but low-density lipoprotein/high-density lipoprotein ratio and VLDL were increased (p = .02; p = .001) (Table 2).
Plasma Insulin
Insulin was similar at baseline, and insulin increased similarly during the first and second stages of the MSI pre- and post-bed rest (Table 1).
Energy Expenditure and Fuel Utilization
Basal energy expenditure, respiratory exchange rate (RER), and fuel utilization were not different under pre- and post-bed rest conditions (Table 3). Although glucose oxidation increased from basal to moderate hyperinsulinemic conditions, the change was not different at pre- and post-bed rest (Table 3).
Table 3.
Energy and Fuel Selection
| Pre-bed rest | Post-bed rest | |
|---|---|---|
| Energy expenditure: basal (kcal) | 1861±132 | 1867±139 |
| Energy expenditure: hyperinsulinemia (kcal) | 1424±93 | 1433±117 |
| Respiratory exchange ratio: basal | 0.84±0.01 | 0.86±0.02 |
| Respiratory exchange ratio: hyperinsulinemia | 0.94±0.1 | 0.93±0.02 |
| Carbohydrate oxidation: basal (% of total) | 53±8 | 55±7 |
| Carbohydrate oxidation: hyperinsulinemia (% of total) | 83±4 | 76±7 |
| Fat oxidation: basal (% of total) | 47±8 | 45±7 |
| Fat oxidation: hyperinsulinemia (% of total) | 17±4 | 24±7 |
Glucose Metabolism
Fasting plasma glucose increased significantly with bed rest (p = .005). Basal glucose R a was not different between pre- and post-bed rest conditions. ISGP decreased significantly from pre-bed rest (24% ± 6%) to post-bed rest (8% ± 3%) conditions (p = 04; Figure 1), and there was also a significant decline in ISGD with bed rest (−2.0 ± 0.6 mg kg FFM− 1 min− 1; p = .01; Figure 2).
Figure 1.

Insulin-stimulated suppression of glucose R a under pre- and post-bed rest conditions. *Denotes a significant reduction.
Figure 2.

Insulin-stimulated glucose disposal under pre- and post-bed rest conditions. *Denotes a significant reduction.
Fatty Acid Metabolism
Basal FFA R a was not different between pre- and post-bed rest conditions. FFA R a did not change during the first stage of MSI but increased (p = .02) in the second stage of the MSI under pre-bed rest conditions (Figure 3). Under post-bed rest conditions, there was a significant increase in FFA R a during the first stage (p = .03) and second stage (p = .01) of the MSI. There was also a significant difference between pre- and post-bed rest plasma FFA in the first stage of MSI (p < .05) (Figure 4).
Figure 3.
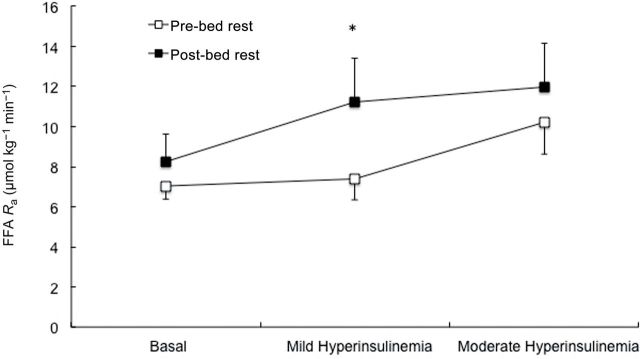
Total free fatty acid rate of appearance under basal, and mild and moderate hyperinsulinemia during the pre- and post-bed rest conditions of the multistage insulin infusion. *Denotes a significant increase from preintervention to postintervention.
Figure 4.
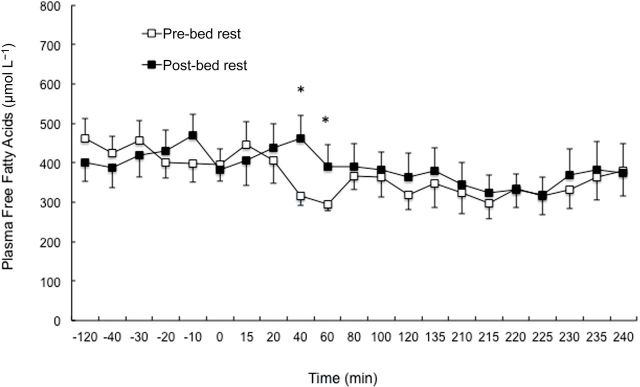
Plasma free fatty acid concentrations under basal, and mild and moderate hyperinsulinemia during the pre- and post-bed rest conditions of the multistage insulin infusion. *Denotes a significant increase from preintervention to postintervention.
Discussion
This is the first report that describes changes in hepatic and peripheral insulin sensitivity prior to and immediately following bed rest in older, overweight individuals. We found hepatic insulin resistance that worsened significantly with bed rest. Moreover, this coincided with the maintenance of FFA levels despite hyperinsulinemia. Based on stable FFA concentrations throughout the MSI, FFA R a also worsened with bed rest suggesting increased lipid removal from the circulation. Peripheral insulin resistance was modest under pre-bed rest conditions but worsened with bed rest. We also noted an elevation in fasting plasma glucose with 10 days of bed rest. In addition, plasma triglycerides, VLDL, and the low-density lipoprotein/high-density lipoprotein ratio increased significantly with bed rest. This further supports the notion that the dysregulation of glucose and fat metabolism in older individuals is interrelated and that the etiology of this physiological condition worsens significantly with acute onset of bed rest.
We have previously compared the pitfalls of indirect estimates of insulin sensitivity (21). We have now replicated mild and moderate hyperinsulinemia under pre- and post-bed rest conditions using the MSI procedure. Because it has also been demonstrated that changes in physical activity can affect insulin kinetics (22), we utilized octreotide to suppress endogenous insulin secretion and delivered exogenous insulin infusion rates that yielded equivalent insulin concentrations under pre- and post-bed rest conditions. Therefore, the MSI enabled us to evaluate changes in ISGP, ISGD, and FFA R a pre- and post-bed rest without the complication of different insulin and glucagon concentrations. The MSI was also combined with the application of stable isotope tracer methodology. We were then able to determine the impact of bed rest on FFA kinetics, and ISGP and ISGD in older, overweight individuals. It is also important that the examination of these variables closely replicated the actual physiological scenario(s) in this population where the regulation of metabolism might be compromised (20,23).
The proposed mechanisms by which impairments in insulin-mediated suppression of FFA R a potentially induce insulin resistance are complex. Despite the modest reduction in VAT following bed rest, the importance of hepatic lipid deposition and not VAT per se on the etiology of insulin resistance in the liver was evident (7). We are not aware of any physiological rationale for the decrease in VAT, and the inclusion of computed tomography–derived appendicular data would have been interesting given the divergent responses of VAT compared with abdominal subcutaneous adipose tissue. Alterations in lipid availability/energy demand might have led to an increase in circulating levels of FFA, and this may have had a negative influence on insulin’s ability to shut off hepatic glycogenolysis (24). Moreover, derangements in fatty acid metabolism/energy demand affect regulation of gluconeogenesis with only small changes in insulin being necessary to lower FFA concentrations in the normal healthy condition (25). However, greater impairments in insulin-mediated suppression of lipolysis may exist in older individuals (26).
Our current data regarding ISGP corroborates with reports of bed rest–induced hepatic insulin resistance in younger, healthy individuals (8). Similar to our study, these authors reported elevations in plasma triglycerides and VLDL after 9 days of physical inactivity. It has been suggested that the accumulation of lipid may be augmented by decreased physical activity, and this could ultimately enhance hepatic lipogenesis (27). Although previous studies comparing younger and older lean individuals described similar rates of lipid kinetics (28), these measurements were conducted under basal insulin concentrations. In our study, the hyperinsulinemic environment did not effectively suppress FFA levels as evidenced by very little change in plasma FFA and an elevation of FFA R a. This impairment supports the notion that hepatic lipid clearance may be accelerated in older individuals. Therefore, increased FFA R a under hyperinsulinemic conditions may have promoted bed rest–induced increases in triglycerides, VLDL, and the ratio of low-density lipoprotein/high-density lipoprotein (29).
The majority of studies examining the influence of bed rest on insulin sensitivity have focused primarily on muscle (30). The importance of muscle may have been fostered by studies where bed rest–induced decreases in glucose tolerance were remitted as soon as the patients resumed ambulation (31). These were followed up by employing the use of the euglycemic clamp procedure, demonstrating an adverse influence on whole-body glucose utilization (eg, 80% derived from skeletal muscle) (32). Bed rest promoted peripheral insulin resistance in this study, but the impact is, while significant, not as profound as originally anticipated. VO2 peak was relatively low prior to bed rest and decreased with bed rest. Given the low oxidative capacity of our older, overweight volunteers, one might have been hypothesized a preferential shift toward increased carbohydrate oxidation (33). This is supported by the accumulation of muscle fat following bed rest in lean individuals (34). On the contrary, bed rest did not foster a change in metabolic inflexibility or muscle lipid in older, overweight adults. Nonetheless, the ectopic accumulation of diacylglycerol, increased inflammation, and/or cellular stress indicators may have promoted a greater degree of peripheral insulin resistance (5). This certainly falls in line with recent studies in transgenic mice that connect increased FFA delivery/reesterification to increased expression of acyl-CoA:diacylglycerol acyltransferase1 that exceeded mitochondrial fatty acid oxidation. In these studies, alterations in delivery/reesterification led to an increase in muscle diacylglycerol content that was directly associated with peripheral insulin resistance (35). On the other hand, lowering plasma lipids with the use of peroxisome proliferator-activated receptor-alpha agonists had no impact on insulin sensitivity in elderly individuals (36).
Dietary control is another factor worthy of consideration since the deficiency or lack of nutrients can affect the regulation of metabolism (30). For example, the consumption of a high-fat diet during 60 hourof bed rest reduced whole-body insulin sensitivity by ~24%, and individuals fed a high-carbohydrate diet preserved their insulin sensitivity (37). In our study, where 60% of the nonprotein macronutrient intake was provided in the form of carbohydrate, bed rest promoted insulin resistance in the liver and skeletal muscle. This contrasts somewhat with the earlier studies in younger populations where decreasing the availability of dietary fat seemed to have a protective influence on the incidence of insulin resistance (37).
In our previous bed rest studies, we have observed the onset of intracellular deposition of triglycerides in both the liver and muscle (21) and that this corresponds to the development of insulin resistance in normal participants (37). In this study where insulin sensitivity was less than half of previously reported values in normal healthy individuals (38), the glucose and FFA kinetic data, coupled with the substrate oxidation data (Table 3), provides insight into the mechanism responsible for the deposition of intracellular lipid with bed rest. The provision of exogenous glucose in the context of the hyperinsulinemic clamp stimulated glucose oxidation, even in the presence of insulin resistance. The stimulation of glucose oxidation in the insulin resistant state is consistent with previous observations that the capacity to oxidize glucose may be normal when the hypoglycemic influence of insulin is attenuated (39). Further, when glucose oxidation is accelerated, a decrease in fatty acid oxidation is expected, even when FFA availability is high (40). The anticipated level of insulin-stimulated suppression of FFA R a was absent in our older, obese individuals. Therefore, fatty acid oxidation may have reduced even though FFA availability remained relatively constant.
In conclusion, the results of this study demonstrate that unique abnormalities in insulin-mediated suppression of FFA R a exist in older, overweight individuals, and this may be related to marked impairments in ISGP. Second, bed rest impairs insulin-mediated suppression of FFA R a and ISGP, and also contributes to significant reductions in ISGD. As previously suggested by Boden and coworkers (24), we propose that the alteration of FFA metabolism may contribute to insulin’s compromised ability to inhibit glucose R a and may to a lesser extent also promote ISGD in older, overweight individuals. Future studies are needed to evaluate lipid trafficking into adipose tissue, liver, and skeletal muscle, and determine the role of changes in inflammation that occur in adipose tissue. This is important because these abnormalities are potentially promoting metabolic dysregulation in this specific population in the context of clinical care. Otherwise, it will be difficult to develop effective countermeasures that might be used to mitigate the acceleration of metabolic risk in older, obese individuals.
Funding
Supported by National Institute of Health grant (PO1 AG023591-01 to W.J.E., KO1 DK 64716-01 to R.H.C.) and American Heart Association grant (SDA 0335172N to R.H.C., M01 RR14288).
Disclosure
The authors have nothing to disclose.
Acknowledgments
We extend our gratitude to Oumitana Kajkenova, Bea Zoer, and Leizleigh Robinette for their clinical support and our appreciation to the University of Arkansas for Medical Sciences Translational Research Institute. We also extend our gratefulness to our volunteers for their efforts.
References
- 1. Anonymous HCUPnet, Healthcare Cost and Utilization Project. Rockville, MD: Agency for Healthcare Research and Quality; 2003. http://www.ahrq.gov/data/acup/hcupnet.htm Accessed May 2, 2012. [Google Scholar]
- 2. Bortz WM., 2nd Disuse and aging. JAMA. 1982;248:1203–1208 [PubMed] [Google Scholar]
- 3. Stuart CA, Shangraw RE, Peters EJ, Wolfe RR. Effect of dietary protein on bed-rest-related changes in whole-body-protein synthesis. Am J Clin Nutr. 1990;52:509–514 [DOI] [PubMed] [Google Scholar]
- 4. Bergouignan A, Rudwill F, Simon C, Blanc S. Physical inactivity as the culprit of metabolic inflexibility: evidence from bed-rest studies. J Appl Physiol. 2011;111:1201–1210 [DOI] [PubMed] [Google Scholar]
- 5. Boden G. Obesity, insulin resistance and free fatty acids. Curr Opin Endocrinol Diabetes Obes. 2011;18:139–143 [DOI] [PMC free article] [PubMed] [Google Scholar]
- 6. Magkos F, Fabbrini E, Korenblat K, Okunade AL, Patterson BW, Klein S. Reproducibility of glucose, fatty acid and VLDL kinetics and multi-organ insulin sensitivity in obese subjects with non-alcoholic fatty liver disease. Int J Obes (Lond). 2011;35:1233–1240 [DOI] [PMC free article] [PubMed] [Google Scholar]
- 7. Magkos F, Fabbrini E, Mohammed BS, Patterson BW, Klein S. Increased whole-body adiposity without a concomitant increase in liver fat is not associated with augmented metabolic dysfunction. Obesity (Silver Spring). 2010;18:1510–1515 [DOI] [PMC free article] [PubMed] [Google Scholar]
- 8. Alibegovic AC, Højbjerre L, Sonne MP, et al. Impact of 9 days of bed rest on hepatic and peripheral insulin action, insulin secretion, and whole-body lipolysis in healthy young male offspring of patients with type 2 diabetes. Diabetes. 2009;58:2749–2756 [DOI] [PMC free article] [PubMed] [Google Scholar]
- 9. Diagnosis and classification of diabetes mellitus. Diabetes Care. 2012;35 (s uppl 1):S64–S71 [DOI] [PMC free article] [PubMed] [Google Scholar]
- 10. Kortebein P, Symons TB, Ferrando A, et al. Functional impact of 10 days of bed rest in healthy older adults. J Gerontol A Biol Sci Med Sci. 2008;63:1076–1081 [DOI] [PubMed] [Google Scholar]
- 11. Campbell WW, Johnson CA, McCabe GP, Carnell NS. Dietary protein requirements of younger and older adults. Am J Clin Nutr. 2008;88:1322–1329 [DOI] [PubMed] [Google Scholar]
- 12. Coker RH, Williams RH, Yeo SE, et al. The impact of exercise training compared to caloric restriction on hepatic and peripheral insulin resistance in obesity. J Clin Endocrinol Metab. 2009;94:4258–4266 [DOI] [PMC free article] [PubMed] [Google Scholar]
- 13. Coker RH, Williams RH, Freeling SA, Brown AD, Kortebein PM, Sullivan DH, Evans WJ. Exercise-induced changes in insulin action are reliant on glycogen metabolism in elderly adults. Med Sci Sports Exer. 2006;38:525–532 [DOI] [PubMed] [Google Scholar]
- 14. Finegood DT, Bergman RN, Vranic M. Estimation of endogenous glucose production during hyperinsulinemic-euglycemic glucose clamps. Comparison of unlabeled and labeled exogenous glucose infusates. Diabetes. 1987;36:914–924 [DOI] [PubMed] [Google Scholar]
- 15. DeFronzo RA, Tobin JD, Andres R. Glucose clamp technique: a method for quantifying insulin secretion and resistance. Am J Physiol. 1979;237:E214–E223 [DOI] [PubMed] [Google Scholar]
- 16. Wolfe RR, Chinkes DL. Isotope Tracers in Metabolic Research: Principles and Practice of Kinetic Analysis. New York, NY: Wiley; 2004 [Google Scholar]
- 17. Cree MG, Newcomer BR, Katsanos CS, et al. Intramuscular and liver triglycerides are increased in the elderly. J Clin Endocrinol Metab. 2004;89:3864–3871 [DOI] [PubMed] [Google Scholar]
- 18. Steele R. Influences of glucose loading and of injected insulin on hepatic glucose output. Ann N Y Acad Sci. 1959;82:420–430 [DOI] [PubMed] [Google Scholar]
- 19. Coker RH, Williams RH, Yeo SE, et al. Visceral fat and adiponectin: associations with insulin resistance are tissue-specific in women. Metab Syndr Relat Disord. 2009;7:61–67 [DOI] [PMC free article] [PubMed] [Google Scholar]
- 20. Hays NP, Starling RD, Sullivan DH, et al. Lack of agreement of insulin sensitivity indices with euglycemic-hyperinsulinemic clamp data following dietary and exercise intervention in older adults. Metabolism. 2006;55:525–532 [DOI] [PubMed] [Google Scholar]
- 21. Krotkiewski M. Role of muscle morphology in the development of insulin resistance and metabolic syndrome. Presse Med. 1994;23:1393–1399 [PubMed] [Google Scholar]
- 22. Båvenholm PN, Pigon J, Ostenson CG, Efendic S. Insulin sensitivity of suppression of endogenous glucose production is the single most important determinant of glucose tolerance. Diabetes. 2001;50:1449–1454 [DOI] [PubMed] [Google Scholar]
- 23. Boden G, Cheung P, Stein TP, Kresge K, Mozzoli M. FFA cause hepatic insulin resistance by inhibiting insulin suppression of glycogenolysis. Am J Physiol Endocrinol Metab. 2002;283:E12–E19 [DOI] [PubMed] [Google Scholar]
- 24. Swislocki AL, Chen YD, Golay A, Chang MO, Reaven GM. Insulin suppression of plasma-free fatty acid concentration in normal individuals and patients with type 2 (non-insulin-dependent) diabetes. Diabetologia. 1987;30:622–626 [DOI] [PubMed] [Google Scholar]
- 25. Yeckel CW, Dziura J, DiPietro L. Abdominal obesity in older women: potential role for disrupted fatty acid reesterification in insulin resistance. J Clin Endocrinol Metab. 2008;93:1285–1291 [DOI] [PMC free article] [PubMed] [Google Scholar]
- 26. Petersen KF, Dufour S, Savage DB, et al. The role of skeletal muscle insulin resistance in the pathogenesis of the metabolic syndrome. Proc Natl Acad Sci U S A. 2007;104:12587–12594 [DOI] [PMC free article] [PubMed] [Google Scholar]
- 27. Klein S, Young VR, Blackburn GL, Bistrian BR, Wolfe RR. Palmitate and glycerol kinetics during brief starvation in normal weight young adult and elderly subjects. J Clin Invest. 1986;78:928–933 [DOI] [PMC free article] [PubMed] [Google Scholar]
- 28. Mattson FH, Grundy SM. Comparison of effects of dietary saturated, monounsaturated, and polyunsaturated fatty acids on plasma lipids and lipoproteins in man. J Lipid Res. 1985;26:194–202 [PubMed] [Google Scholar]
- 29. Bergouignan A, Rudwill F, Simon C, Blanc S. Physical inactivity as the culprit of metabolic inflexibility: evidence from bed-rest studies. J Appl Physiol. 2011;111:1201–1210 [DOI] [PubMed] [Google Scholar]
- 30. Blotner H. Effect of prolonged physical activity on tolerance of sugar. Arch Intern Med. 1945;75:39–44 [Google Scholar]
- 31. Stuart CA, Shangraw RE, Prince MJ, Peters EJ, Wolfe RR. Bed-rest-induced insulin resistance occurs primarily in muscle. Metabolism. 1988;37:802–806 [DOI] [PubMed] [Google Scholar]
- 32. Bergouignan A, Momken I, Schoeller DA, Simon C, Blanc S. Metabolic fate of saturated and monounsaturated dietary fats: the Mediterranean diet revisited from epidemiological evidence to cellular mechanisms. Prog Lipid Res. 2009;48:128–147 [DOI] [PubMed] [Google Scholar]
- 33. Bergouignan A, Trudel G, Simon C, et al. Physical inactivity differentially alters dietary oleate and palmitate trafficking. Diabetes. 2009;58:367–376 [DOI] [PMC free article] [PubMed] [Google Scholar]
- 34. Choi CS, Befroy DE, Codella R, et al. Paradoxical effects of increased expression of PGC-1alpha on muscle mitochondrial function and insulin-stimulated muscle glucose metabolism. Proc Natl Acad Sci U S A. 2008;105:19926–19931 [DOI] [PMC free article] [PubMed] [Google Scholar]
- 35. Cree MG, Newcomer BR, Read LK, et al. Plasma triglycerides are not related to tissue lipids and insulin sensitivity in elderly following PPAR-alpha agonist treatment. Mech Ageing Dev. 2007;128:558–565 [DOI] [PMC free article] [PubMed] [Google Scholar]
- 36. Stettler R, Ith M, Acheson KJ, et al. Interaction between dietary lipids and physical inactivity on insulin sensitivity and on intramyocellular lipids in healthy men. Diabetes Care. 2005;28:1404–1409 [DOI] [PubMed] [Google Scholar]
- 37. Cree MG, Paddon-Jones D, Newcomer BR, et al. Twenty-eight-day bed rest with hypercortisolemia induces peripheral insulin resistance and increases intramuscular triglycerides. Metabolism. 2010;59:703–710 [DOI] [PMC free article] [PubMed] [Google Scholar]
- 38. Larsen FJ, Anderson M, Ekblom B, Nyström T. Cardiorespiratory fitness predicts insulin action and secretion in healthy individuals. Metabolism. 2012;61:12–16 [DOI] [PubMed] [Google Scholar]
- 39. Wolfe RR, Durkot MJ, Allsop JR, Burke JF. Glucose metabolism in severely burned patients. Metabolism. 1979;28:1031–1039 [DOI] [PubMed] [Google Scholar]
- 40. Sidossis LS, Wolfe RR. Glucose and insulin-induced inhibition of fatty acid oxidation: the glucose-fatty acid cycle reversed. Am J Physiol. 1996;270(4 Pt 1):E733–E738 [DOI] [PubMed] [Google Scholar]